Estimated zip code population in 2022: 2,561 Zip code population in 2010: 2,375 Zip code population in 2000: 2,304
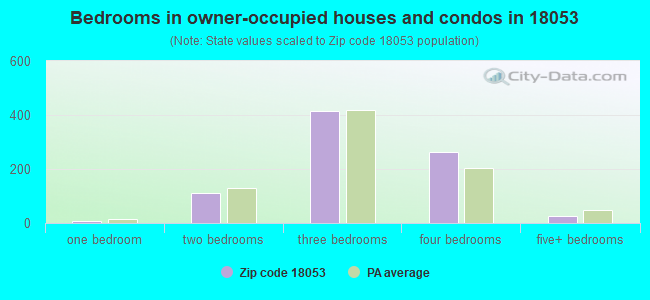
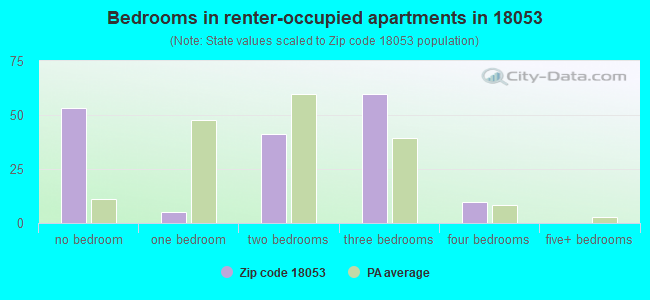
Houses and condos: 994 Renter-occupied apartments: 165
% of renters here:
17%
State:
31%
March 2022 cost of living index in zip code 18053: 93.9 (less than average, U.S. average is 100)
Land area: 16.4 sq. mi. Water area: 0.0 sq. mi.
Population density: 156 people per square mile
(very low).
OSM Map
General Map
Google Map
MSN Map
OSM Map
General Map
Google Map
MSN Map
OSM Map
General Map
Google Map
MSN Map
OSM Map
General Map
Google Map
MSN Map
Please wait while loading the map...
Real estate property taxes paid for housing units in 2022:
This zip code:
1.4% ($3,949)
Pennsylvania:
1.3% ($3,094)
Median real estate property taxes paid for housing units with mortgages in 2022: $3,423 (1.1%) Median real estate property taxes paid for housing units with no mortgage in 2022: $4,203 (1.6%)
Business Search- 14 Million verified businesses
Males: 1,242
(48.5%)
Females: 1,318
(51.5%)
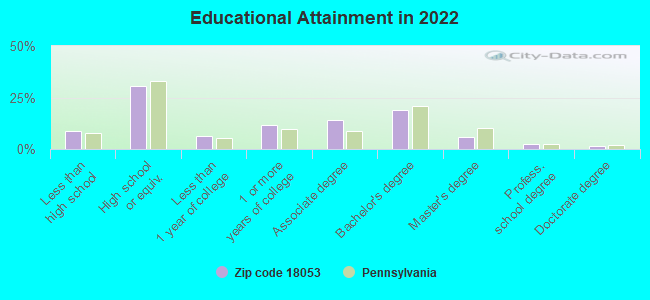
For population 25 years and over in 18053:
High school or higher: 90.2%
Bachelor's degree or higher: 28.6%
Graduate or professional degree: 9.7%
Unemployed: 2.0%
Mean travel time to work (commute): 27.0 minutes
For population 15 years and over in 18053:
Never married: 30.8%
Now married: 57.1%
Separated: 3.5%
Widowed: 1.9%
Divorced: 6.7%
Zip code 18053 compared to state average:
Unemployed percentage below state average.
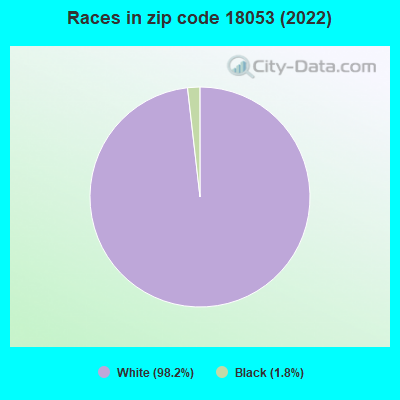
Black race population percentage significantly below state average.
Hispanic race population percentage significantly below state average.
Foreign-born population percentage significantly below state average.
Renting percentage below state average.
Length of stay since moving in significantly above state average.
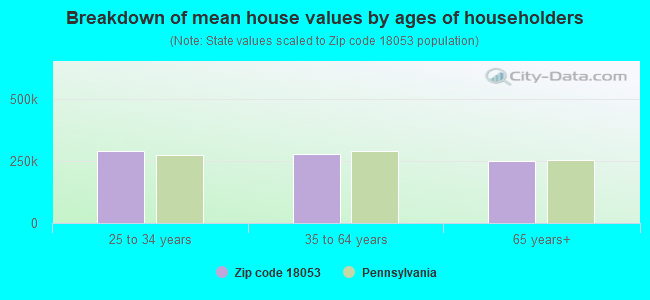
Estimated median house/condo value in 2022: $287,828
18053:
$287,828
Pennsylvania:
$245,500
According to our research of Pennsylvania and other state lists, there was 1 registered sex offender living in 18053 zip code as of May 23, 2024. The ratio of all residents to sex offenders in zip code 18053 is 2,276 to 1. The ratio of registered sex offenders to all residents in this zip code is much lower than the state average.
Median resident age:
This zip code:
41.8 years
Pennsylvania median age:
40.9 years
Average household size:
This zip code:
2.6 people
Pennsylvania:
2.4 people
Averages for the 2020 tax year for zip code 18053, filed in 2021:
Average Adjusted Gross Income (AGI) in 2020: $68,930 (Individual Income Tax Returns)
Here:
$68,930
State:
$75,707
Salary/wage: $60,410 (reported on 81.7% of returns)
Here:
$60,410
State:
$62,806
(% of AGI for various income ranges: 1018.2% for AGIs below $25k, 3486.7% for AGIs $25k-50k, 6264.6% for AGIs $50k-75k, 8665.5% for AGIs $75k-100k, 16042.1% for AGIs $100k-200k)
Taxable interest for individuals: $714 (reported on 40.8% of returns)
This zip code:
$714
Pennsylvania:
$1,633
(% of AGI for various income ranges: 35.0% for AGIs below $25k, 21.9% for AGIs $25k-50k, 55.4% for AGIs $50k-75k, 38.2% for AGIs $75k-100k, 63.6% for AGIs $100k-200k)
Ordinary dividends: $3,406 (reported on 26.7% of returns)
Here:
$3,406
State:
$7,382
(% of AGI for various income ranges: 43.2% for AGIs below $25k, 63.3% for AGIs $25k-50k, 113.8% for AGIs $50k-75k, 164.5% for AGIs $75k-100k, 380.7% for AGIs $100k-200k)
Net capital gain/loss in AGI: +$4,764 (reported on 18.3% of returns)
Here:
+$4,764
State:
+$23,522
(% of AGI for various income ranges: 1.4% for AGIs below $25k, 41.0% for AGIs $25k-50k, 201.5% for AGIs $50k-75k, 87.3% for AGIs $75k-100k, 429.3% for AGIs $100k-200k)
Profit/loss from business: +$12,446 (reported on 10.8% of returns)
Here:
+$12,446
State:
+$16,274
(% of AGI for various income ranges: 165.9% for AGIs below $25k, 370.8% for AGIs $50k-75k, 550.7% for AGIs $100k-200k)
Taxable individual retirement arrangement distribution: $13,280 (reported on 12.5% of returns)
18053:
$13,280
Pennsylvania:
$18,583
(% of AGI for various income ranges: 153.6% for AGIs below $25k, 101.9% for AGIs $25k-50k, 216.2% for AGIs $50k-75k, 240.0% for AGIs $75k-100k, 639.3% for AGIs $100k-200k)
Total itemized deductions: $28,017 (reported on 5.0% of returns)
Here:
$28,017
State:
$34,850
(% of AGI for various income ranges: 705.4% for AGIs $50k-75k, 545.7% for AGIs $100k-200k)
Charity contributions: $3,475 (reported on 3.3% of returns)
Here:
$3,475
State:
$12,392
(% of AGI for various income ranges: 126.4% for AGIs $75k-100k)
Taxes paid: $8,133 (reported on 5.0% of returns)
18053:
$8,133
State:
$8,200
(% of AGI for various income ranges: 208.5% for AGIs $50k-75k, 155.0% for AGIs $100k-200k)
Earned income credit: $1,980 (reported on 8.3% of returns)
Here:
$1,980
State:
$2,100
(% of AGI for various income ranges: 50.0% for AGIs below $25k, 41.9% for AGIs $25k-50k)
Percentage of individuals using paid preparers for their 2020 taxes: 94.2%
Here:
94%
State:
92%
(% for various income ranges: 91.4% for AGIs below $25k, 96.2% for AGIs $25k-50k, 94.7% for AGIs $50k-75k, 93.3% for AGIs $75k-100k, 95.2% for AGIs $100k-200k, 100.0% for AGIs over 200k)
Averages for the 2012 tax year for zip code 18053, filed in 2013:
Average Adjusted Gross Income (AGI) in 2012: $51,581 (Individual Income Tax Returns)
Here:
$51,581
State:
$61,346
Salary/wage: $47,819 (reported on 84.5% of returns)
Here:
$47,819
State:
$51,902
(% of AGI for various income ranges: 70.6% for AGIs below $25k, 77.9% for AGIs $25k-50k, 76.3% for AGIs $50k-75k, 81.7% for AGIs $75k-100k, 79.3% for AGIs $100k-200k)
Taxable interest for individuals: $565 (reported on 39.7% of returns)
This zip code:
$565
Pennsylvania:
$1,588
(% of AGI for various income ranges: 1.4% for AGIs below $25k, 0.5% for AGIs $25k-50k, 0.5% for AGIs $50k-75k, 0.3% for AGIs $75k-100k, 0.3% for AGIs $100k-200k)
Ordinary dividends: $1,834 (reported on 25.0% of returns)
Here:
$1,834
State:
$5,827
(% of AGI for various income ranges: 2.1% for AGIs below $25k, 1.5% for AGIs $25k-50k, 0.8% for AGIs $50k-75k, 0.4% for AGIs $75k-100k, 0.7% for AGIs $100k-200k)
Net capital gain/loss in AGI: +$167 (reported on 15.5% of returns)
Here:
+$167
State:
+$14,495
(% of AGI for various income ranges: 0.5% for AGIs $50k-75k)
Profit/loss from business: +$10,625 (reported on 13.8% of returns)
Here:
+$10,625
State:
+$16,268
(% of AGI for various income ranges: 6.3% for AGIs below $25k, 3.6% for AGIs $25k-50k, 3.2% for AGIs $50k-75k, 1.3% for AGIs $75k-100k, 2.5% for AGIs $100k-200k)
Taxable individual retirement arrangement distribution: $10,077 (reported on 11.2% of returns)
18053:
$10,077
Pennsylvania:
$14,550
(% of AGI for various income ranges: 3.2% for AGIs below $25k, 2.7% for AGIs $25k-50k, 4.6% for AGIs $50k-75k, 1.7% for AGIs $100k-200k)
Total itemized deductions: $17,845 (21% of AGI, reported on 32.8% of returns)
Here:
$17,845
State:
$23,538
Here:
21.4% of AGI
State:
18.4% of AGI
(% of AGI for various income ranges: 10.1% for AGIs below $25k, 9.4% for AGIs $25k-50k, 10.2% for AGIs $50k-75k, 12.0% for AGIs $75k-100k, 12.9% for AGIs $100k-200k)
Charity contributions: $1,760 (reported on 25.9% of returns)
Here:
$1,760
State:
$4,025
(% of AGI for various income ranges: 0.4% for AGIs $25k-50k, 0.6% for AGIs $50k-75k, 1.1% for AGIs $75k-100k, 1.4% for AGIs $100k-200k)
Taxes paid: $7,311 (reported on 32.8% of returns)
18053:
$7,311
State:
$9,982
(% of AGI for various income ranges: 2.8% for AGIs below $25k, 3.2% for AGIs $25k-50k, 3.8% for AGIs $50k-75k, 5.1% for AGIs $75k-100k, 6.1% for AGIs $100k-200k)
Earned income credit: $1,708 (reported on 11.2% of returns)
Here:
$1,708
State:
$2,106
(% of AGI for various income ranges: 3.6% for AGIs below $25k, 0.7% for AGIs $25k-50k)
Percentage of individuals using paid preparers for their 2012 taxes: 54.3%
Here:
54%
State:
53%
(% for various income ranges: 48.7% for AGIs below $25k, 55.6% for AGIs $25k-50k, 57.1% for AGIs $50k-75k, 60.0% for AGIs $75k-100k, 57.1% for AGIs $100k-200k)
Averages for the 2004 tax year for zip code 18053, filed in 2005:
Average Adjusted Gross Income (AGI) in 2004: $40,933 (Individual Income Tax Returns)
Here:
$40,933
State:
$48,049
Salary/wage: $39,312 (reported on 87.4% of returns)
Here:
$39,312
State:
$42,646
(% of AGI for various income ranges: 117.3% for AGIs below $10k, 75.9% for AGIs $10k-25k, 83.5% for AGIs $25k-50k, 83.2% for AGIs $50k-75k, 85.3% for AGIs $75k-100k, 84.8% for AGIs over 100k)
Taxable interest for individuals: $752 (reported on 53.7% of returns)
This zip code:
$752
Pennsylvania:
$1,657
(% of AGI for various income ranges: 7.7% for AGIs below $10k, 2.7% for AGIs $10k-25k, 1.2% for AGIs $25k-50k, 0.5% for AGIs $50k-75k, 0.8% for AGIs $75k-100k, 0.4% for AGIs over 100k)
Taxable dividends: $1,359 (reported on 27.3% of returns)
Here:
$1,359
State:
$3,566
(% of AGI for various income ranges: 3.6% for AGIs below $10k, 2.4% for AGIs $10k-25k, 1.4% for AGIs $25k-50k, 0.6% for AGIs $50k-75k, 0.3% for AGIs $75k-100k, 0.6% for AGIs over 100k)
Net capital gain/loss: +$914 (reported on 17.3% of returns)
Here:
+$914
State:
+$9,716
(% of AGI for various income ranges: 4.6% for AGIs below $10k, 0.7% for AGIs $10k-25k, 0.1% for AGIs $25k-50k, 0.5% for AGIs $50k-75k, 0.4% for AGIs $75k-100k, 0.1% for AGIs over 100k)
Profit/loss from business: +$8,895 (reported on 15.0% of returns)
Here:
+$8,895
State:
+$14,267
(% of AGI for various income ranges: 2.8% for AGIs below $10k, 3.8% for AGIs $10k-25k, 2.2% for AGIs $25k-50k, 5.1% for AGIs $50k-75k, 1.2% for AGIs $75k-100k, 3.8% for AGIs over 100k)
Profit/loss from farming: +$1,111 (reported on 1.6% of returns)
Here:
+$1,111
State:
+$274
IRA payment deduction: $2,844 (reported on 3.9% of returns)
18053:
$2,844
Pennsylvania:
$2,903
Total itemized deductions: $14,897 (22% of AGI, reported on 35.7% of returns)
Here:
$14,897
State:
$18,804
Here:
21.6% of AGI
State:
19.5% of AGI
(% of AGI for various income ranges: 11.3% for AGIs $10k-25k, 10.4% for AGIs $25k-50k, 13.4% for AGIs $50k-75k, 16.3% for AGIs $75k-100k, 13.7% for AGIs over 100k)
Charity contributions deductions: $1,521 (2% of AGI, reported on 30.7% of returns)
Here:
$1,521
State:
$3,337
Here:
2.1% of AGI
State:
3.3% of AGI
(% of AGI for various income ranges: 0.5% for AGIs $10k-25k, 0.7% for AGIs $25k-50k, 1.2% for AGIs $50k-75k, 1.4% for AGIs $75k-100k, 1.6% for AGIs over 100k)
Total tax: $4,859 (reported on 77.8% of returns)
18053:
$4,859
State:
$8,008
(% of AGI for various income ranges: 3.9% for AGIs below $10k, 4.6% for AGIs $10k-25k, 7.1% for AGIs $25k-50k, 8.7% for AGIs $50k-75k, 9.5% for AGIs $75k-100k, 14.5% for AGIs over 100k)
Earned income credit: $1,432 (reported on 10.3% of returns)
Here:
$1,432
State:
$1,643
Percentage of individuals using paid preparers for their 2004 taxes: 55.3%
Here:
55%
State:
56%
(% for various income ranges: 44.5% for AGIs below $10k, 54.0% for AGIs $10k-25k, 58.9% for AGIs $25k-50k, 62.9% for AGIs $50k-75k, 53.1% for AGIs $75k-100k, 61.1% for AGIs over 100k)
Household received Food Stamps/SNAP in the past 12 months: 96 Household did not receive Food Stamps/SNAP in the past 12 months: 886
Women who had a birth in the past 12 months: 18 (19 now married, 0 unmarried) Women who did not have a birth in the past 12 months: 577 (272 now married, 303 unmarried)
Housing units in zip code 18053 with a mortgage: 540 (64 second mortgage, 42 both second mortgage and home equity loan) Houses without a mortgage: 14
Median monthly owner costs for units with a mortgage: $1,410 Median monthly owner costs for units without a mortgage: $707
Residents with income below the poverty level in 2022:
This zip code:
2.9%
Whole state:
11.8%
Residents with income below 50% of the poverty level in 2022:
This zip code:
0.3%
Whole state:
6.1%
Median number of rooms in houses and condos:
Here:
6.2
State:
6.8
Median number of rooms in apartments:
Here:
5.1
State:
4.3
Notable locations in this zip code not listed on our city pages
Size of family households: 250 2-persons, 135 3-persons, 96 4-persons, 140 5-persons, 20 6-persons
Size of nonfamily households: 269 1-person, 63 2-persons, 8 3-persons
490 married couples with children.
18 single-parent households (18 women).
96.1% of residents of 18053 zip code speak English at home.
0.2% of residents speak Spanish at home (100% very well).
2.9% of residents speak other Indo-European language at home (86% very well, 14% well).
Foreign born population: 12 (0.5%) (51.0% of them are naturalized citizens)
This zip code:
0.5%
Whole state:
7.5%
50%Belgium
50%Poland
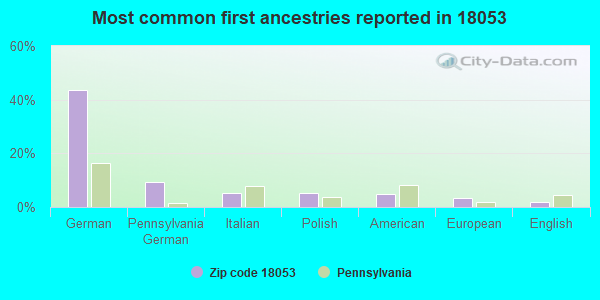
44%German
9%Pennsylvania German
5%Italian
5%Polish
5%American
3%European
2%English
Year of entry for the foreign-born population
02010 or later
112000 to 2009
01990 to 1999
0Before 1990
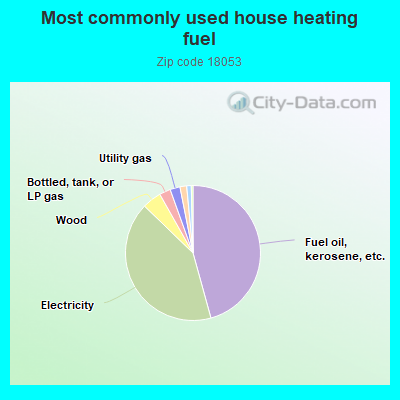
45.9%Fuel oil, kerosene, etc.
41.7%Electricity
4.6%Wood
2.7%Bottled, tank, or LP gas
2.4%Utility gas
1.6%No fuel used
1.1%Coal or coke
Population in 1990: 975. Population change in the 1990s: +1,329 (+136.3%).
Place of birth for U.S.-born residents:
This state: 2,213
Northeast: 209
Midwest: 84
South: 9
West: 17
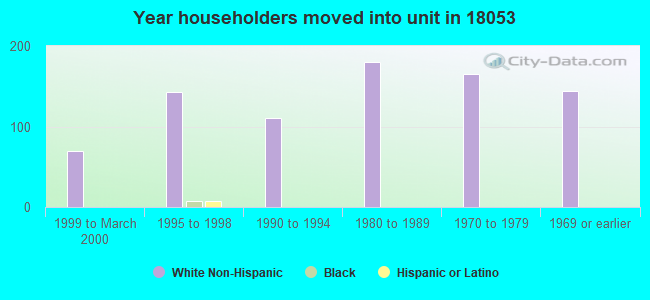
78% of the 18053 zip code residents lived in the same house 5 years ago. Out of people who lived in different houses, 67% lived in this county. Out of people who lived in different counties, 50% lived in Pennsylvania.
92% of the 18053 zip code residents lived in the same house 1 year ago. Out of people who lived in different houses, 83% moved from this county. Out of people who lived in different houses, 12% moved from different county within same state. Out of people who lived in different houses, 4% moved from different state.
Private vs. public school enrollment:
Students in private schools in grades 1 to 8 (elementary and middle school):
Here:
0.0%
Pennsylvania:
15.7%
Students in private schools in grades 9 to 12 (high school): 9
Here:
5.7%
Pennsylvania:
13.4%
Students in private undergraduate colleges: 8
Here:
12.5%
Pennsylvania:
39.8%
Occupation by median earnings in the past 12 months ($)
78,209Transportation occupations
76,325Management occupations
70,038Education, training, and library occupations
55,125Health diagnosing and treating practitioners and other technical occupations
48,408Material moving occupations
47,602Sales and related occupations
Companies with federal contracts located in this zip code:
MS4 VACUUM (5141 INNWOOD DR in GERMANSVILLE, PA; small business)
$2,250 with Army for Maintenance, Repair and Rebuilding of Equipment -- Electrical and Electronic Equipment Components. Signed on 2004-11-29. Completion date: 2005-11-30.
Top industries in this zip code by the number of employees in 2005:
Administrative and Support and Waste Management and Remediation Services: Temporary Help Services (20-49 employees: 1 establishment)
Health Care and Social Assistance: Residential Mental Retardation Facilities (10-19: 1)
Construction: Poured Concrete Foundation and Structure Contractors (10-19: 1)
Construction: Electrical Contractors (5-9: 1)
Other Services (except Public Administration): General Automotive Repair (5-9: 1)
Other Services (except Public Administration): All Other Automotive Repair and Maintenance (5-9: 1)
Construction: Residential Remodelers (1-4: 3)
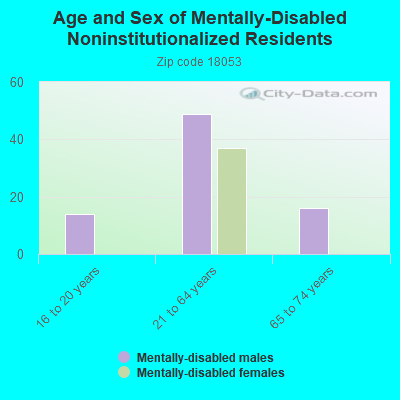
People in group quarters in 2000:
6 people in homes for the mentally retarded
Fatal accident statistics in 2012:
Fatal accident count: 1
Vehicles involved in fatal accidents: 2
Fatal accidents caused by drunken drivers: 0
Fatalities: 5
Persons involved in fatal accidents: 6
Pedestrians involved in fatal accidents: 0
Home Mortgage Disclosure Act Aggregated Statistics For Year 2009 (Based on 2 partial tracts)
A) FHA, FSA/RHS & VA Home Purchase Loans
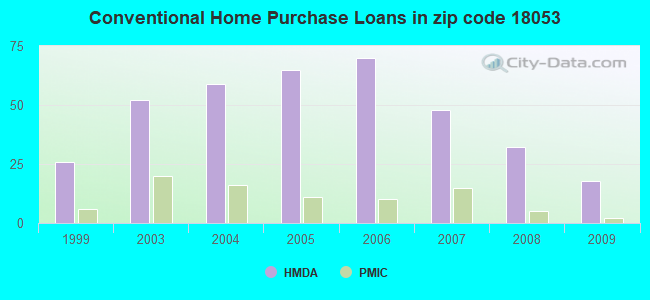
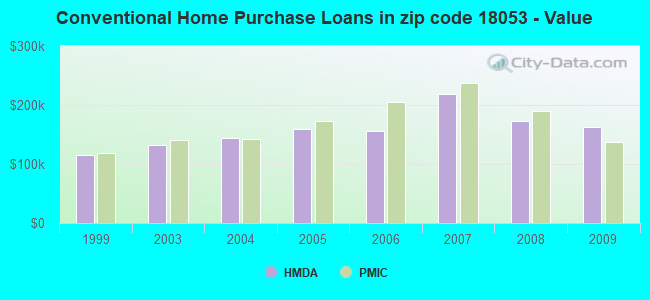
B) Conventional Home Purchase Loans
C) Refinancings
D) Home Improvement Loans
E) Loans on Dwellings For 5+ Families
F) Non-occupant Loans on < 5 Family Dwellings (A B C & D)
G) Loans On Manufactured Home Dwelling (A B C & D)
Number
Average Value
Number
Average Value
Number
Average Value
Number
Average Value
Number
Average Value
Number
Average Value
Number
Average Value
LOANS ORIGINATED
14
$196,126
18
$162,132
106
$185,058
14
$112,183
1
$133,330
4
$94,575
5
$117,314
APPLICATIONS APPROVED, NOT ACCEPTED
1
$121,960
2
$197,160
9
$191,906
1
$28,420
0
$0
0
$0
0
$0
APPLICATIONS DENIED
1
$149,870
3
$151,940
40
$209,601
6
$41,000
0
$0
1
$410,860
3
$122,480
APPLICATIONS WITHDRAWN
2
$201,550
1
$81,140
17
$211,128
4
$51,680
0
$0
1
$106,460
0
$0
FILES CLOSED FOR INCOMPLETENESS
0
$0
0
$0
4
$177,132
0
$0
0
$0
0
$0
0
$0
Aggregated Statistics For Year 2008 (Based on 2 partial tracts)
A) FHA, FSA/RHS & VA Home Purchase Loans
B) Conventional Home Purchase Loans
C) Refinancings
D) Home Improvement Loans
F) Non-occupant Loans on < 5 Family Dwellings (A B C & D)
G) Loans On Manufactured Home Dwelling (A B C & D)
Number
Average Value
Number
Average Value
Number
Average Value
Number
Average Value
Number
Average Value
Number
Average Value
LOANS ORIGINATED
14
$221,596
32
$173,596
75
$158,926
27
$64,944
9
$139,880
6
$109,475
APPLICATIONS APPROVED, NOT ACCEPTED
1
$137,990
2
$147,290
15
$135,574
3
$70,283
0
$0
2
$118,865
APPLICATIONS DENIED
5
$198,452
5
$135,608
36
$190,340
6
$47,373
1
$135,920
5
$92,300
APPLICATIONS WITHDRAWN
2
$206,460
3
$182,430
14
$186,749
2
$73,125
0
$0
1
$53,230
FILES CLOSED FOR INCOMPLETENESS
0
$0
0
$0
3
$165,377
0
$0
1
$82,170
0
$0
Aggregated Statistics For Year 2007 (Based on 2 partial tracts)
A) FHA, FSA/RHS & VA Home Purchase Loans
B) Conventional Home Purchase Loans
C) Refinancings
D) Home Improvement Loans
F) Non-occupant Loans on < 5 Family Dwellings (A B C & D)
G) Loans On Manufactured Home Dwelling (A B C & D)
Number
Average Value
Number
Average Value
Number
Average Value
Number
Average Value
Number
Average Value
Number
Average Value
LOANS ORIGINATED
2
$188,375
48
$218,014
83
$136,983
36
$57,996
8
$109,498
6
$121,275
APPLICATIONS APPROVED, NOT ACCEPTED
0
$0
6
$121,965
18
$114,844
8
$55,362
1
$53,230
2
$54,005
APPLICATIONS DENIED
1
$64,080
11
$131,831
48
$163,890
13
$73,028
2
$239,535
3
$58,053
APPLICATIONS WITHDRAWN
1
$96,120
6
$155,298
16
$168,864
2
$54,520
1
$47,030
0
$0
FILES CLOSED FOR INCOMPLETENESS
1
$106,980
3
$232,043
4
$231,010
0
$0
0
$0
0
$0
Aggregated Statistics For Year 2006 (Based on 2 partial tracts)
A) FHA, FSA/RHS & VA Home Purchase Loans
B) Conventional Home Purchase Loans
C) Refinancings
D) Home Improvement Loans
E) Loans on Dwellings For 5+ Families
F) Non-occupant Loans on < 5 Family Dwellings (A B C & D)
G) Loans On Manufactured Home Dwelling (A B C & D)
Number
Average Value
Number
Average Value
Number
Average Value
Number
Average Value
Number
Average Value
Number
Average Value
Number
Average Value
LOANS ORIGINATED
4
$135,272
70
$155,136
113
$139,358
45
$49,900
1
$139,540
8
$105,880
7
$77,446
APPLICATIONS APPROVED, NOT ACCEPTED
1
$126,100
6
$199,053
18
$133,047
4
$29,845
0
$0
1
$44,440
1
$82,170
APPLICATIONS DENIED
1
$94,060
10
$198,451
52
$174,221
11
$42,706
0
$0
0
$0
2
$54,265
APPLICATIONS WITHDRAWN
0
$0
4
$286,565
38
$143,956
3
$96,987
0
$0
2
$76,745
2
$78,555
FILES CLOSED FOR INCOMPLETENESS
0
$0
1
$177,260
8
$182,236
1
$198,970
0
$0
0
$0
0
$0
Aggregated Statistics For Year 2005 (Based on 2 partial tracts)
A) FHA, FSA/RHS & VA Home Purchase Loans
B) Conventional Home Purchase Loans
C) Refinancings
D) Home Improvement Loans
E) Loans on Dwellings For 5+ Families
F) Non-occupant Loans on < 5 Family Dwellings (A B C & D)
G) Loans On Manufactured Home Dwelling (A B C & D)
Number
Average Value
Number
Average Value
Number
Average Value
Number
Average Value
Number
Average Value
Number
Average Value
Number
Average Value
LOANS ORIGINATED
4
$156,978
65
$158,864
120
$128,050
37
$59,320
1
$96,640
7
$150,241
6
$96,470
APPLICATIONS APPROVED, NOT ACCEPTED
1
$101,810
7
$136,361
19
$124,549
3
$25,323
0
$0
0
$0
2
$138,500
APPLICATIONS DENIED
1
$95,090
12
$178,512
54
$129,047
13
$68,258
0
$0
3
$230,667
2
$81,395
APPLICATIONS WITHDRAWN
0
$0
11
$173,222
38
$138,122
5
$121,552
0
$0
2
$164,860
3
$134,540
FILES CLOSED FOR INCOMPLETENESS
0
$0
2
$129,975
13
$147,328
2
$17,830
0
$0
0
$0
0
$0
Aggregated Statistics For Year 2004 (Based on 2 partial tracts)
A) FHA, FSA/RHS & VA Home Purchase Loans
B) Conventional Home Purchase Loans
C) Refinancings
D) Home Improvement Loans
E) Loans on Dwellings For 5+ Families
F) Non-occupant Loans on < 5 Family Dwellings (A B C & D)
G) Loans On Manufactured Home Dwelling (A B C & D)
Number
Average Value
Number
Average Value
Number
Average Value
Number
Average Value
Number
Average Value
Number
Average Value
Number
Average Value
LOANS ORIGINATED
7
$126,616
59
$144,686
134
$111,378
36
$55,197
1
$206,720
10
$116,435
6
$89,320
APPLICATIONS APPROVED, NOT ACCEPTED
1
$90,440
6
$180,793
20
$118,373
3
$16,193
0
$0
1
$70,800
1
$54,260
APPLICATIONS DENIED
1
$64,600
12
$121,792
56
$121,503
13
$33,751
0
$0
1
$167,440
2
$66,665
APPLICATIONS WITHDRAWN
1
$127,130
4
$136,692
44
$146,665
3
$95,953
0
$0
1
$38,760
2
$73,645
FILES CLOSED FOR INCOMPLETENESS
1
$32,560
1
$120,410
11
$130,375
1
$22,740
0
$0
0
$0
0
$0
Aggregated Statistics For Year 2003 (Based on 2 partial tracts)
A) FHA, FSA/RHS & VA Home Purchase Loans
B) Conventional Home Purchase Loans
C) Refinancings
D) Home Improvement Loans
E) Loans on Dwellings For 5+ Families
F) Non-occupant Loans on < 5 Family Dwellings (A B C & D)
Number
Average Value
Number
Average Value
Number
Average Value
Number
Average Value
Number
Average Value
Number
Average Value
LOANS ORIGINATED
7
$118,051
52
$132,549
240
$116,799
20
$36,874
0
$0
8
$97,288
APPLICATIONS APPROVED, NOT ACCEPTED
1
$41,860
5
$118,140
23
$107,427
4
$38,502
0
$0
1
$72,350
APPLICATIONS DENIED
1
$60,980
7
$108,823
69
$109,045
6
$35,487
0
$0
3
$103,877
APPLICATIONS WITHDRAWN
1
$44,440
5
$154,834
48
$125,033
1
$7,750
1
$380,360
1
$53,750
FILES CLOSED FOR INCOMPLETENESS
0
$0
3
$119,727
8
$100,452
0
$0
0
$0
0
$0
Aggregated Statistics For Year 1999 (Based on 2 partial tracts)
A) FHA, FSA/RHS & VA Home Purchase Loans
B) Conventional Home Purchase Loans
C) Refinancings
D) Home Improvement Loans
F) Non-occupant Loans on < 5 Family Dwellings (A B C & D)

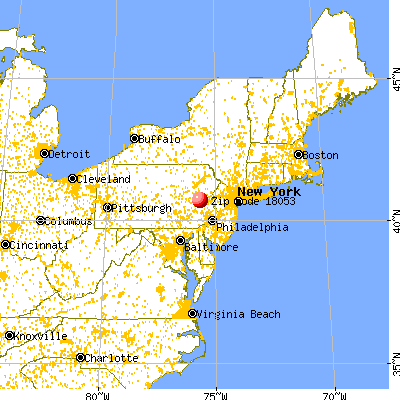


 Nearest zip codes: 18079, 18212, 18066, 18080, 18030, 18078.