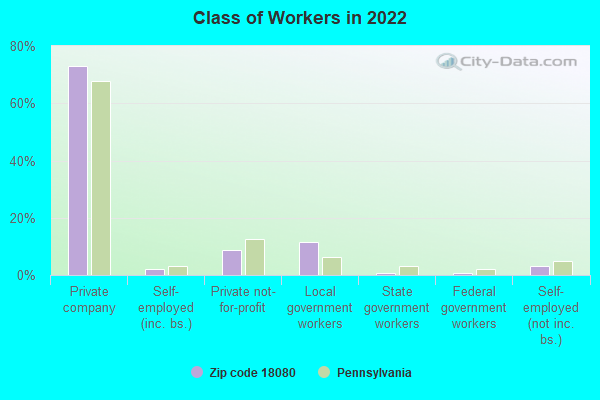
Estimated zip code population in 2022: 11,236 Zip code population in 2010: 11,456 Zip code population in 2000: 11,609
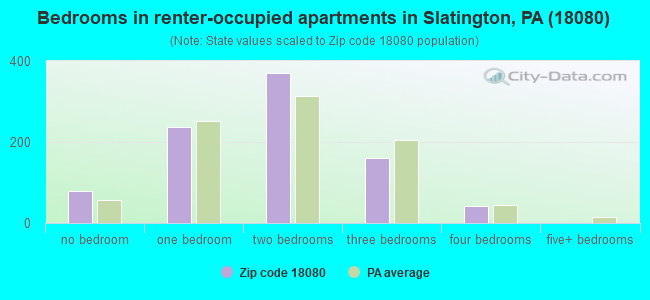
Houses and condos: 4,886 Renter-occupied apartments: 884
% of renters here:
19%
State:
31%
March 2022 cost of living index in zip code 18080: 97.7 (near average, U.S. average is 100)
Land area: 30.7 sq. mi. Water area: 0.3 sq. mi.
Population density: 366 people per square mile
(very low).
OSM Map
General Map
Google Map
MSN Map
OSM Map
General Map
Google Map
MSN Map
OSM Map
General Map
Google Map
MSN Map
OSM Map
General Map
Google Map
MSN Map
Please wait while loading the map...
Real estate property taxes paid for housing units in 2022:
This zip code:
1.7% ($4,236)
Pennsylvania:
1.3% ($3,094)
Median real estate property taxes paid for housing units with mortgages in 2022: $3,847 (1.5%) Median real estate property taxes paid for housing units with no mortgage in 2022: $4,821 (1.9%)
Business Search- 14 Million verified businesses
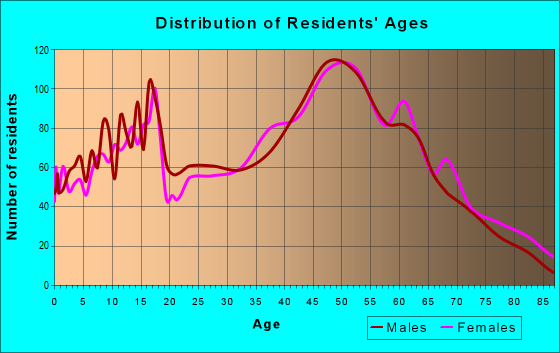
Males: 5,815
(51.8%)
Females: 5,420
(48.2%)
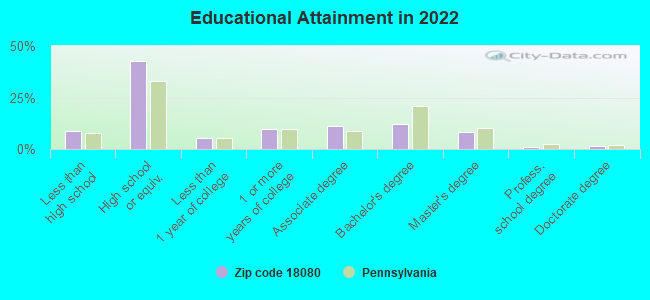
For population 25 years and over in 18080:
High school or higher: 90.8%
Bachelor's degree or higher: 22.5%
Graduate or professional degree: 10.3%
Unemployed: 3.4%
Mean travel time to work (commute): 30.1 minutes
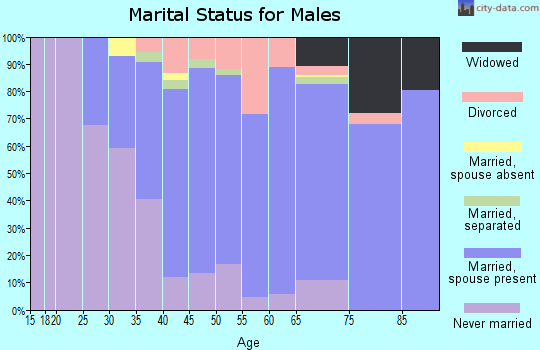
For population 15 years and over in 18080:
Never married: 25.3%
Now married: 55.5%
Separated: 1.5%
Widowed: 7.0%
Divorced: 10.7%
Zip code 18080 compared to state average:
Black race population percentage significantly below state average.
Foreign-born population percentage significantly below state average.
Renting percentage below state average.
Length of stay since moving in above state average.
Number of college students below state average.
Percentage of population with a bachelor's degree or higher below state average.
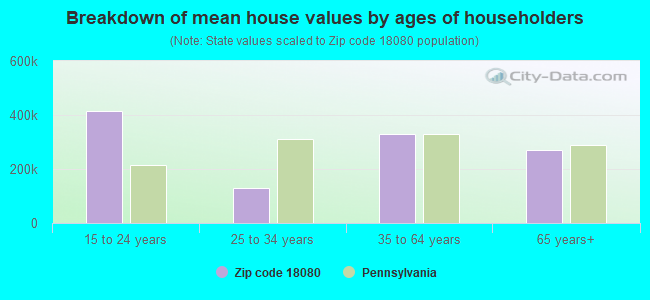
Estimated median house/condo value in 2022: $252,120
18080:
$252,120
Pennsylvania:
$245,500
According to our research of Pennsylvania and other state lists, there were 14 registered sex offenders living in 18080 zip code as of June 02, 2024. The ratio of all residents to sex offenders in zip code 18080 is 835 to 1. The ratio of registered sex offenders to all residents in this zip code is lower than the state average.
Median resident age:
This zip code:
41.4 years
Pennsylvania median age:
40.9 years
Average household size:
This zip code:
2.4 people
Pennsylvania:
2.4 people
Averages for the 2020 tax year for zip code 18080, filed in 2021:
Average Adjusted Gross Income (AGI) in 2020: $61,554 (Individual Income Tax Returns)
Here:
$61,554
State:
$75,707
Salary/wage: $55,342 (reported on 81.5% of returns)
Here:
$55,342
State:
$62,806
(% of AGI for various income ranges: 1064.0% for AGIs below $25k, 3387.7% for AGIs $25k-50k, 6479.6% for AGIs $50k-75k, 9421.1% for AGIs $75k-100k, 16968.2% for AGIs $100k-200k, 68142.0% for AGIs over 200k)
Taxable interest for individuals: $1,166 (reported on 33.1% of returns)
This zip code:
$1,166
Pennsylvania:
$1,633
(% of AGI for various income ranges: 24.2% for AGIs below $25k, 20.9% for AGIs $25k-50k, 39.3% for AGIs $50k-75k, 47.7% for AGIs $75k-100k, 122.1% for AGIs $100k-200k, 1196.0% for AGIs over 200k)
Ordinary dividends: $3,720 (reported on 21.2% of returns)
Here:
$3,720
State:
$7,382
(% of AGI for various income ranges: 36.7% for AGIs below $25k, 29.5% for AGIs $25k-50k, 99.0% for AGIs $50k-75k, 138.9% for AGIs $75k-100k, 276.6% for AGIs $100k-200k, 2130.0% for AGIs over 200k)
Net capital gain/loss in AGI: +$7,343 (reported on 15.4% of returns)
Here:
+$7,343
State:
+$23,522
(% of AGI for various income ranges: 15.1% for AGIs below $25k, 21.0% for AGIs $25k-50k, 83.7% for AGIs $50k-75k, 160.2% for AGIs $75k-100k, 367.3% for AGIs $100k-200k, 6022.0% for AGIs over 200k)
Profit/loss from business: +$13,990 (reported on 10.1% of returns)
Here:
+$13,990
State:
+$16,274
(% of AGI for various income ranges: 49.4% for AGIs below $25k, 96.5% for AGIs $25k-50k, 152.2% for AGIs $50k-75k, 270.7% for AGIs $75k-100k, 307.3% for AGIs $100k-200k, 5424.0% for AGIs over 200k)
Taxable individual retirement arrangement distribution: $15,877 (reported on 11.6% of returns)
18080:
$15,877
Pennsylvania:
$18,583
(% of AGI for various income ranges: 81.7% for AGIs below $25k, 90.6% for AGIs $25k-50k, 220.3% for AGIs $50k-75k, 350.2% for AGIs $75k-100k, 731.8% for AGIs $100k-200k, 3494.0% for AGIs over 200k)
Total itemized deductions: $24,556 (reported on 6.0% of returns)
Here:
$24,556
State:
$34,850
(% of AGI for various income ranges: 49.3% for AGIs below $25k, 73.8% for AGIs $25k-50k, 264.7% for AGIs $50k-75k, 309.3% for AGIs $75k-100k, 519.5% for AGIs $100k-200k, 2244.0% for AGIs over 200k)
Charity contributions: $5,881 (reported on 3.5% of returns)
Here:
$5,881
State:
$12,392
(% of AGI for various income ranges: 7.4% for AGIs below $25k, 21.6% for AGIs $50k-75k, 24.5% for AGIs $75k-100k, 111.6% for AGIs $100k-200k, 508.0% for AGIs over 200k)
Taxes paid: $7,533 (reported on 6.0% of returns)
18080:
$7,533
State:
$8,200
(% of AGI for various income ranges: 11.7% for AGIs below $25k, 18.4% for AGIs $25k-50k, 81.8% for AGIs $50k-75k, 123.6% for AGIs $75k-100k, 152.5% for AGIs $100k-200k, 692.0% for AGIs over 200k)
Earned income credit: $2,123 (reported on 11.6% of returns)
Here:
$2,123
State:
$2,100
(% of AGI for various income ranges: 75.1% for AGIs below $25k, 46.0% for AGIs $25k-50k)
Percentage of individuals using paid preparers for their 2020 taxes: 92.6%
Here:
93%
State:
92%
(% for various income ranges: 90.6% for AGIs below $25k, 94.1% for AGIs $25k-50k, 94.1% for AGIs $50k-75k, 93.7% for AGIs $75k-100k, 91.4% for AGIs $100k-200k, 93.8% for AGIs over 200k)
Averages for the 2012 tax year for zip code 18080, filed in 2013:
Average Adjusted Gross Income (AGI) in 2012: $48,884 (Individual Income Tax Returns)
Here:
$48,884
State:
$61,346
Salary/wage: $44,360 (reported on 84.5% of returns)
Here:
$44,360
State:
$51,902
(% of AGI for various income ranges: 69.8% for AGIs below $25k, 80.7% for AGIs $25k-50k, 78.1% for AGIs $50k-75k, 78.0% for AGIs $75k-100k, 77.8% for AGIs $100k-200k, 66.6% for AGIs over 200k)
Taxable interest for individuals: $1,080 (reported on 36.7% of returns)
This zip code:
$1,080
Pennsylvania:
$1,588
(% of AGI for various income ranges: 1.5% for AGIs below $25k, 0.7% for AGIs $25k-50k, 0.8% for AGIs $50k-75k, 0.7% for AGIs $75k-100k, 0.5% for AGIs $100k-200k, 1.4% for AGIs over 200k)
Ordinary dividends: $2,828 (reported on 23.3% of returns)
Here:
$2,828
State:
$5,827
(% of AGI for various income ranges: 1.9% for AGIs below $25k, 0.8% for AGIs $25k-50k, 1.0% for AGIs $50k-75k, 1.0% for AGIs $75k-100k, 1.3% for AGIs $100k-200k, 3.4% for AGIs over 200k)
Net capital gain/loss in AGI: +$2,934 (reported on 13.6% of returns)
Here:
+$2,934
State:
+$14,495
(% of AGI for various income ranges: 0.2% for AGIs $25k-50k, 0.5% for AGIs $50k-75k, 0.8% for AGIs $75k-100k, 0.7% for AGIs $100k-200k, 3.6% for AGIs over 200k)
Profit/loss from business: +$14,023 (reported on 10.5% of returns)
Here:
+$14,023
State:
+$16,268
(% of AGI for various income ranges: 4.1% for AGIs below $25k, 2.9% for AGIs $25k-50k, 1.9% for AGIs $50k-75k, 1.7% for AGIs $75k-100k, 2.7% for AGIs $100k-200k, 8.6% for AGIs over 200k)
Taxable individual retirement arrangement distribution: $12,096 (reported on 11.4% of returns)
18080:
$12,096
Pennsylvania:
$14,550
(% of AGI for various income ranges: 3.9% for AGIs below $25k, 2.0% for AGIs $25k-50k, 2.2% for AGIs $50k-75k, 2.6% for AGIs $75k-100k, 4.8% for AGIs $100k-200k)
Self-employment retirement plans: $12,500 (reported on 0.3% of returns)
18080:
$12,500
Pennsylvania:
$20,922
Total itemized deductions: $18,461 (21% of AGI, reported on 31.3% of returns)
Here:
$18,461
State:
$23,538
Here:
21.4% of AGI
State:
18.4% of AGI
(% of AGI for various income ranges: 8.8% for AGIs below $25k, 8.9% for AGIs $25k-50k, 11.9% for AGIs $50k-75k, 12.8% for AGIs $75k-100k, 13.9% for AGIs $100k-200k, 12.6% for AGIs over 200k)
Charity contributions: $1,941 (reported on 22.8% of returns)
Here:
$1,941
State:
$4,025
(% of AGI for various income ranges: 0.4% for AGIs below $25k, 0.6% for AGIs $25k-50k, 0.8% for AGIs $50k-75k, 0.9% for AGIs $75k-100k, 1.2% for AGIs $100k-200k, 1.3% for AGIs over 200k)
Taxes paid: $7,853 (reported on 31.3% of returns)
18080:
$7,853
State:
$9,982
(% of AGI for various income ranges: 2.6% for AGIs below $25k, 3.3% for AGIs $25k-50k, 4.6% for AGIs $50k-75k, 5.4% for AGIs $75k-100k, 6.7% for AGIs $100k-200k, 6.5% for AGIs over 200k)
Earned income credit: $1,851 (reported on 13.4% of returns)
Here:
$1,851
State:
$2,106
(% of AGI for various income ranges: 4.3% for AGIs below $25k, 0.8% for AGIs $25k-50k)
Percentage of individuals using paid preparers for their 2012 taxes: 54.8%
Here:
55%
State:
53%
(% for various income ranges: 50.0% for AGIs below $25k, 52.8% for AGIs $25k-50k, 60.2% for AGIs $50k-75k, 62.5% for AGIs $75k-100k, 58.9% for AGIs $100k-200k, 66.7% for AGIs over 200k)
Averages for the 2004 tax year for zip code 18080, filed in 2005:
Average Adjusted Gross Income (AGI) in 2004: $41,051 (Individual Income Tax Returns)
Here:
$41,051
State:
$48,049
Salary/wage: $38,719 (reported on 86.1% of returns)
Here:
$38,719
State:
$42,646
(% of AGI for various income ranges: 98.3% for AGIs below $10k, 72.6% for AGIs $10k-25k, 83.0% for AGIs $25k-50k, 86.2% for AGIs $50k-75k, 88.2% for AGIs $75k-100k, 70.7% for AGIs over 100k)
Taxable interest for individuals: $1,170 (reported on 51.7% of returns)
This zip code:
$1,170
Pennsylvania:
$1,657
(% of AGI for various income ranges: 6.2% for AGIs below $10k, 2.8% for AGIs $10k-25k, 1.3% for AGIs $25k-50k, 1.2% for AGIs $50k-75k, 0.8% for AGIs $75k-100k, 1.5% for AGIs over 100k)
Taxable dividends: $2,027 (reported on 27.1% of returns)
Here:
$2,027
State:
$3,566
(% of AGI for various income ranges: 4.4% for AGIs below $10k, 1.7% for AGIs $10k-25k, 1.0% for AGIs $25k-50k, 0.8% for AGIs $50k-75k, 0.7% for AGIs $75k-100k, 2.4% for AGIs over 100k)
Net capital gain/loss: +$3,371 (reported on 17.9% of returns)
Here:
+$3,371
State:
+$9,716
(% of AGI for various income ranges: -1.0% for AGIs below $10k, 0.6% for AGIs $10k-25k, 0.5% for AGIs $25k-50k, 0.7% for AGIs $50k-75k, 0.8% for AGIs $75k-100k, 4.4% for AGIs over 100k)
Profit/loss from business: +$12,777 (reported on 11.6% of returns)
Here:
+$12,777
State:
+$14,267
(% of AGI for various income ranges: 7.5% for AGIs below $10k, 4.2% for AGIs $10k-25k, 2.7% for AGIs $25k-50k, 2.4% for AGIs $50k-75k, 2.1% for AGIs $75k-100k, 6.6% for AGIs over 100k)
IRA payment deduction: $2,771 (reported on 3.1% of returns)
18080:
$2,771
Pennsylvania:
$2,903
(% of AGI for various income ranges: 0.3% for AGIs $10k-25k, 0.3% for AGIs $25k-50k, 0.2% for AGIs $50k-75k, 0.1% for AGIs $75k-100k, 0.1% for AGIs over 100k)
Self-employed pension: $13,808 (reported on 0.5% of returns)
Here:
$13,808
Pennsylvania:
$14,674
Total itemized deductions: $15,456 (21% of AGI, reported on 33.0% of returns)
Here:
$15,456
State:
$18,804
Here:
21.5% of AGI
State:
19.5% of AGI
(% of AGI for various income ranges: 11.2% for AGIs below $10k, 8.2% for AGIs $10k-25k, 10.2% for AGIs $25k-50k, 13.8% for AGIs $50k-75k, 14.7% for AGIs $75k-100k, 13.3% for AGIs over 100k)
Charity contributions deductions: $1,789 (2% of AGI, reported on 28.1% of returns)
Here:
$1,789
State:
$3,337
Here:
2.4% of AGI
State:
3.3% of AGI
(% of AGI for various income ranges: 0.3% for AGIs below $10k, 0.5% for AGIs $10k-25k, 0.9% for AGIs $25k-50k, 1.1% for AGIs $50k-75k, 1.4% for AGIs $75k-100k, 1.9% for AGIs over 100k)
Total tax: $5,325 (reported on 76.9% of returns)
18080:
$5,325
State:
$8,008
(% of AGI for various income ranges: 2.6% for AGIs below $10k, 4.6% for AGIs $10k-25k, 7.1% for AGIs $25k-50k, 8.5% for AGIs $50k-75k, 10.1% for AGIs $75k-100k, 17.1% for AGIs over 100k)
Earned income credit: $1,514 (reported on 10.9% of returns)
Here:
$1,514
State:
$1,643
Percentage of individuals using paid preparers for their 2004 taxes: 56.4%
Here:
56%
State:
56%
(% for various income ranges: 51.9% for AGIs below $10k, 53.7% for AGIs $10k-25k, 56.5% for AGIs $25k-50k, 61.7% for AGIs $50k-75k, 56.8% for AGIs $75k-100k, 67.2% for AGIs over 100k)
Likely homosexual households (counted as self-reported same-sex unmarried-partner households)
Lesbian couples: 0.4% of all households
Gay men: 0.0% of all households
Household received Food Stamps/SNAP in the past 12 months: 624 Household did not receive Food Stamps/SNAP in the past 12 months: 3,952
Women who had a birth in the past 12 months: 110 (117 now married, 0 unmarried) Women who did not have a birth in the past 12 months: 2,139 (1,055 now married, 1,077 unmarried)
Housing units in zip code 18080 with a mortgage: 2,173 (164 second mortgage, 151 both second mortgage and home equity loan) Houses without a mortgage: 216
Median monthly owner costs for units with a mortgage: $1,419 Median monthly owner costs for units without a mortgage: $742
Residents with income below the poverty level in 2022:
This zip code:
11.9%
Whole state:
11.8%
Residents with income below 50% of the poverty level in 2022:
This zip code:
6.0%
Whole state:
6.1%
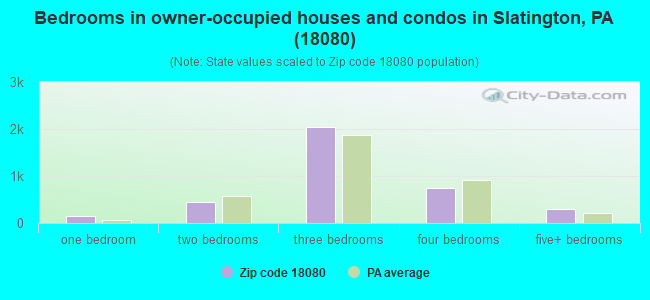
Median number of rooms in houses and condos:
Here:
7.1
State:
6.8
Median number of rooms in apartments:
Here:
4.2
State:
4.3
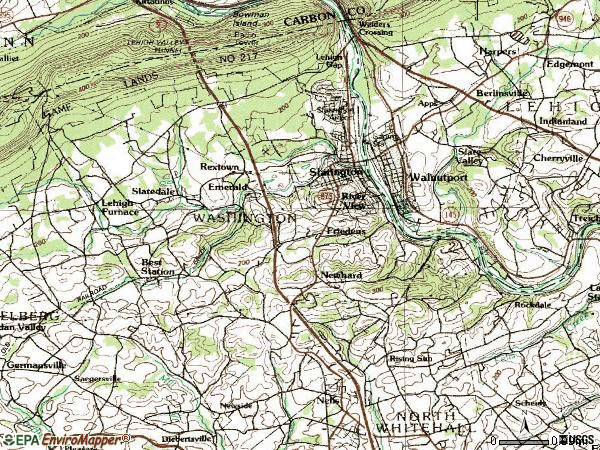
Notable locations in this zip code not listed on our city pages
Notable locations in zip code 18080: Slatington Fire Department Station 24 (A), Citizens Fire Company 1 Station 23 (B), Friedens Fire Company Station 9 (C), Star Hose Company 1 Station 6 (D). Display/hide their locations on the map
Cemeteries: Assumption Cemetery (1), Slatedale Cemetery (2), Fairview Cemetery (3), Union Cemetery (4), Old Union Cemetery (5). Display/hide their locations on the map
In group quarters: 16 (-1 institutionalized population)
Size of family households: 1,441 2-persons, 494 3-persons, 896 4-persons, 165 5-persons, 70 6-persons, 32 7-or-more-persons
Size of nonfamily households: 1,202 1-person, 247 2-persons, 12 3-persons
1,557 married couples with children.
713 single-parent households (310 men, 403 women).
94.8% of residents of 18080 zip code speak English at home.
3.4% of residents speak Spanish at home (43% very well, 38% well, 19% not well).
1.3% of residents speak other Indo-European language at home (64% very well, 36% well).
0.2% of residents speak Asian or Pacific Island language at home (56% very well, 44% not well).
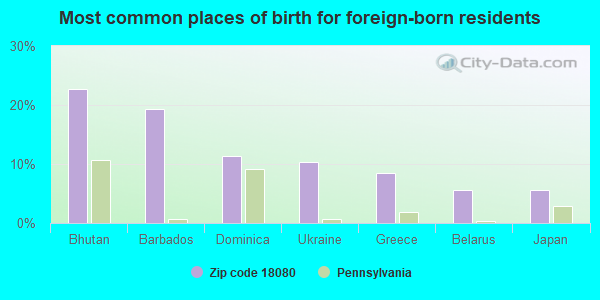
Foreign born population: 213 (1.9%) (64.8% of them are naturalized citizens)
This zip code:
1.9%
Whole state:
7.5%
23%Bhutan
19%Barbados
11%Dominica
10%Ukraine
8%Greece
6%Belarus
6%Japan
35%German
8%Pennsylvania German
7%Italian
7%Irish
7%American
2%Russian
2%Welsh
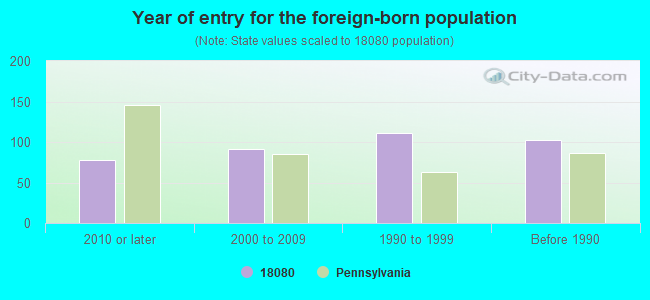
Year of entry for the foreign-born population
782010 or later
912000 to 2009
1111990 to 1999
102Before 1990
Facilities with environmental interests located in this zip code:
BUZZYS AUTO BODY (105 MAIN ST in SLATINGTON, PA)
Small Quantity Generators, between 100 kg and 1000 kg of hazardous waste/month (Resource Conservation and Recovery Act (tracking hazardous waste)) - notification Organizations: OPERNAME (CONTACT/OPERATOR)
, RABENOLD, KEN J (CONTACT/OWNER)
Housing units lacking complete plumbing facilities: 1.5% Housing units lacking complete kitchen facilities: 2.2%
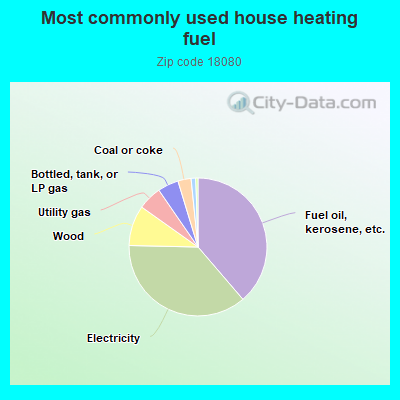
38.8%Fuel oil, kerosene, etc.
36.7%Electricity
9.5%Wood
5.6%Utility gas
4.9%Bottled, tank, or LP gas
3.1%Coal or coke
1.1%Other fuel
Population in 1990: 11,316. Population change in the 1990s: +293 (+2.6%).
Place of birth for U.S.-born residents:
This state: 9,326
Northeast: 985
Midwest: 115
South: 235
West: 116
70% of the 18080 zip code residents lived in the same house 5 years ago. Out of people who lived in different houses, 64% lived in this county. Out of people who lived in different counties, 50% lived in Pennsylvania.
94% of the 18080 zip code residents lived in the same house 1 year ago. Out of people who lived in different houses, 43% moved from this county. Out of people who lived in different houses, 29% moved from different county within same state. Out of people who lived in different houses, 31% moved from different state.
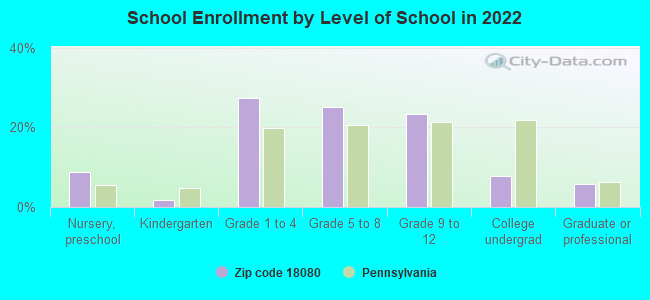
Private vs. public school enrollment:
Students in private schools in grades 1 to 8 (elementary and middle school): 49
Here:
3.9%
Pennsylvania:
15.7%
Students in private schools in grades 9 to 12 (high school): 18
Here:
3.3%
Pennsylvania:
13.4%
Students in private undergraduate colleges: 88
Here:
47.5%
Pennsylvania:
39.8%
Occupation by median earnings in the past 12 months ($)
101,439Law enforcement workers including supervisors
88,200Architecture and engineering occupations
86,144Life, physical, and social science occupations
82,078Business and financial operations occupations
73,067Management occupations
69,719Computer and mathematical occupations
Top industries in this zip code by the number of employees in 2005:
Other Services (except Public Administration): Automotive Body, Paint, and Interior Repair and Maintenance (20-49 employees: 1 establishment, 5-9 employees: 1 establishment, 1-4 employees: 2 establishments)
Other Services (except Public Administration): Religious Organizations (10-19: 1, 5-9: 1, 1-4: 8)
Health Care and Social Assistance: Homes for the Elderly (20-49: 1)
Construction: Structural Steel and Precast Concrete Contractors (20-49: 1)
Professional, Scientific, and Technical Services: Offices of Lawyers (20-49: 1)
Construction: Commercial and Institutional Building Construction (10-19: 2)
People in group quarters in 2000:
35 people in other nonhousehold living situations
12 people in other noninstitutional group quarters
3 people in homes for the mentally retarded
2 people in other group homes
Fatal accident statistics in 2014:
Fatal accident count: 6
Vehicles involved in fatal accidents: 8
Fatal accidents caused by drunken drivers: 0
Fatalities: 6
Persons involved in fatal accidents: 9
Pedestrians involved in fatal accidents: 3
Fatal accident statistics in 2013:
Fatal accident count: 3
Vehicles involved in fatal accidents: 3
Fatal accidents caused by drunken drivers: 1
Fatalities: 3
Persons involved in fatal accidents: 4
Pedestrians involved in fatal accidents: 1
Home Mortgage Disclosure Act Aggregated Statistics For Year 2009 (Based on 4 full and 2 partial tracts)
A) FHA, FSA/RHS & VA Home Purchase Loans
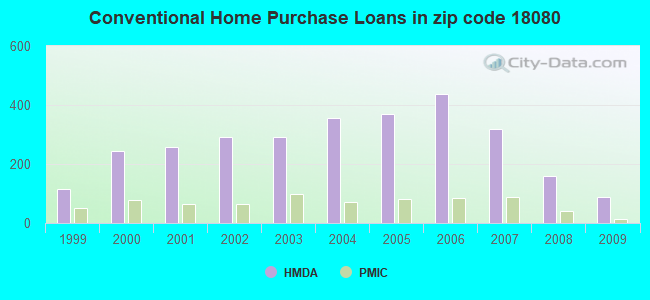
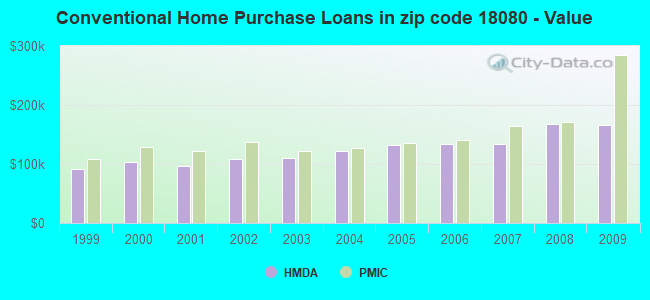
B) Conventional Home Purchase Loans
C) Refinancings
D) Home Improvement Loans
E) Loans on Dwellings For 5+ Families
F) Non-occupant Loans on < 5 Family Dwellings (A B C & D)
G) Loans On Manufactured Home Dwelling (A B C & D)
Number
Average Value
Number
Average Value
Number
Average Value
Number
Average Value
Number
Average Value
Number
Average Value
Number
Average Value
LOANS ORIGINATED
116
$160,551
88
$166,017
510
$156,307
97
$50,314
6
$335,408
24
$90,377
25
$55,846
APPLICATIONS APPROVED, NOT ACCEPTED
5
$116,608
5
$117,914
25
$156,949
10
$18,086
0
$0
2
$161,320
4
$33,570
APPLICATIONS DENIED
19
$152,696
21
$133,792
249
$921,374
16
$64,998
0
$0
4
$108,185
12
$78,394
APPLICATIONS WITHDRAWN
12
$136,221
14
$125,374
83
$172,095
6
$20,385
0
$0
6
$118,877
6
$64,215
FILES CLOSED FOR INCOMPLETENESS
4
$138,372
4
$67,475
14
$156,451
2
$84,070
0
$0
0
$0
4
$67,475
Aggregated Statistics For Year 2008 (Based on 4 full and 2 partial tracts)
A) FHA, FSA/RHS & VA Home Purchase Loans
B) Conventional Home Purchase Loans
C) Refinancings
D) Home Improvement Loans
E) Loans on Dwellings For 5+ Families
F) Non-occupant Loans on < 5 Family Dwellings (A B C & D)
G) Loans On Manufactured Home Dwelling (A B C & D)
Number
Average Value
Number
Average Value
Number
Average Value
Number
Average Value
Number
Average Value
Number
Average Value
Number
Average Value
LOANS ORIGINATED
87
$151,645
161
$166,969
446
$136,358
133
$50,023
4
$142,175
41
$122,483
31
$68,104
APPLICATIONS APPROVED, NOT ACCEPTED
4
$228,695
11
$122,397
64
$132,209
24
$39,195
0
$0
6
$144,062
5
$54,568
APPLICATIONS DENIED
18
$174,924
28
$132,620
304
$151,215
88
$55,576
2
$2,870
20
$105,466
22
$56,274
APPLICATIONS WITHDRAWN
8
$180,714
18
$160,845
110
$169,754
11
$67,968
0
$0
8
$82,921
0
$0
FILES CLOSED FOR INCOMPLETENESS
6
$148,493
2
$197,520
22
$201,123
2
$73,345
0
$0
0
$0
0
$0
Aggregated Statistics For Year 2007 (Based on 4 full and 2 partial tracts)
A) FHA, FSA/RHS & VA Home Purchase Loans
B) Conventional Home Purchase Loans
C) Refinancings
D) Home Improvement Loans
F) Non-occupant Loans on < 5 Family Dwellings (A B C & D)
G) Loans On Manufactured Home Dwelling (A B C & D)
Number
Average Value
Number
Average Value
Number
Average Value
Number
Average Value
Number
Average Value
Number
Average Value
LOANS ORIGINATED
54
$152,957
318
$134,736
569
$126,453
226
$42,499
42
$127,306
30
$27,805
APPLICATIONS APPROVED, NOT ACCEPTED
0
$0
39
$133,918
111
$139,359
23
$29,306
17
$134,989
6
$84,112
APPLICATIONS DENIED
2
$191,175
59
$109,431
378
$156,723
100
$47,957
20
$181,750
24
$73,704
APPLICATIONS WITHDRAWN
2
$85,210
29
$144,586
119
$163,228
27
$63,924
3
$175,800
4
$148,895
FILES CLOSED FOR INCOMPLETENESS
4
$212,542
9
$117,131
36
$204,898
7
$92,267
2
$137,865
2
$41,660
Aggregated Statistics For Year 2006 (Based on 4 full and 2 partial tracts)
A) FHA, FSA/RHS & VA Home Purchase Loans
B) Conventional Home Purchase Loans
C) Refinancings
D) Home Improvement Loans
E) Loans on Dwellings For 5+ Families
F) Non-occupant Loans on < 5 Family Dwellings (A B C & D)
G) Loans On Manufactured Home Dwelling (A B C & D)
Number
Average Value
Number
Average Value
Number
Average Value
Number
Average Value
Number
Average Value
Number
Average Value
Number
Average Value
LOANS ORIGINATED
27
$140,985
438
$134,561
619
$117,767
246
$45,598
2
$398,005
73
$122,094
38
$45,936
APPLICATIONS APPROVED, NOT ACCEPTED
2
$143,610
50
$122,506
115
$132,898
28
$37,466
0
$0
9
$68,347
9
$45,022
APPLICATIONS DENIED
0
$0
61
$125,481
372
$140,022
87
$51,127
0
$0
25
$118,038
20
$66,894
APPLICATIONS WITHDRAWN
2
$77,550
46
$188,641
204
$127,226
16
$36,331
0
$0
12
$144,530
2
$74,320
FILES CLOSED FOR INCOMPLETENESS
0
$0
14
$159,603
62
$134,337
2
$31,115
0
$0
2
$173,290
0
$0
Aggregated Statistics For Year 2005 (Based on 4 full and 2 partial tracts)
A) FHA, FSA/RHS & VA Home Purchase Loans
B) Conventional Home Purchase Loans
C) Refinancings
D) Home Improvement Loans
E) Loans on Dwellings For 5+ Families
F) Non-occupant Loans on < 5 Family Dwellings (A B C & D)
G) Loans On Manufactured Home Dwelling (A B C & D)
Number
Average Value
Number
Average Value
Number
Average Value
Number
Average Value
Number
Average Value
Number
Average Value
Number
Average Value
LOANS ORIGINATED
25
$137,476
371
$132,546
629
$117,573
217
$42,462
6
$171,852
59
$104,711
40
$59,010
APPLICATIONS APPROVED, NOT ACCEPTED
4
$116,305
28
$125,471
111
$105,375
34
$50,044
0
$0
8
$71,176
9
$75,148
APPLICATIONS DENIED
4
$158,420
57
$92,548
418
$119,255
94
$43,783
0
$0
33
$75,952
12
$46,416
APPLICATIONS WITHDRAWN
4
$190,190
22
$138,603
231
$124,939
31
$178,051
0
$0
12
$160,662
2
$136,905
FILES CLOSED FOR INCOMPLETENESS
0
$0
7
$122,920
79
$140,719
5
$33,070
0
$0
2
$178,555
2
$58,675
Aggregated Statistics For Year 2004 (Based on 4 full and 2 partial tracts)
A) FHA, FSA/RHS & VA Home Purchase Loans
B) Conventional Home Purchase Loans
C) Refinancings
D) Home Improvement Loans
E) Loans on Dwellings For 5+ Families
F) Non-occupant Loans on < 5 Family Dwellings (A B C & D)
G) Loans On Manufactured Home Dwelling (A B C & D)
Number
Average Value
Number
Average Value
Number
Average Value
Number
Average Value
Number
Average Value
Number
Average Value
Number
Average Value
LOANS ORIGINATED
29
$142,820
357
$121,250
637
$108,428
164
$40,817
4
$255,452
59
$86,239
34
$50,241
APPLICATIONS APPROVED, NOT ACCEPTED
0
$0
43
$105,621
161
$97,097
26
$38,537
0
$0
12
$55,748
3
$49,787
APPLICATIONS DENIED
6
$94,813
71
$100,741
387
$100,614
74
$36,616
0
$0
24
$86,220
36
$53,839
APPLICATIONS WITHDRAWN
8
$125,445
30
$144,326
286
$107,932
10
$36,528
1
$99,800
4
$210,248
4
$82,632
FILES CLOSED FOR INCOMPLETENESS
2
$67,020
8
$111,210
42
$115,170
4
$80,095
0
$0
2
$123,995
0
$0
Aggregated Statistics For Year 2003 (Based on 4 full and 2 partial tracts)
A) FHA, FSA/RHS & VA Home Purchase Loans
B) Conventional Home Purchase Loans
C) Refinancings
D) Home Improvement Loans
E) Loans on Dwellings For 5+ Families
F) Non-occupant Loans on < 5 Family Dwellings (A B C & D)
Number
Average Value
Number
Average Value
Number
Average Value
Number
Average Value
Number
Average Value
Number
Average Value
LOANS ORIGINATED
48
$97,443
293
$110,573
1,306
$101,864
187
$31,283
2
$172,330
56
$71,422
APPLICATIONS APPROVED, NOT ACCEPTED
0
$0
20
$91,352
198
$93,233
27
$45,205
0
$0
6
$78,267
APPLICATIONS DENIED
2
$98,770
46
$82,694
417
$101,523
55
$28,964
0
$0
12
$61,903
APPLICATIONS WITHDRAWN
4
$119,045
30
$115,765
327
$109,569
17
$42,816
0
$0
7
$65,231
FILES CLOSED FOR INCOMPLETENESS
2
$79,465
5
$114,172
24
$110,664
6
$39,130
0
$0
2
$55,530
Aggregated Statistics For Year 2002 (Based on 4 full and 2 partial tracts)
A) FHA, FSA/RHS & VA Home Purchase Loans
B) Conventional Home Purchase Loans
C) Refinancings
D) Home Improvement Loans
E) Loans on Dwellings For 5+ Families
F) Non-occupant Loans on < 5 Family Dwellings (A B C & D)
Number
Average Value
Number
Average Value
Number
Average Value
Number
Average Value
Number
Average Value
Number
Average Value
LOANS ORIGINATED
80
$97,090
290
$107,637
813
$94,014
157
$28,345
0
$0
41
$81,559
APPLICATIONS APPROVED, NOT ACCEPTED
2
$90,945
14
$72,727
166
$82,270
23
$37,913
0
$0
4
$119,615
APPLICATIONS DENIED
4
$65,820
54
$49,714
276
$91,808
43
$18,581
2
$220,030
12
$68,788
APPLICATIONS WITHDRAWN
4
$128,095
11
$165,016
192
$101,295
4
$9,035
0
$0
2
$14,360
FILES CLOSED FOR INCOMPLETENESS
0
$0
0
$0
42
$97,504
0
$0
0
$0
4
$78,028
Aggregated Statistics For Year 2001 (Based on 4 full and 2 partial tracts)
A) FHA, FSA/RHS & VA Home Purchase Loans
B) Conventional Home Purchase Loans
C) Refinancings
D) Home Improvement Loans
E) Loans on Dwellings For 5+ Families
F) Non-occupant Loans on < 5 Family Dwellings (A B C & D)
Number
Average Value
Number
Average Value
Number
Average Value
Number
Average Value
Number
Average Value
Number
Average Value
LOANS ORIGINATED
86
$88,105
259
$96,812
562
$91,592
175
$28,090
4
$132,120
13
$65,598
APPLICATIONS APPROVED, NOT ACCEPTED
3
$63,703
34
$50,196
106
$75,578
16
$16,914
0
$0
2
$58,940
APPLICATIONS DENIED
2
$49,905
93
$46,042
349
$73,145
89
$22,093
0
$0
13
$64,571
APPLICATIONS WITHDRAWN
6
$114,133
13
$110,580
155
$85,904
13
$23,891
0
$0
3
$41,607
FILES CLOSED FOR INCOMPLETENESS
0
$0
4
$65,582
31
$95,855
4
$38,285
0
$0
0
$0
Aggregated Statistics For Year 2000 (Based on 4 full and 2 partial tracts)
A) FHA, FSA/RHS & VA Home Purchase Loans
B) Conventional Home Purchase Loans
C) Refinancings
D) Home Improvement Loans
F) Non-occupant Loans on < 5 Family Dwellings (A B C & D)
Number
Average Value
Number
Average Value
Number
Average Value
Number
Average Value
Number
Average Value
LOANS ORIGINATED
57
$90,492
244
$104,216
272
$63,123
157
$23,026
17
$69,611
APPLICATIONS APPROVED, NOT ACCEPTED
5
$100,286
38
$56,402
70
$59,630
20
$22,587
1
$48,460
APPLICATIONS DENIED
2
$88,020
96
$42,100
265
$67,486
51
$20,729
13
$76,185
APPLICATIONS WITHDRAWN
10
$94,150
40
$75,358
78
$74,532
10
$28,435
0
$0
FILES CLOSED FOR INCOMPLETENESS
0
$0
3
$81,170
60
$89,614
2
$19,150
0
$0
Aggregated Statistics For Year 1999 (Based on 2 full and 1 partial tracts)
A) FHA, FSA/RHS & VA Home Purchase Loans
B) Conventional Home Purchase Loans
C) Refinancings
D) Home Improvement Loans
F) Non-occupant Loans on < 5 Family Dwellings (A B C & D)
2006 - 2018 National Fire Incident Reporting System (NFIRS) incidents
According to the data from the years 2006 - 2018 the average number of fires per year is 47. The highest number of reported fires - 157 took place in 2017, and the least - 0 in 2008. The data has a rising trend.
When looking into fire subcategories, the most incidents belonged to: Structure Fires (56.4%), and Outside Fires (18.3%).
Fire incident types reported to NFIRS in Zip Code 18080
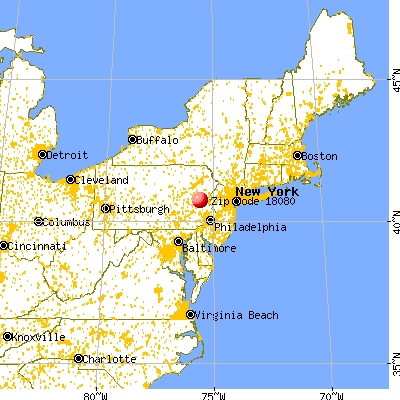


 Nearest zip codes: 18079, 18078, 18053, 18030, 18088, 18212.


 According to the data from the years 2006 - 2018 the average number of fires per year is 47. The highest number of reported fires - 157 took place in 2017, and the least - 0 in 2008. The data has a rising trend.
 When looking into fire subcategories, the most incidents belonged to: Structure Fires (56.4%), and Outside Fires (18.3%).