Estimated zip code population in 2022: 9,944 Zip code population in 2010: 9,020 Zip code population in 2000: 7,131
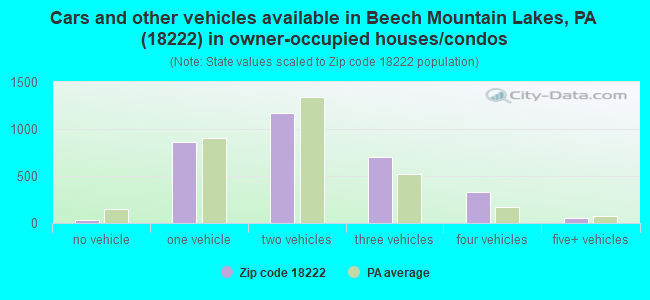
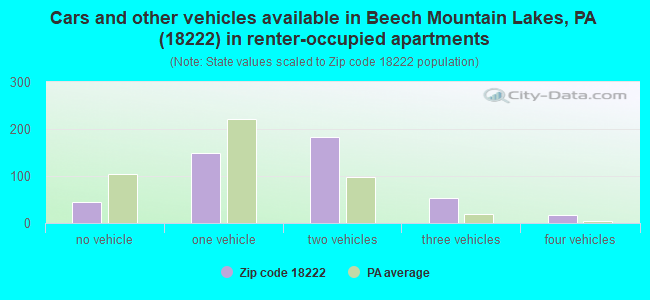
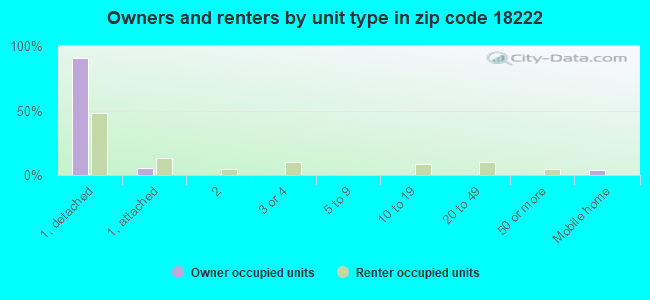
Houses and condos: 3,897 Renter-occupied apartments: 447
% of renters here:
12%
State:
31%
March 2022 cost of living index in zip code 18222: 95.0 (less than average, U.S. average is 100)
Land area: 37.5 sq. mi. Water area: 0.3 sq. mi.
Population density: 265 people per square mile
(very low).
OSM Map
General Map
Google Map
MSN Map
OSM Map
General Map
Google Map
MSN Map
OSM Map
General Map
Google Map
MSN Map
OSM Map
General Map
Google Map
MSN Map
Please wait while loading the map...
Real estate property taxes paid for housing units in 2022:
This zip code:
1.2% ($2,794)
Pennsylvania:
1.3% ($3,094)
Median real estate property taxes paid for housing units with mortgages in 2022: $3,196 (1.2%) Median real estate property taxes paid for housing units with no mortgage in 2022: $2,374 (1.3%)
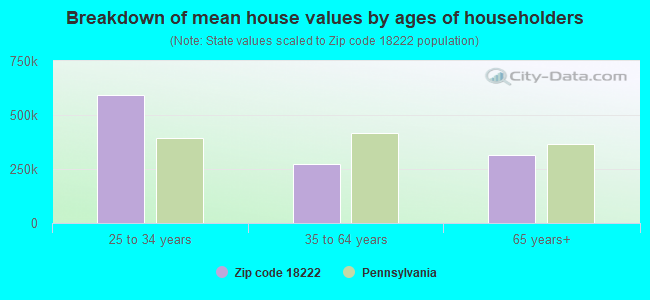
Estimated median house/condo value in 2022: $235,515
18222:
$235,515
Pennsylvania:
$245,500
According to our research of Pennsylvania and other state lists, there were 5 registered sex offenders living in 18222 zip code as of May 20, 2024. The ratio of all residents to sex offenders in zip code 18222 is 1,865 to 1. The ratio of registered sex offenders to all residents in this zip code is much lower than the state average.
Median resident age:
This zip code:
44.7 years
Pennsylvania median age:
40.9 years
Average household size:
This zip code:
2.6 people
Pennsylvania:
2.4 people
Averages for the 2020 tax year for zip code 18222, filed in 2021:
Average Adjusted Gross Income (AGI) in 2020: $70,573 (Individual Income Tax Returns)
Here:
$70,573
State:
$75,707
Salary/wage: $62,804 (reported on 79.1% of returns)
Here:
$62,804
State:
$62,806
(% of AGI for various income ranges: 974.7% for AGIs below $25k, 3278.6% for AGIs $25k-50k, 5940.0% for AGIs $50k-75k, 8781.4% for AGIs $75k-100k, 15210.1% for AGIs $100k-200k, 54124.3% for AGIs over 200k)
Taxable interest for individuals: $1,115 (reported on 32.2% of returns)
This zip code:
$1,115
Pennsylvania:
$1,633
(% of AGI for various income ranges: 30.3% for AGIs below $25k, 27.4% for AGIs $25k-50k, 34.3% for AGIs $50k-75k, 74.5% for AGIs $75k-100k, 68.1% for AGIs $100k-200k, 472.9% for AGIs over 200k)
Ordinary dividends: $3,494 (reported on 25.5% of returns)
Here:
$3,494
State:
$7,382
(% of AGI for various income ranges: 45.9% for AGIs below $25k, 56.7% for AGIs $25k-50k, 89.5% for AGIs $50k-75k, 143.2% for AGIs $75k-100k, 170.3% for AGIs $100k-200k, 1910.0% for AGIs over 200k)
Net capital gain/loss in AGI: +$9,174 (reported on 19.9% of returns)
Here:
+$9,174
State:
+$23,522
(% of AGI for various income ranges: 14.9% for AGIs below $25k, 35.9% for AGIs $25k-50k, 96.3% for AGIs $50k-75k, 154.5% for AGIs $75k-100k, 316.6% for AGIs $100k-200k, 7782.9% for AGIs over 200k)
Profit/loss from business: +$13,990 (reported on 12.1% of returns)
Here:
+$13,990
State:
+$16,274
(% of AGI for various income ranges: 74.7% for AGIs below $25k, 110.7% for AGIs $25k-50k, 74.2% for AGIs $50k-75k, 266.1% for AGIs $75k-100k, 355.1% for AGIs $100k-200k, 4258.6% for AGIs over 200k)
Taxable individual retirement arrangement distribution: $17,065 (reported on 13.5% of returns)
18222:
$17,065
Pennsylvania:
$18,583
(% of AGI for various income ranges: 125.5% for AGIs below $25k, 183.9% for AGIs $25k-50k, 257.3% for AGIs $50k-75k, 380.9% for AGIs $75k-100k, 561.1% for AGIs $100k-200k, 2817.1% for AGIs over 200k)
Total itemized deductions: $28,659 (reported on 6.2% of returns)
Here:
$28,659
State:
$34,850
(% of AGI for various income ranges: 91.0% for AGIs below $25k, 92.6% for AGIs $25k-50k, 179.8% for AGIs $50k-75k, 313.2% for AGIs $75k-100k, 421.7% for AGIs $100k-200k, 3118.6% for AGIs over 200k)
Charity contributions: $5,662 (reported on 4.7% of returns)
Here:
$5,662
State:
$12,392
(% of AGI for various income ranges: 10.0% for AGIs $25k-50k, 25.2% for AGIs $50k-75k, 34.3% for AGIs $75k-100k, 72.6% for AGIs $100k-200k, 662.9% for AGIs over 200k)
Taxes paid: $7,328 (reported on 6.2% of returns)
18222:
$7,328
State:
$8,200
(% of AGI for various income ranges: 6.6% for AGIs below $25k, 16.9% for AGIs $25k-50k, 49.0% for AGIs $50k-75k, 110.0% for AGIs $75k-100k, 139.0% for AGIs $100k-200k, 561.4% for AGIs over 200k)
Earned income credit: $1,905 (reported on 8.2% of returns)
Here:
$1,905
State:
$2,100
(% of AGI for various income ranges: 48.7% for AGIs below $25k, 44.2% for AGIs $25k-50k)
Percentage of individuals using paid preparers for their 2020 taxes: 92.2%
Here:
92%
State:
92%
(% for various income ranges: 90.1% for AGIs below $25k, 94.5% for AGIs $25k-50k, 92.4% for AGIs $50k-75k, 92.1% for AGIs $75k-100k, 93.1% for AGIs $100k-200k, 90.0% for AGIs over 200k)
Averages for the 2012 tax year for zip code 18222, filed in 2013:
Average Adjusted Gross Income (AGI) in 2012: $59,422 (Individual Income Tax Returns)
Here:
$59,422
State:
$61,346
Salary/wage: $52,554 (reported on 83.3% of returns)
Here:
$52,554
State:
$51,902
(% of AGI for various income ranges: 63.2% for AGIs below $25k, 78.5% for AGIs $25k-50k, 78.1% for AGIs $50k-75k, 80.1% for AGIs $75k-100k, 79.7% for AGIs $100k-200k, 49.7% for AGIs over 200k)
Taxable interest for individuals: $828 (reported on 40.9% of returns)
This zip code:
$828
Pennsylvania:
$1,588
(% of AGI for various income ranges: 1.8% for AGIs below $25k, 0.6% for AGIs $25k-50k, 0.5% for AGIs $50k-75k, 0.6% for AGIs $75k-100k, 0.3% for AGIs $100k-200k, 0.5% for AGIs over 200k)
Ordinary dividends: $3,159 (reported on 28.9% of returns)
Here:
$3,159
State:
$5,827
(% of AGI for various income ranges: 2.7% for AGIs below $25k, 1.0% for AGIs $25k-50k, 1.3% for AGIs $50k-75k, 0.9% for AGIs $75k-100k, 1.1% for AGIs $100k-200k, 3.4% for AGIs over 200k)
Net capital gain/loss in AGI: +$4,306 (reported on 18.9% of returns)
Here:
+$4,306
State:
+$14,495
(% of AGI for various income ranges: 0.3% for AGIs $25k-50k, 0.3% for AGIs $50k-75k, 0.3% for AGIs $75k-100k, 1.3% for AGIs $100k-200k, 5.4% for AGIs over 200k)
Profit/loss from business: +$14,830 (reported on 11.8% of returns)
Here:
+$14,830
State:
+$16,268
(% of AGI for various income ranges: 6.5% for AGIs below $25k, 2.3% for AGIs $25k-50k, 1.4% for AGIs $50k-75k, 1.9% for AGIs $75k-100k, 2.1% for AGIs $100k-200k, 6.4% for AGIs over 200k)
Taxable individual retirement arrangement distribution: $11,861 (reported on 12.7% of returns)
18222:
$11,861
Pennsylvania:
$14,550
(% of AGI for various income ranges: 5.2% for AGIs below $25k, 2.8% for AGIs $25k-50k, 2.2% for AGIs $50k-75k, 2.3% for AGIs $75k-100k, 3.4% for AGIs $100k-200k)
Self-employment retirement plans: $19,650 (reported on 0.4% of returns)
18222:
$19,650
Pennsylvania:
$20,922
Total itemized deductions: $19,059 (19% of AGI, reported on 35.1% of returns)
Here:
$19,059
State:
$23,538
Here:
18.8% of AGI
State:
18.4% of AGI
(% of AGI for various income ranges: 10.4% for AGIs below $25k, 9.7% for AGIs $25k-50k, 11.7% for AGIs $50k-75k, 11.8% for AGIs $75k-100k, 12.7% for AGIs $100k-200k, 9.1% for AGIs over 200k)
Charity contributions: $2,200 (reported on 28.7% of returns)
Here:
$2,200
State:
$4,025
(% of AGI for various income ranges: 0.5% for AGIs below $25k, 0.6% for AGIs $25k-50k, 0.9% for AGIs $50k-75k, 1.2% for AGIs $75k-100k, 1.3% for AGIs $100k-200k, 1.0% for AGIs over 200k)
Taxes paid: $7,563 (reported on 35.1% of returns)
18222:
$7,563
State:
$9,982
(% of AGI for various income ranges: 2.1% for AGIs below $25k, 2.9% for AGIs $25k-50k, 3.9% for AGIs $50k-75k, 4.5% for AGIs $75k-100k, 5.6% for AGIs $100k-200k, 5.2% for AGIs over 200k)
Earned income credit: $1,700 (reported on 9.8% of returns)
Here:
$1,700
State:
$2,106
(% of AGI for various income ranges: 3.0% for AGIs below $25k, 0.7% for AGIs $25k-50k)
Percentage of individuals using paid preparers for their 2012 taxes: 59.1%
Here:
59%
State:
53%
(% for various income ranges: 55.3% for AGIs below $25k, 58.2% for AGIs $25k-50k, 59.7% for AGIs $50k-75k, 60.0% for AGIs $75k-100k, 64.5% for AGIs $100k-200k, 81.8% for AGIs over 200k)
Averages for the 2004 tax year for zip code 18222, filed in 2005:
Average Adjusted Gross Income (AGI) in 2004: $46,979 (Individual Income Tax Returns)
Here:
$46,979
State:
$48,049
Salary/wage: $43,918 (reported on 84.5% of returns)
Here:
$43,918
State:
$42,646
(% of AGI for various income ranges: 134.2% for AGIs below $10k, 69.1% for AGIs $10k-25k, 81.0% for AGIs $25k-50k, 84.3% for AGIs $50k-75k, 86.6% for AGIs $75k-100k, 68.4% for AGIs over 100k)
Taxable interest for individuals: $1,245 (reported on 53.8% of returns)
This zip code:
$1,245
Pennsylvania:
$1,657
(% of AGI for various income ranges: 9.3% for AGIs below $10k, 2.7% for AGIs $10k-25k, 1.5% for AGIs $25k-50k, 1.0% for AGIs $50k-75k, 0.8% for AGIs $75k-100k, 1.6% for AGIs over 100k)
Taxable dividends: $2,102 (reported on 33.7% of returns)
Here:
$2,102
State:
$3,566
(% of AGI for various income ranges: 9.3% for AGIs below $10k, 2.3% for AGIs $10k-25k, 1.0% for AGIs $25k-50k, 0.9% for AGIs $50k-75k, 0.8% for AGIs $75k-100k, 2.3% for AGIs over 100k)
Net capital gain/loss: +$4,671 (reported on 21.8% of returns)
Here:
+$4,671
State:
+$9,716
(% of AGI for various income ranges: -3.3% for AGIs below $10k, -0.0% for AGIs $10k-25k, 0.7% for AGIs $25k-50k, 0.2% for AGIs $50k-75k, 1.4% for AGIs $75k-100k, 6.1% for AGIs over 100k)
Profit/loss from business: +$17,107 (reported on 14.2% of returns)
Here:
+$17,107
State:
+$14,267
(% of AGI for various income ranges: 9.8% for AGIs below $10k, 7.5% for AGIs $10k-25k, 2.8% for AGIs $25k-50k, 3.6% for AGIs $50k-75k, 3.2% for AGIs $75k-100k, 8.6% for AGIs over 100k)
IRA payment deduction: $3,148 (reported on 4.7% of returns)
18222:
$3,148
Pennsylvania:
$2,903
(% of AGI for various income ranges: 1.3% for AGIs below $10k, 0.5% for AGIs $10k-25k, 0.5% for AGIs $25k-50k, 0.4% for AGIs $50k-75k, 0.2% for AGIs $75k-100k, 0.2% for AGIs over 100k)
Self-employed pension: $14,458 (reported on 0.6% of returns)
Here:
$14,458
Pennsylvania:
$14,674
Total itemized deductions: $15,709 (20% of AGI, reported on 37.2% of returns)
Here:
$15,709
State:
$18,804
Here:
20.0% of AGI
State:
19.5% of AGI
(% of AGI for various income ranges: 20.4% for AGIs below $10k, 10.2% for AGIs $10k-25k, 10.6% for AGIs $25k-50k, 12.7% for AGIs $50k-75k, 14.0% for AGIs $75k-100k, 12.7% for AGIs over 100k)
Charity contributions deductions: $1,953 (2% of AGI, reported on 33.3% of returns)
Here:
$1,953
State:
$3,337
Here:
2.4% of AGI
State:
3.3% of AGI
(% of AGI for various income ranges: 0.6% for AGIs below $10k, 0.7% for AGIs $10k-25k, 0.8% for AGIs $25k-50k, 1.2% for AGIs $50k-75k, 1.6% for AGIs $75k-100k, 1.9% for AGIs over 100k)
Total tax: $6,646 (reported on 80.0% of returns)
18222:
$6,646
State:
$8,008
(% of AGI for various income ranges: 4.2% for AGIs below $10k, 4.9% for AGIs $10k-25k, 7.6% for AGIs $25k-50k, 9.0% for AGIs $50k-75k, 10.6% for AGIs $75k-100k, 18.0% for AGIs over 100k)
Earned income credit: $1,497 (reported on 8.5% of returns)
Here:
$1,497
State:
$1,643
Percentage of individuals using paid preparers for their 2004 taxes: 61.7%
Here:
62%
State:
56%
(% for various income ranges: 58.9% for AGIs below $10k, 60.9% for AGIs $10k-25k, 60.9% for AGIs $25k-50k, 63.6% for AGIs $50k-75k, 61.9% for AGIs $75k-100k, 67.3% for AGIs over 100k)
Household received Food Stamps/SNAP in the past 12 months: 296 Household did not receive Food Stamps/SNAP in the past 12 months: 3,307
Women who had a birth in the past 12 months: 109 (91 now married, 20 unmarried) Women who did not have a birth in the past 12 months: 1,866 (625 now married, 1,244 unmarried)
Housing units in zip code 18222 with a mortgage: 1,892 (296 second mortgage, 10 home equity loan, 230 both second mortgage and home equity loan) Houses without a mortgage: 144
Median monthly owner costs for units with a mortgage: $1,558 Median monthly owner costs for units without a mortgage: $553
Residents with income below the poverty level in 2022:
This zip code:
9.8%
Whole state:
11.8%
Residents with income below 50% of the poverty level in 2022:
This zip code:
3.8%
Whole state:
6.1%
Median number of rooms in houses and condos:
Here:
6.8
State:
6.8
Median number of rooms in apartments:
Here:
5.5
State:
4.3
Notable locations in this zip code not listed on our city pages
Notable locations in zip code 18222: Edgewood Pines Golf Course (A), Prospect Rock (B), Valley Regional Fire and Rescue (C), Keystone Job Corp Center (D). Display/hide their locations on the map
In group quarters: 442 (-1 institutionalized population)
Size of family households: 833 2-persons, 790 3-persons, 351 4-persons, 260 5-persons, 49 6-persons, 87 7-or-more-persons
Size of nonfamily households: 1,041 1-person, 179 2-persons, 10 5-persons
1,428 married couples with children.
221 single-parent households (29 men, 192 women).
91.6% of residents of 18222 zip code speak English at home.
4.0% of residents speak Spanish at home (76% very well, 6% well, 18% not well).
2.0% of residents speak other Indo-European language at home (81% very well, 19% well).
1.8% of residents speak Asian or Pacific Island language at home (98% very well, 2% well).
0.5% of residents speak other language at home (100% very well).
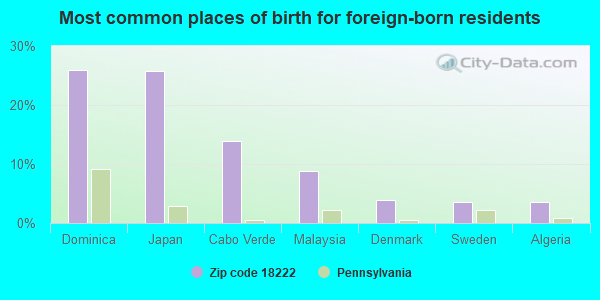
Foreign born population: 517 (5.2%) (83.3% of them are naturalized citizens)
This zip code:
5.2%
Whole state:
7.5%
26%Dominica
26%Japan
14%Cabo Verde
9%Malaysia
4%Denmark
4%Sweden
4%Algeria
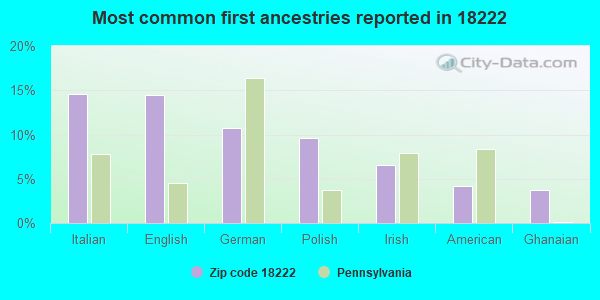
15%Italian
14%English
11%German
10%Polish
7%Irish
4%American
4%Ghanaian
Year of entry for the foreign-born population
1932010 or later
972000 to 2009
751990 to 1999
209Before 1990
Public elementary/middle school in in zip code 18222 not listed on the city page:
DRUMS EL/MS(Students: 765, Location: 85 SOUTH OLD TURNPIKE ROAD, Grades: KG-8)
Housing units lacking complete kitchen facilities: 1.4%
39.3%Electricity
28.0%Fuel oil, kerosene, etc.
18.8%Utility gas
7.0%Bottled, tank, or LP gas
3.4%Coal or coke
3.4%Wood
Population in 1990: 6,008. Population change in the 1990s: +1,123 (+18.7%).
Place of birth for U.S.-born residents:
This state: 6,908
Northeast: 1,336
Midwest: 383
South: 661
West: 68
66% of the 18222 zip code residents lived in the same house 5 years ago. Out of people who lived in different houses, 55% lived in this county. Out of people who lived in different counties, 50% lived in Pennsylvania.
92% of the 18222 zip code residents lived in the same house 1 year ago. Out of people who lived in different houses, 36% moved from this county. Out of people who lived in different houses, 46% moved from different county within same state. Out of people who lived in different houses, 13% moved from different state. Out of people who lived in different houses, 5% moved from abroad.
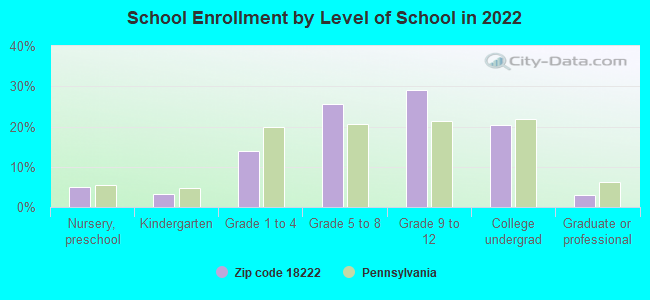
Private vs. public school enrollment:
Students in private schools in grades 1 to 8 (elementary and middle school): 102
Here:
10.1%
Pennsylvania:
15.7%
Students in private schools in grades 9 to 12 (high school): 138
Here:
18.5%
Pennsylvania:
13.4%
Students in private undergraduate colleges: 248
Here:
47.5%
Pennsylvania:
39.8%
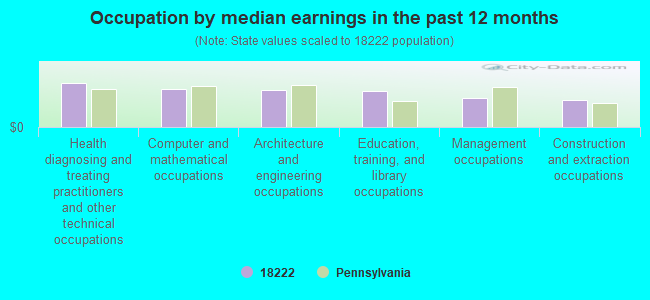
Occupation by median earnings in the past 12 months ($)
108,298Health diagnosing and treating practitioners and other technical occupations
94,663Computer and mathematical occupations
90,844Architecture and engineering occupations
88,073Education, training, and library occupations
71,022Management occupations
67,221Construction and extraction occupations
Top industries in this zip code by the number of employees in 2005:
Administrative and Support and Waste Management and Remediation Services: All Other Business Support Services (100-249 employees: 1 establishment)
Health Care and Social Assistance: Vocational Rehabilitation Services (100-249: 1)
Health Care and Social Assistance: Continuing Care Retirement Communities (50-99: 1, 1-4: 1)
Health Care and Social Assistance: Homes for the Elderly (50-99: 1)
Construction: New Single-Family Housing Construction (except Operative Builders) (20-49: 1, 5-9: 3, 1-4: 7)
Construction: Plumbing, Heating, and Air-Conditioning Contractors (20-49: 1, 1-4: 2)
Other Services (except Public Administration): Other Similar Organizations (except Business, Professional, Labor, and Political Organizations) (20-49: 1)
People in group quarters in 2010:
497 people in workers' group living quarters and job corps centers
176 people in nursing facilities/skilled-nursing facilities
3 people in group homes intended for adults
People in group quarters in 2000:
529 people in job corps and vocational training facilities
210 people in nursing homes
29 people in other noninstitutional group quarters
11 people in homes for the mentally retarded
Fatal accident statistics in 2014:
Fatal accident count: 4
Vehicles involved in fatal accidents: 7
Fatal accidents caused by drunken drivers: 1
Fatalities: 4
Persons involved in fatal accidents: 8
Pedestrians involved in fatal accidents: 0
Fatal accident statistics in 2013:
Fatal accident count: 3
Vehicles involved in fatal accidents: 3
Fatal accidents caused by drunken drivers: 1
Fatalities: 3
Persons involved in fatal accidents: 7
Pedestrians involved in fatal accidents: 0
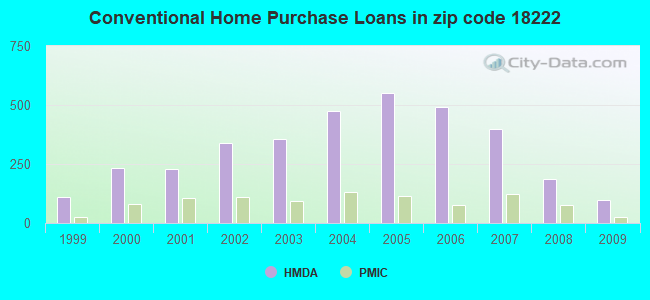
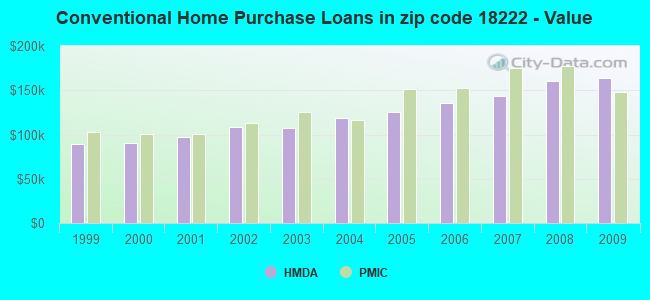
Home Mortgage Disclosure Act Aggregated Statistics For Year 2009 (Based on 4 partial tracts)
A) FHA, FSA/RHS & VA Home Purchase Loans
B) Conventional Home Purchase Loans
C) Refinancings
D) Home Improvement Loans
F) Non-occupant Loans on < 5 Family Dwellings (A B C & D)
G) Loans On Manufactured Home Dwelling (A B C & D)
Number
Average Value
Number
Average Value
Number
Average Value
Number
Average Value
Number
Average Value
Number
Average Value
LOANS ORIGINATED
115
$162,226
98
$163,397
503
$139,993
57
$51,752
24
$129,765
8
$84,100
APPLICATIONS APPROVED, NOT ACCEPTED
9
$168,567
7
$145,553
54
$154,524
2
$47,115
0
$0
2
$60,305
APPLICATIONS DENIED
23
$128,317
19
$152,581
210
$162,443
23
$56,955
9
$115,170
2
$18,845
APPLICATIONS WITHDRAWN
15
$161,071
14
$196,113
116
$169,280
9
$94,230
4
$124,855
0
$0
FILES CLOSED FOR INCOMPLETENESS
2
$156,245
2
$135,690
29
$156,549
4
$101,298
4
$84,335
0
$0
Aggregated Statistics For Year 2008 (Based on 4 partial tracts)
A) FHA, FSA/RHS & VA Home Purchase Loans
B) Conventional Home Purchase Loans
C) Refinancings
D) Home Improvement Loans
E) Loans on Dwellings For 5+ Families
F) Non-occupant Loans on < 5 Family Dwellings (A B C & D)
G) Loans On Manufactured Home Dwelling (A B C & D)
Number
Average Value
Number
Average Value
Number
Average Value
Number
Average Value
Number
Average Value
Number
Average Value
Number
Average Value
LOANS ORIGINATED
39
$165,038
188
$160,829
319
$133,446
98
$54,402
0
$0
39
$130,307
4
$28,740
APPLICATIONS APPROVED, NOT ACCEPTED
2
$206,485
20
$186,867
61
$137,680
30
$43,509
0
$0
8
$109,919
0
$0
APPLICATIONS DENIED
5
$91,658
36
$152,394
277
$163,485
41
$61,251
4
$157,835
10
$106,148
0
$0
APPLICATIONS WITHDRAWN
5
$145,670
10
$151,236
103
$157,079
8
$50,924
0
$0
14
$91,632
0
$0
FILES CLOSED FOR INCOMPLETENESS
4
$118,185
4
$210,132
18
$171,547
4
$118,842
0
$0
0
$0
0
$0
Aggregated Statistics For Year 2007 (Based on 4 partial tracts)
A) FHA, FSA/RHS & VA Home Purchase Loans
B) Conventional Home Purchase Loans
C) Refinancings
D) Home Improvement Loans
F) Non-occupant Loans on < 5 Family Dwellings (A B C & D)
G) Loans On Manufactured Home Dwelling (A B C & D)
Number
Average Value
Number
Average Value
Number
Average Value
Number
Average Value
Number
Average Value
Number
Average Value
LOANS ORIGINATED
24
$172,942
399
$143,438
355
$115,774
172
$48,875
47
$126,824
7
$55,004
APPLICATIONS APPROVED, NOT ACCEPTED
4
$139,932
33
$133,144
81
$130,875
20
$28,411
6
$166,967
6
$24,813
APPLICATIONS DENIED
2
$128,155
53
$120,354
309
$151,752
98
$62,951
17
$124,631
9
$47,533
APPLICATIONS WITHDRAWN
0
$0
17
$169,932
127
$150,599
17
$131,992
4
$97,528
0
$0
FILES CLOSED FOR INCOMPLETENESS
0
$0
16
$185,679
32
$199,128
2
$70,675
2
$112,285
2
$55,595
Aggregated Statistics For Year 2006 (Based on 4 partial tracts)
A) FHA, FSA/RHS & VA Home Purchase Loans
B) Conventional Home Purchase Loans
C) Refinancings
D) Home Improvement Loans
E) Loans on Dwellings For 5+ Families
F) Non-occupant Loans on < 5 Family Dwellings (A B C & D)
G) Loans On Manufactured Home Dwelling (A B C & D)
Number
Average Value
Number
Average Value
Number
Average Value
Number
Average Value
Number
Average Value
Number
Average Value
Number
Average Value
LOANS ORIGINATED
24
$155,322
493
$135,522
418
$104,302
169
$44,271
2
$113,075
57
$115,160
8
$67,610
APPLICATIONS APPROVED, NOT ACCEPTED
0
$0
57
$125,251
58
$101,939
19
$37,616
0
$0
12
$73,060
2
$168,110
APPLICATIONS DENIED
8
$111,428
59
$125,132
339
$138,630
88
$62,536
2
$152,655
16
$108,959
10
$38,164
APPLICATIONS WITHDRAWN
4
$113,075
36
$135,408
212
$126,641
22
$84,162
0
$0
17
$95,228
2
$114,960
FILES CLOSED FOR INCOMPLETENESS
0
$0
14
$121,834
40
$151,058
2
$215,785
0
$0
4
$88,575
0
$0
Aggregated Statistics For Year 2005 (Based on 4 partial tracts)
A) FHA, FSA/RHS & VA Home Purchase Loans
B) Conventional Home Purchase Loans
C) Refinancings
D) Home Improvement Loans
F) Non-occupant Loans on < 5 Family Dwellings (A B C & D)
G) Loans On Manufactured Home Dwelling (A B C & D)
Number
Average Value
Number
Average Value
Number
Average Value
Number
Average Value
Number
Average Value
Number
Average Value
LOANS ORIGINATED
31
$147,130
552
$124,975
398
$103,776
134
$38,699
55
$101,253
2
$13,190
APPLICATIONS APPROVED, NOT ACCEPTED
0
$0
35
$127,424
76
$104,900
15
$31,373
5
$147,996
2
$66,905
APPLICATIONS DENIED
0
$0
88
$109,519
323
$129,036
82
$49,932
25
$65,622
7
$79,184
APPLICATIONS WITHDRAWN
6
$159,168
47
$134,831
259
$135,996
35
$98,004
6
$128,782
2
$75,385
FILES CLOSED FOR INCOMPLETENESS
0
$0
10
$88,982
51
$143,363
2
$51,825
4
$66,032
0
$0
Aggregated Statistics For Year 2004 (Based on 4 partial tracts)
A) FHA, FSA/RHS & VA Home Purchase Loans
B) Conventional Home Purchase Loans
C) Refinancings
D) Home Improvement Loans
E) Loans on Dwellings For 5+ Families
F) Non-occupant Loans on < 5 Family Dwellings (A B C & D)
G) Loans On Manufactured Home Dwelling (A B C & D)
Number
Average Value
Number
Average Value
Number
Average Value
Number
Average Value
Number
Average Value
Number
Average Value
Number
Average Value
LOANS ORIGINATED
34
$130,425
475
$118,139
451
$99,196
103
$40,828
2
$108,365
58
$98,537
14
$56,795
APPLICATIONS APPROVED, NOT ACCEPTED
2
$136,635
45
$113,346
95
$104,468
24
$37,200
0
$0
8
$80,331
6
$35,465
APPLICATIONS DENIED
8
$138,441
71
$105,208
324
$114,870
51
$42,376
0
$0
23
$74,734
14
$42,740
APPLICATIONS WITHDRAWN
2
$149,825
35
$111,940
227
$108,922
14
$67,289
0
$0
4
$89,990
2
$84,805
FILES CLOSED FOR INCOMPLETENESS
2
$192,230
3
$96,270
60
$136,736
7
$29,624
0
$0
2
$97,120
0
$0
Aggregated Statistics For Year 2003 (Based on 4 partial tracts)
A) FHA, FSA/RHS & VA Home Purchase Loans
B) Conventional Home Purchase Loans
C) Refinancings
D) Home Improvement Loans
E) Loans on Dwellings For 5+ Families
F) Non-occupant Loans on < 5 Family Dwellings (A B C & D)
Number
Average Value
Number
Average Value
Number
Average Value
Number
Average Value
Number
Average Value
Number
Average Value
LOANS ORIGINATED
28
$122,230
358
$107,017
858
$98,296
79
$43,533
0
$0
41
$92,274
APPLICATIONS APPROVED, NOT ACCEPTED
2
$94,230
30
$109,646
139
$95,920
22
$52,167
0
$0
2
$182,330
APPLICATIONS DENIED
2
$101,770
47
$105,677
327
$100,247
43
$31,960
2
$82,920
10
$58,810
APPLICATIONS WITHDRAWN
2
$108,365
30
$112,831
229
$125,688
8
$32,146
0
$0
6
$173,285
FILES CLOSED FOR INCOMPLETENESS
0
$0
8
$112,840
24
$129,411
6
$32,980
0
$0
0
$0
Aggregated Statistics For Year 2002 (Based on 4 partial tracts)
A) FHA, FSA/RHS & VA Home Purchase Loans
B) Conventional Home Purchase Loans
C) Refinancings
D) Home Improvement Loans
F) Non-occupant Loans on < 5 Family Dwellings (A B C & D)
Number
Average Value
Number
Average Value
Number
Average Value
Number
Average Value
Number
Average Value
LOANS ORIGINATED
13
$102,203
341
$108,388
498
$89,441
73
$32,905
18
$80,159
APPLICATIONS APPROVED, NOT ACCEPTED
0
$0
26
$79,320
88
$98,348
15
$22,409
2
$33,925
APPLICATIONS DENIED
0
$0
34
$86,357
201
$89,683
36
$39,562
8
$32,980
APPLICATIONS WITHDRAWN
2
$124,385
32
$82,746
142
$96,591
8
$36,090
6
$54,340
FILES CLOSED FOR INCOMPLETENESS
0
$0
4
$92,818
24
$97,699
0
$0
6
$97,437
Aggregated Statistics For Year 2001 (Based on 4 partial tracts)
A) FHA, FSA/RHS & VA Home Purchase Loans
B) Conventional Home Purchase Loans
C) Refinancings
D) Home Improvement Loans
F) Non-occupant Loans on < 5 Family Dwellings (A B C & D)
Number
Average Value
Number
Average Value
Number
Average Value
Number
Average Value
Number
Average Value
LOANS ORIGINATED
17
$88,937
229
$97,519
363
$81,447
86
$31,550
20
$116,944
APPLICATIONS APPROVED, NOT ACCEPTED
0
$0
30
$88,122
76
$75,762
11
$32,041
2
$51,825
APPLICATIONS DENIED
0
$0
52
$77,405
189
$67,788
34
$23,595
3
$119,373
APPLICATIONS WITHDRAWN
2
$168,670
12
$113,902
121
$87,779
10
$49,878
2
$80,095
FILES CLOSED FOR INCOMPLETENESS
0
$0
6
$93,288
15
$89,521
0
$0
0
$0
Aggregated Statistics For Year 2000 (Based on 4 partial tracts)
A) FHA, FSA/RHS & VA Home Purchase Loans
B) Conventional Home Purchase Loans
C) Refinancings
D) Home Improvement Loans
E) Loans on Dwellings For 5+ Families
F) Non-occupant Loans on < 5 Family Dwellings (A B C & D)
Number
Average Value
Number
Average Value
Number
Average Value
Number
Average Value
Number
Average Value
Number
Average Value
LOANS ORIGINATED
18
$85,432
232
$90,681
183
$56,513
83
$30,315
2
$164,905
25
$61,769
APPLICATIONS APPROVED, NOT ACCEPTED
1
$52,960
15
$95,987
62
$53,496
19
$45,928
0
$0
0
$0
APPLICATIONS DENIED
1
$24,320
30
$61,895
130
$64,127
19
$19,488
0
$0
0
$0
APPLICATIONS WITHDRAWN
4
$89,048
16
$89,812
105
$81,112
8
$20,700
0
$0
2
$126,020
FILES CLOSED FOR INCOMPLETENESS
0
$0
7
$137,621
10
$104,872
2
$34,865
0
$0
0
$0
Aggregated Statistics For Year 1999 (Based on 2 partial tracts)
A) FHA, FSA/RHS & VA Home Purchase Loans
B) Conventional Home Purchase Loans
C) Refinancings
D) Home Improvement Loans
F) Non-occupant Loans on < 5 Family Dwellings (A B C & D)
Detailed PMIC statistics for the following Tracts:2165.02
, 2166.00
2005 - 2018 National Fire Incident Reporting System (NFIRS) incidents
Based on the data from the years 2005 - 2018 the average number of fire incidents per year is 22. The highest number of fires - 52 took place in 2005, and the least - 0 in 2007. The data has a decreasing trend.
When looking into fire subcategories, the most reports belonged to: Structure Fires (56.6%), and Outside Fires (20.9%).
Fire incident types reported to NFIRS in Zip Code 18222


 Nearest zip codes: 18239, 18234, 18225, 18219, 18223, 18251.


 (Students: 765, Location: 85 SOUTH OLD TURNPIKE ROAD, Grades: KG-8)


 Based on the data from the years 2005 - 2018 the average number of fire incidents per year is 22. The highest number of fires - 52 took place in 2005, and the least - 0 in 2007. The data has a decreasing trend.
 When looking into fire subcategories, the most reports belonged to: Structure Fires (56.6%), and Outside Fires (20.9%).