Estimated zip code population in 2022: 100
Zip code population in 2010: 232
Zip code population in 2000: 112
March 2022 cost of living index in zip code 18239: 92.7
(less than average, U.S. average is 100)
Land area: 0.3
sq. mi.
Water area: 0.0
sq. mi.
| Population density: 371 people per square mile | | (very low). |
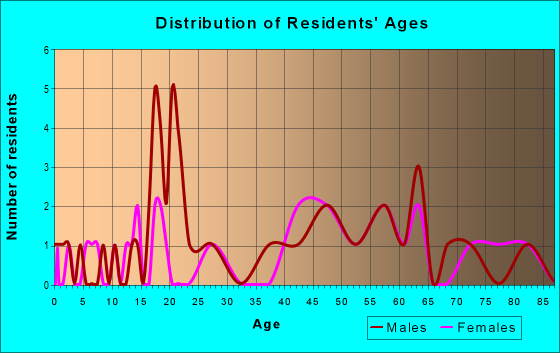
![Age and Sex of Residents in zip code 18239]()
- OSM Map
- General Map
- Google Map
- MSN Map
- OSM Map
- General Map
- Google Map
- MSN Map
- OSM Map
- General Map
- Google Map
- MSN Map
- OSM Map
- General Map
- Google Map
- MSN Map
Please wait while loading the map...
Real estate property taxes paid for housing units in 2022:
| This zip code: | 1.4% ($3,774) |
| Pennsylvania: | 1.3% ($3,094) |
Business Search - 14 Million verified businesses
| Males: 0 |  (0.0%) (0.0%) |
| Females: 100 |  (100.0%) (100.0%) |
For population 25 years and over in 18239:
- High school or higher: 99.9%
- Bachelor's degree or higher: 51.9%
- Graduate or professional degree: 0.0%
For population 15 years and over in 18239:
- Never married: 0.0%
- Now married: 0.0%
- Separated: 0.0%
- Widowed: 100.0%
- Divorced: 0.0%
Zip code 18239 compared to state average:
- Median household income significantly below state average.
- Median house value significantly below state average.
- Black race population percentage significantly below state average.
- Hispanic race population percentage significantly below state average.
- Median age significantly below state average.
- Foreign-born population percentage significantly below state average.
- Renting percentage significantly below state average.
- Length of stay since moving in significantly above state average.
- Number of rooms per house significantly below state average.
- House age below state average.
- Number of college students significantly below state average.
- Percentage of population with a bachelor's degree or higher above state average.
Data:
100%
urban population.
Average household size:| This zip code: | 1.9 people |
| Pennsylvania: | 2.4 people |
Averages for the 2004 tax year for zip code 18239, filed in 2005:
Average Adjusted Gross Income (AGI) in 2004: $28,706 (Individual Income Tax Returns)
| Here: | $28,706 |
| State: | $48,049 |
Salary/wage: $26,977 (reported on 86.9% of returns)
| Here: | $26,977 |
| State: | $42,646 |
(% of AGI for various income ranges: 114.7% for AGIs below $10k, 87.7% for AGIs $10k-25k, 89.5% for AGIs $25k-50k, 70.1% for AGIs $50k-75k)
Taxable interest for individuals: $250 (reported on 34.0% of returns)
| This zip code: | $250 |
| Pennsylvania: | $1,657 |
Taxable dividends: $300 (reported on 19.6% of returns)
Profit/loss from business: +$3,312 (reported on 10.5% of returns)
| Here: | +$3,312 |
| State: | +$14,267 |
Total itemized deductions: $11,474 (16% of AGI, reported on 12.4% of returns)
| Here: | $11,474 |
| State: | $18,804 |
| Here: | 16.2% of AGI |
| State: | 19.5% of AGI |
Charity contributions deductions: $1,733 (2% of AGI, reported on 9.8% of returns)
| Here: | 2.3% of AGI |
| State: | 3.3% of AGI |
Total tax: $3,215 (reported on 69.9% of returns)
(% of AGI for various income ranges: 1.2% for AGIs below $10k, 4.3% for AGIs $10k-25k, 7.2% for AGIs $25k-50k, 10.3% for AGIs $50k-75k)
Earned income credit: $1,400 (reported on 16.3% of returns)
Percentage of individuals using paid preparers for their 2004 taxes: 67.3%
(% for various income ranges: 57.1% for AGIs below $10k, 70.5% for AGIs $10k-25k, 64.3% for AGIs $25k-50k, 84.0% for AGIs $50k-75k)
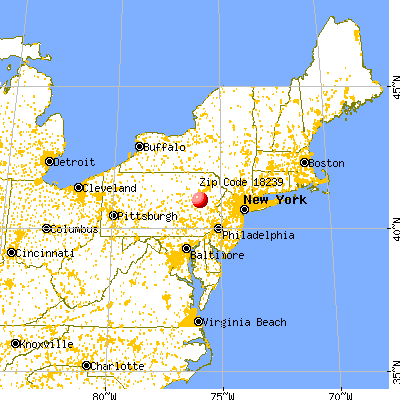
![Harleigh, PA (18239) map]() Nearest zip codes: 18225
Nearest zip codes: 18225,
18234,
18223,
18222,
18201,
18202.
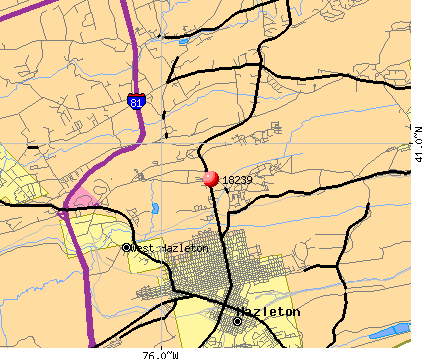
Harleigh Zip Code Map
Percentage of family households:| This zip code: | 0.0% |
| Pennsylvania: | 42.6% |
Percentage of households with unmarried partners:| This zip code: | 0.0% |
| Pennsylvania: | 46.5% |
No gay or lesbian households reported
Household received Food Stamps/SNAP in the past 12 months: 0
Household did not receive Food Stamps/SNAP in the past 12 months: 51
Women who did not have a birth in the past 12 months: 49 (0 now married, 50 unmarried)

- Year house built (houses)
- 02020 or later
- 02010 to 2019
- 02000 to 2009
- 01990 to 1999
- 511980 to 1989
- 01970 to 1979
- 01960 to 1969
- 01950 to 1959
- 01940 to 1949
- 01939 or earlier
![Zip code 18239 satellite photo by USGS]()
- Bedrooms in owner-occupied houses and condos in Harleigh, PA (18239)
- 0no bedroom
- 01 bedroom
- 522 bedrooms
- 03 bedrooms
- 04 bedrooms
- 05+ bedrooms
- Cars and other vehicles available in Harleigh, PA (18239) in owner-occupied houses/condos
- 0no vehicle
- 531 vehicle
- 02 vehicles
- 03 vehicles
- 04 vehicles
- 05+ vehicles
Estimate of home value of owner-occupied houses/condos in 2022 in zip code 18239
![Estimate of home value of owner-occupied houses/condos in 2022 in zip code 18239]()
- 42$40,000 to $49,999
Estimated median house (or condo) value in 2022 for:
- White Non-Hispanic householders: $270,536
Mean price in 2022:
Detached houses: $332,094| Here: | $332,094 |
| State: | $317,202 |
Townhouses or other attached units: $450,390| Here: | $450,390 |
| State: | $254,369 |
Housing units in structures:
Household type by relationship:
Households: 100
- Male householders: 0 (0 living alone), Female householders: 53 (0 living alone)
0 spouses (0 opposite-sex spouses), 0 unmarried partners, (0 opposite-sex unmarried partners), 48 children (48 natural, 0 adopted, 0 stepchildren), 0 grandchildren, 0 brothers or sisters, 0 parents, 0 foster children, 0 other relatives, 0 non-relatives
Size of family households: 52 2-persons
101.0% of residents of 18239 zip code speak English at home.
Foreign born population: 0 (0.0%)
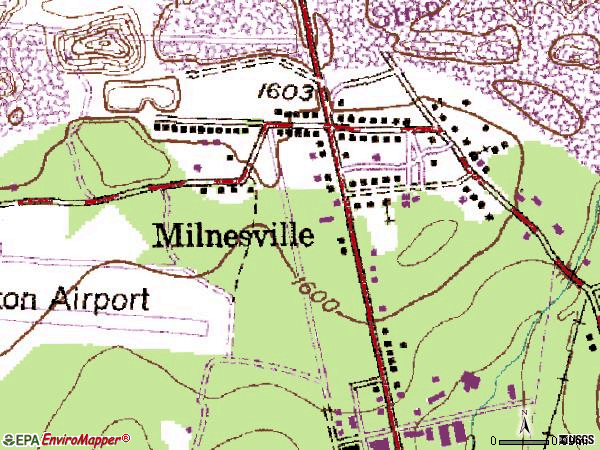
![Zip code 18239 topographic map]()
Place of birth for U.S.-born residents:
93% of the 18239 zip code residents lived in the same house 5 years ago.
Out of people who lived in different houses, 100% lived in this county.
100% of the 18239 zip code residents lived in the same house 1 year ago.
Top industries in this zip code by the number of employees in 2005:
- Construction: Framing Contractors (1-4 employees: 1 establishment)
- Administrative and Support and Waste Management and Remediation Services: Security Systems Services (except Locksmiths) (1-4: 1)
| Most common first names in zip code 18239 among deceased individuals |
| Name | Count | Lived (average) |
|---|
| Mary | 14 | 80.2 years |
| George | 9 | 74.7 years |
| Anna | 8 | 80.1 years |
| John | 8 | 73.6 years |
| Joseph | 7 | 75.3 years |
| Helen | 6 | 75.9 years |
| Elizabeth | 5 | 80.1 years |
| Robert | 4 | 60.8 years |
| James | 3 | 79.0 years |
| Eugene | 3 | 65.3 years |
| Most common last names in zip code 18239 among deceased individuals |
| Last name | Count | Lived (average) |
|---|
| Conlin | 5 | 72.4 years |
| Faust | 5 | 74.2 years |
| Benyo | 4 | 79.7 years |
| Puhak | 4 | 72.3 years |
| Reich | 4 | 86.3 years |
| Smith | 4 | 68.3 years |
| Sobeck | 4 | 73.7 years |
| Yanac | 4 | 72.5 years |
| Hreha | 2 | 74.5 years |
| Kasarda | 2 | 71.5 years |
 100% urban population.


 Nearest zip codes: 18225, 18234, 18223, 18222, 18201, 18202.