Estimated zip code population in 2022: 11,437 Zip code population in 2010: 12,779 Zip code population in 2000: 11,057
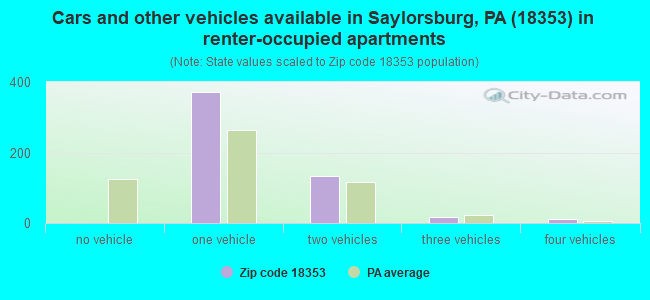
Houses and condos: 5,264 Renter-occupied apartments: 530
% of renters here:
12%
State:
31%
March 2022 cost of living index in zip code 18353: 94.0 (less than average, U.S. average is 100)
Land area: 47.2 sq. mi. Water area: 0.2 sq. mi.
Population density: 243 people per square mile
(very low).
OSM Map
General Map
Google Map
MSN Map
OSM Map
General Map
Google Map
MSN Map
OSM Map
General Map
Google Map
MSN Map
OSM Map
General Map
Google Map
MSN Map
Please wait while loading the map...
Real estate property taxes paid for housing units in 2022:
This zip code:
1.7% ($4,494)
Pennsylvania:
1.3% ($3,094)
Median real estate property taxes paid for housing units with mortgages in 2022: $4,548 (1.7%) Median real estate property taxes paid for housing units with no mortgage in 2022: $4,393 (1.7%)
Business Search- 14 Million verified businesses
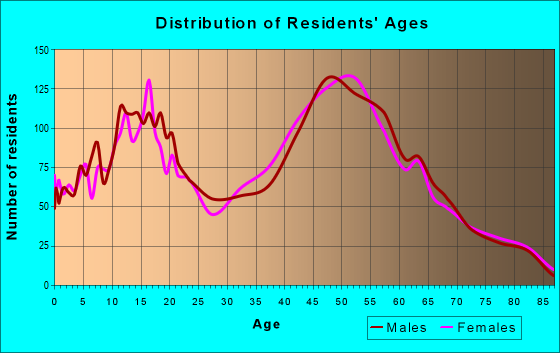
Males: 5,949
(52.0%)
Females: 5,487
(48.0%)
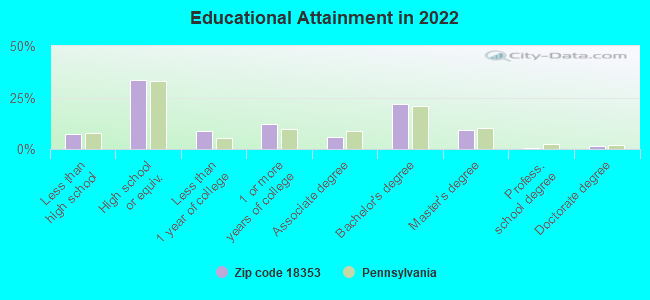
For population 25 years and over in 18353:
High school or higher: 92.8%
Bachelor's degree or higher: 32.7%
Graduate or professional degree: 10.8%
Unemployed: 3.3%
Mean travel time to work (commute): 36.8 minutes
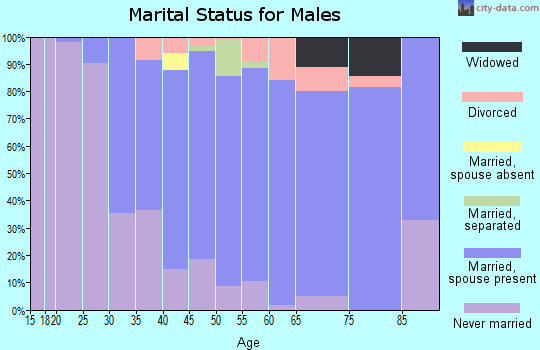
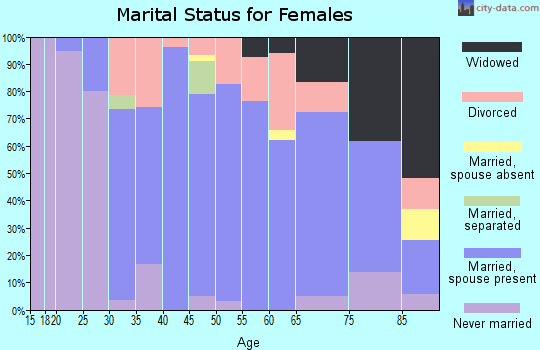
For population 15 years and over in 18353:
Never married: 23.1%
Now married: 57.5%
Separated: 2.7%
Widowed: 6.9%
Divorced: 9.8%
Zip code 18353 compared to state average:
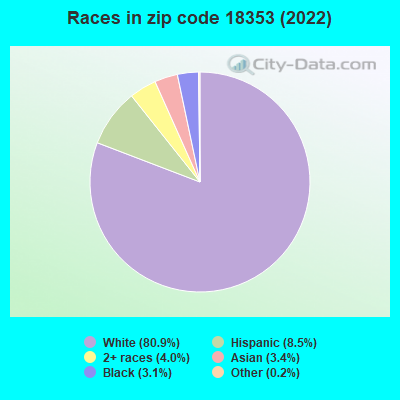
Black race population percentage significantly below state average.
Median age significantly above state average.
Foreign-born population percentage below state average.
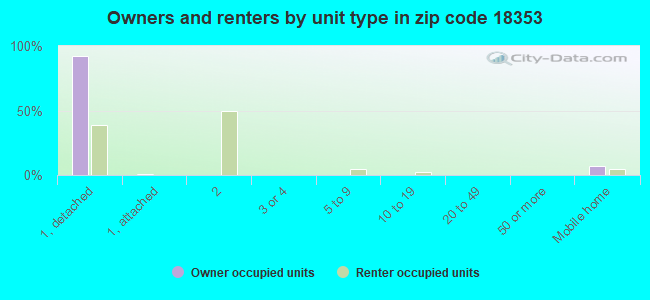
Renting percentage significantly below state average.
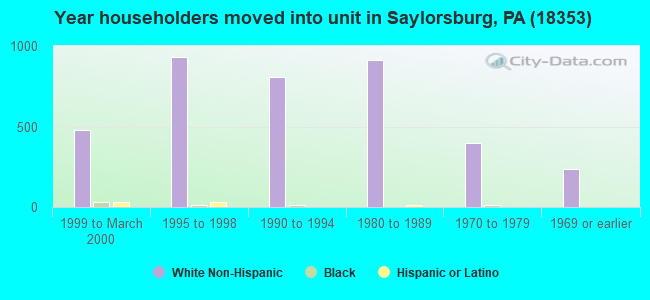
Length of stay since moving in significantly above state average.
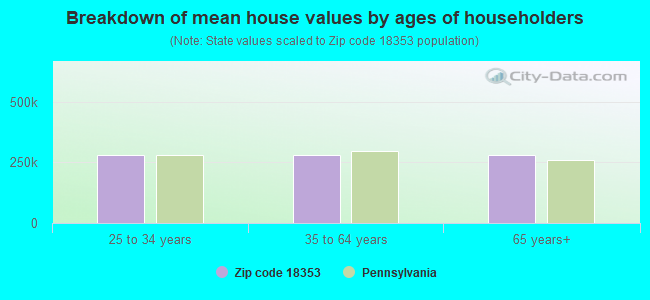
Estimated median house/condo value in 2022: $260,912
18353:
$260,912
Pennsylvania:
$245,500
According to our research of Pennsylvania and other state lists, there were 5 registered sex offenders living in 18353 zip code as of May 20, 2024. The ratio of all residents to sex offenders in zip code 18353 is 2,464 to 1. The ratio of registered sex offenders to all residents in this zip code is much lower than the state average.
Median resident age:
This zip code:
53.1 years
Pennsylvania median age:
40.9 years
Average household size:
This zip code:
2.5 people
Pennsylvania:
2.4 people
Averages for the 2020 tax year for zip code 18353, filed in 2021:
Average Adjusted Gross Income (AGI) in 2020: $63,954 (Individual Income Tax Returns)
Here:
$63,954
State:
$75,707
Salary/wage: $56,732 (reported on 80.7% of returns)
Here:
$56,732
State:
$62,806
(% of AGI for various income ranges: 1056.0% for AGIs below $25k, 3447.3% for AGIs $25k-50k, 6338.7% for AGIs $50k-75k, 8343.9% for AGIs $75k-100k, 17761.3% for AGIs $100k-200k, 53507.1% for AGIs over 200k)
Taxable interest for individuals: $938 (reported on 27.9% of returns)
This zip code:
$938
Pennsylvania:
$1,633
(% of AGI for various income ranges: 15.8% for AGIs below $25k, 16.2% for AGIs $25k-50k, 29.1% for AGIs $50k-75k, 76.7% for AGIs $75k-100k, 66.9% for AGIs $100k-200k, 348.6% for AGIs over 200k)
Ordinary dividends: $3,124 (reported on 18.2% of returns)
Here:
$3,124
State:
$7,382
(% of AGI for various income ranges: 18.5% for AGIs below $25k, 33.3% for AGIs $25k-50k, 87.2% for AGIs $50k-75k, 98.4% for AGIs $75k-100k, 161.3% for AGIs $100k-200k, 1177.1% for AGIs over 200k)
Net capital gain/loss in AGI: +$9,074 (reported on 14.9% of returns)
Here:
+$9,074
State:
+$23,522
(% of AGI for various income ranges: 5.2% for AGIs below $25k, 20.2% for AGIs $25k-50k, 82.1% for AGIs $50k-75k, 126.3% for AGIs $75k-100k, 486.0% for AGIs $100k-200k, 5510.0% for AGIs over 200k)
Profit/loss from business: +$11,379 (reported on 14.4% of returns)
Here:
+$11,379
State:
+$16,274
(% of AGI for various income ranges: 77.5% for AGIs below $25k, 124.7% for AGIs $25k-50k, 285.3% for AGIs $50k-75k, 190.6% for AGIs $75k-100k, 466.8% for AGIs $100k-200k, 2930.0% for AGIs over 200k)
Taxable individual retirement arrangement distribution: $15,510 (reported on 9.7% of returns)
18353:
$15,510
Pennsylvania:
$18,583
(% of AGI for various income ranges: 72.7% for AGIs below $25k, 112.7% for AGIs $25k-50k, 152.5% for AGIs $50k-75k, 312.7% for AGIs $75k-100k, 556.6% for AGIs $100k-200k, 1627.1% for AGIs over 200k)
Total itemized deductions: $26,140 (reported on 6.5% of returns)
Here:
$26,140
State:
$34,850
(% of AGI for various income ranges: 35.4% for AGIs below $25k, 107.4% for AGIs $25k-50k, 219.3% for AGIs $50k-75k, 372.2% for AGIs $75k-100k, 560.3% for AGIs $100k-200k, 2894.3% for AGIs over 200k)
Charity contributions: $5,314 (reported on 4.7% of returns)
Here:
$5,314
State:
$12,392
(% of AGI for various income ranges: 12.9% for AGIs $25k-50k, 18.7% for AGIs $50k-75k, 62.9% for AGIs $75k-100k, 115.5% for AGIs $100k-200k, 345.7% for AGIs over 200k)
Taxes paid: $8,290 (reported on 6.5% of returns)
18353:
$8,290
State:
$8,200
(% of AGI for various income ranges: 10.8% for AGIs below $25k, 29.2% for AGIs $25k-50k, 78.4% for AGIs $50k-75k, 125.3% for AGIs $75k-100k, 207.3% for AGIs $100k-200k, 597.1% for AGIs over 200k)
Earned income credit: $1,826 (reported on 11.0% of returns)
Here:
$1,826
State:
$2,100
(% of AGI for various income ranges: 58.5% for AGIs below $25k, 49.1% for AGIs $25k-50k)
Percentage of individuals using paid preparers for their 2020 taxes: 92.5%
Here:
93%
State:
92%
(% for various income ranges: 90.9% for AGIs below $25k, 93.3% for AGIs $25k-50k, 92.9% for AGIs $50k-75k, 93.1% for AGIs $75k-100k, 93.4% for AGIs $100k-200k, 94.7% for AGIs over 200k)
Averages for the 2012 tax year for zip code 18353, filed in 2013:
Average Adjusted Gross Income (AGI) in 2012: $53,202 (Individual Income Tax Returns)
Here:
$53,202
State:
$61,346
Salary/wage: $48,660 (reported on 84.5% of returns)
Here:
$48,660
State:
$51,902
(% of AGI for various income ranges: 71.3% for AGIs below $25k, 75.2% for AGIs $25k-50k, 76.4% for AGIs $50k-75k, 80.3% for AGIs $75k-100k, 81.4% for AGIs $100k-200k, 65.0% for AGIs over 200k)
Taxable interest for individuals: $888 (reported on 32.6% of returns)
This zip code:
$888
Pennsylvania:
$1,588
(% of AGI for various income ranges: 1.1% for AGIs below $25k, 0.6% for AGIs $25k-50k, 0.6% for AGIs $50k-75k, 0.4% for AGIs $75k-100k, 0.5% for AGIs $100k-200k, 0.4% for AGIs over 200k)
Ordinary dividends: $2,375 (reported on 21.1% of returns)
Here:
$2,375
State:
$5,827
(% of AGI for various income ranges: 1.2% for AGIs below $25k, 1.1% for AGIs $25k-50k, 0.8% for AGIs $50k-75k, 1.0% for AGIs $75k-100k, 0.7% for AGIs $100k-200k, 1.6% for AGIs over 200k)
Net capital gain/loss in AGI: +$2,442 (reported on 12.6% of returns)
Here:
+$2,442
State:
+$14,495
(% of AGI for various income ranges: 0.4% for AGIs $75k-100k, 0.5% for AGIs $100k-200k, 4.2% for AGIs over 200k)
Profit/loss from business: +$12,732 (reported on 13.4% of returns)
Here:
+$12,732
State:
+$16,268
(% of AGI for various income ranges: 7.0% for AGIs below $25k, 3.8% for AGIs $25k-50k, 3.0% for AGIs $50k-75k, 1.2% for AGIs $75k-100k, 2.1% for AGIs $100k-200k, 8.1% for AGIs over 200k)
Taxable individual retirement arrangement distribution: $13,247 (reported on 9.9% of returns)
18353:
$13,247
Pennsylvania:
$14,550
(% of AGI for various income ranges: 3.4% for AGIs below $25k, 2.1% for AGIs $25k-50k, 2.4% for AGIs $50k-75k, 2.6% for AGIs $75k-100k, 3.0% for AGIs $100k-200k)
Total itemized deductions: $20,531 (23% of AGI, reported on 37.5% of returns)
Here:
$20,531
State:
$23,538
Here:
22.6% of AGI
State:
18.4% of AGI
(% of AGI for various income ranges: 9.8% for AGIs below $25k, 12.4% for AGIs $25k-50k, 14.6% for AGIs $50k-75k, 15.6% for AGIs $75k-100k, 16.5% for AGIs $100k-200k, 11.9% for AGIs over 200k)
Charity contributions: $2,124 (reported on 29.7% of returns)
Here:
$2,124
State:
$4,025
(% of AGI for various income ranges: 0.6% for AGIs below $25k, 0.8% for AGIs $25k-50k, 1.1% for AGIs $50k-75k, 1.2% for AGIs $75k-100k, 1.3% for AGIs $100k-200k, 2.1% for AGIs over 200k)
Taxes paid: $8,797 (reported on 37.3% of returns)
18353:
$8,797
State:
$9,982
(% of AGI for various income ranges: 2.9% for AGIs below $25k, 4.3% for AGIs $25k-50k, 6.0% for AGIs $50k-75k, 6.6% for AGIs $75k-100k, 7.6% for AGIs $100k-200k, 6.2% for AGIs over 200k)
Earned income credit: $1,979 (reported on 12.7% of returns)
Here:
$1,979
State:
$2,106
(% of AGI for various income ranges: 4.4% for AGIs below $25k, 0.9% for AGIs $25k-50k)
Percentage of individuals using paid preparers for their 2012 taxes: 59.0%
Here:
59%
State:
53%
(% for various income ranges: 50.0% for AGIs below $25k, 60.7% for AGIs $25k-50k, 66.7% for AGIs $50k-75k, 62.5% for AGIs $75k-100k, 66.7% for AGIs $100k-200k, 87.5% for AGIs over 200k)
Averages for the 2004 tax year for zip code 18353, filed in 2005:
Average Adjusted Gross Income (AGI) in 2004: $45,755 (Individual Income Tax Returns)
Here:
$45,755
State:
$48,049
Salary/wage: $43,441 (reported on 86.1% of returns)
Here:
$43,441
State:
$42,646
(% of AGI for various income ranges: 94.7% for AGIs below $10k, 71.3% for AGIs $10k-25k, 79.2% for AGIs $25k-50k, 84.3% for AGIs $50k-75k, 88.5% for AGIs $75k-100k, 77.9% for AGIs over 100k)
Taxable interest for individuals: $861 (reported on 52.2% of returns)
This zip code:
$861
Pennsylvania:
$1,657
(% of AGI for various income ranges: 4.5% for AGIs below $10k, 2.8% for AGIs $10k-25k, 1.2% for AGIs $25k-50k, 0.8% for AGIs $50k-75k, 0.6% for AGIs $75k-100k, 0.6% for AGIs over 100k)
Taxable dividends: $1,647 (reported on 24.6% of returns)
Here:
$1,647
State:
$3,566
(% of AGI for various income ranges: 3.8% for AGIs below $10k, 1.3% for AGIs $10k-25k, 1.0% for AGIs $25k-50k, 0.9% for AGIs $50k-75k, 0.6% for AGIs $75k-100k, 0.8% for AGIs over 100k)
Net capital gain/loss: +$3,668 (reported on 18.1% of returns)
Here:
+$3,668
State:
+$9,716
(% of AGI for various income ranges: -2.9% for AGIs below $10k, 0.6% for AGIs $10k-25k, 0.3% for AGIs $25k-50k, 0.7% for AGIs $50k-75k, 0.3% for AGIs $75k-100k, 4.2% for AGIs over 100k)
Profit/loss from business: +$11,217 (reported on 14.8% of returns)
Here:
+$11,217
State:
+$14,267
(% of AGI for various income ranges: 8.5% for AGIs below $10k, 6.6% for AGIs $10k-25k, 5.1% for AGIs $25k-50k, 2.8% for AGIs $50k-75k, 2.2% for AGIs $75k-100k, 3.5% for AGIs over 100k)
IRA payment deduction: $3,276 (reported on 2.9% of returns)
18353:
$3,276
Pennsylvania:
$2,903
(% of AGI for various income ranges: 0.2% for AGIs $10k-25k, 0.4% for AGIs $25k-50k, 0.2% for AGIs $50k-75k, 0.2% for AGIs $75k-100k, 0.1% for AGIs over 100k)
Self-employed pension: $10,500 (reported on 0.6% of returns)
Here:
$10,500
Pennsylvania:
$14,674
Total itemized deductions: $18,352 (25% of AGI, reported on 43.9% of returns)
Here:
$18,352
State:
$18,804
Here:
24.8% of AGI
State:
19.5% of AGI
(% of AGI for various income ranges: 9.9% for AGIs below $10k, 13.8% for AGIs $10k-25k, 16.2% for AGIs $25k-50k, 19.4% for AGIs $50k-75k, 18.8% for AGIs $75k-100k, 17.4% for AGIs over 100k)
Charity contributions deductions: $1,971 (3% of AGI, reported on 38.7% of returns)
Here:
$1,971
State:
$3,337
Here:
2.6% of AGI
State:
3.3% of AGI
(% of AGI for various income ranges: 0.4% for AGIs below $10k, 0.9% for AGIs $10k-25k, 1.3% for AGIs $25k-50k, 1.6% for AGIs $50k-75k, 1.9% for AGIs $75k-100k, 2.0% for AGIs over 100k)
Total tax: $5,811 (reported on 76.0% of returns)
18353:
$5,811
State:
$8,008
(% of AGI for various income ranges: 2.9% for AGIs below $10k, 4.4% for AGIs $10k-25k, 6.7% for AGIs $25k-50k, 7.7% for AGIs $50k-75k, 9.2% for AGIs $75k-100k, 15.3% for AGIs over 100k)
Earned income credit: $1,613 (reported on 10.3% of returns)
Here:
$1,613
State:
$1,643
Percentage of individuals using paid preparers for their 2004 taxes: 61.3%
Here:
61%
State:
56%
(% for various income ranges: 50.4% for AGIs below $10k, 60.1% for AGIs $10k-25k, 64.4% for AGIs $25k-50k, 64.3% for AGIs $50k-75k, 66.7% for AGIs $75k-100k, 69.1% for AGIs over 100k)
Household received Food Stamps/SNAP in the past 12 months: 416 Household did not receive Food Stamps/SNAP in the past 12 months: 4,069
Women who had a birth in the past 12 months: 281 (135 now married, 132 unmarried) Women who did not have a birth in the past 12 months: 1,464 (727 now married, 732 unmarried)
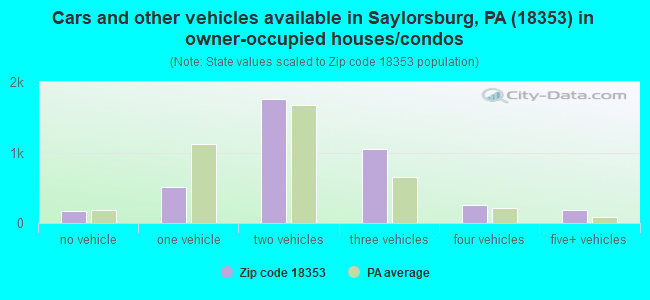
Housing units in zip code 18353 with a mortgage: 2,324 (299 second mortgage, 42 home equity loan, 232 both second mortgage and home equity loan) Houses without a mortgage: 112
Median monthly owner costs for units with a mortgage: $1,648 Median monthly owner costs for units without a mortgage: $771
Residents with income below the poverty level in 2022:
This zip code:
9.2%
Whole state:
11.8%
Residents with income below 50% of the poverty level in 2022:
This zip code:
4.9%
Whole state:
6.1%
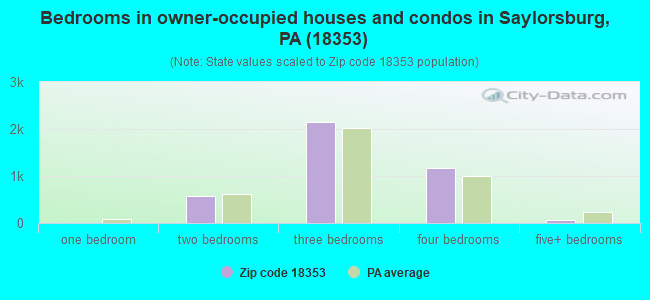
Median number of rooms in houses and condos:
Here:
6.7
State:
6.8
Median number of rooms in apartments:
Here:
5.0
State:
4.3
Notable locations in this zip code not listed on our city pages
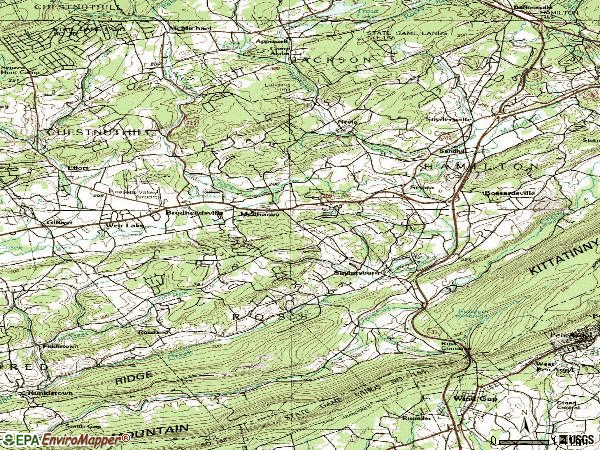
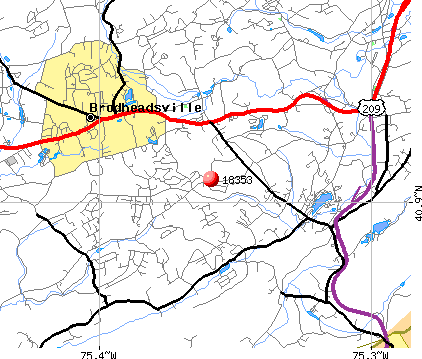
Notable locations in zip code 18353: Vista Estates (A), Hamilton Hills South (B), Evergreen Acres (C), Blue Ridge Hook and Ladder Fire Company 1 Station 23 Saylorsburg (D). Display/hide their locations on the map
Lakes and reservoirs: Saylors Lake (A), Princess Lake (B), Chicola Lake (C), Witmers Lake (D), Nazareth Reservoir (E), Lake Watawah (F). Display/hide their locations on the map
Streams, rivers, and creeks: Spring Run (A), Frantzs Creek (B), Ross Common Creek (C), Princess Run (D), Pine Creek (E). Display/hide their locations on the map
In group quarters: 40 (-1 institutionalized population)
Size of family households: 1,528 2-persons, 732 3-persons, 487 4-persons, 197 5-persons, 55 6-persons, 50 7-or-more-persons
Size of nonfamily households: 1,163 1-person, 264 2-persons, 14 4-persons
1,307 married couples with children.
304 single-parent households (304 women).
90.2% of residents of 18353 zip code speak English at home.
5.6% of residents speak Spanish at home (89% very well, 2% well, 9% not at all).
3.0% of residents speak other Indo-European language at home (72% very well, 28% well).
1.1% of residents speak Asian or Pacific Island language at home (56% very well, 27% well, 17% not well).
0.2% of residents speak other language at home (100% very well).
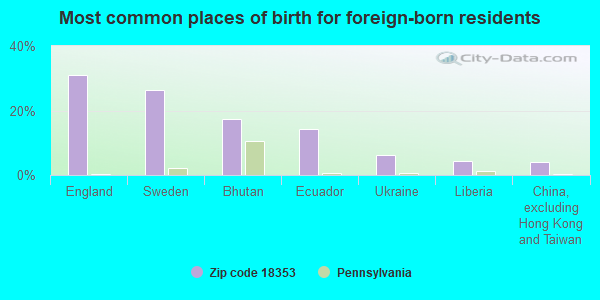
Foreign born population: 409 (3.6%) (65.0% of them are naturalized citizens)
This zip code:
3.6%
Whole state:
7.5%
31%England
26%Sweden
17%Bhutan
14%Ecuador
6%Ukraine
4%Liberia
4%China, excluding Hong Kong and Taiwan
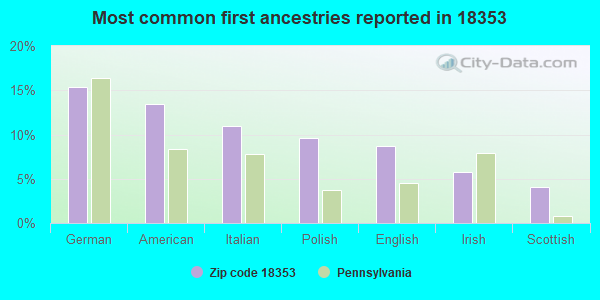
15%German
13%American
11%Italian
10%Polish
9%English
6%Irish
4%Scottish
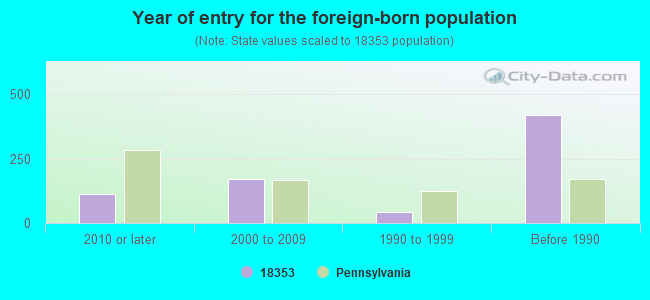
Year of entry for the foreign-born population
1142010 or later
1702000 to 2009
411990 to 1999
420Before 1990
Facilities with environmental interests located in this zip code:
BLUE MTN VILLAGE ON CHICOLA LK (1 BLUE MOUNTAIN VLG in SAYLORSBURG, PA)
STATE MASTER (Pennsylvania database) - PWSID-2450033, DRINKING WATER PROGRAM National Pollutant Discharge Elimination System NON-MAJOR (Tracking pollutant discharge elimination systems) - permit COMMUNITY WATER SYSTEM (SDWIS) - SDWIS-PA2450033 301, WATER TREATMENT PLANT Business SIC classification: OPERATORS OF RESIDENTIAL MOBILE HOME SITES; PRIVATE HOUSEHOLDS Alternative names: BLUE MOUNTAIN VILLAGE SALES, BLUE MOUNTAIN VILLAGE SALES IN, BLUE MTN VILLAGE SEWAGE PLANT
Housing units lacking complete plumbing facilities: 1.0% Housing units lacking complete kitchen facilities: 1.1%
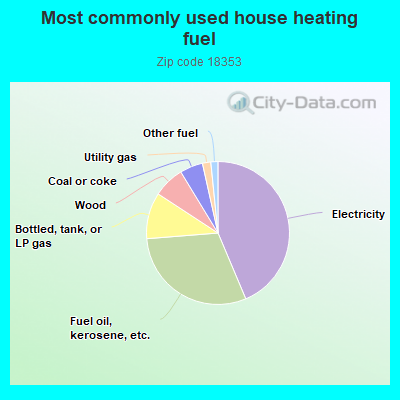
43.7%Electricity
30.1%Fuel oil, kerosene, etc.
10.5%Bottled, tank, or LP gas
7.1%Wood
5.2%Coal or coke
1.9%Utility gas
1.6%Other fuel
Population in 1990: 6,970. Population change in the 1990s: +4,087 (+58.6%).
Place of birth for U.S.-born residents:
This state: 5,771
Northeast: 4,067
Midwest: 260
South: 430
West: 199
63% of the 18353 zip code residents lived in the same house 5 years ago. Out of people who lived in different houses, 34% lived in this county. Out of people who lived in different counties, 50% lived in Pennsylvania.
95% of the 18353 zip code residents lived in the same house 1 year ago. Out of people who lived in different houses, 6% moved from this county. Out of people who lived in different houses, 17% moved from different county within same state. Out of people who lived in different houses, 86% moved from different state.
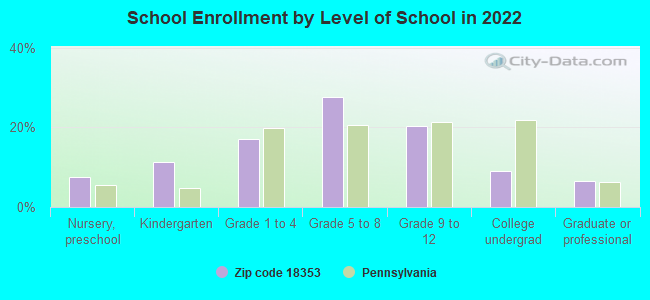
Private vs. public school enrollment:
Students in private schools in grades 1 to 8 (elementary and middle school): 98
Here:
13.8%
Pennsylvania:
15.7%
Students in private schools in grades 9 to 12 (high school): 42
Here:
13.0%
Pennsylvania:
13.4%
Students in private undergraduate colleges: 41
Here:
29.0%
Pennsylvania:
39.8%
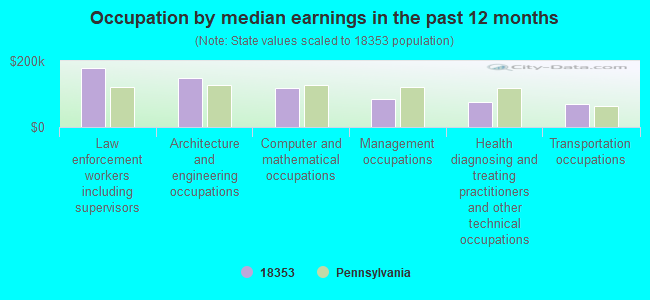
Occupation by median earnings in the past 12 months ($)
179,672Law enforcement workers including supervisors
147,764Architecture and engineering occupations
118,500Computer and mathematical occupations
84,747Management occupations
75,742Health diagnosing and treating practitioners and other technical occupations
68,483Transportation occupations
Companies with federal contracts located in this zip code:
SAYLORSBURG LUMBER COMPANY INC (RT 115 & RT 33 in SAYLORSBURG, PA; small business) : $102,162 in 13 contractsfrom 2003 to 2006
Contracts for Airframe Structural Components, Millwork, Lumber and Related Basic Wood Materials, Electrical Insulators and Insulating Materials, and moreby Army Signed by year:2000: $0; 2001: $0; 2002: $0; 2003: $11,197; 2004: $27,437; 2005: $2,715; 2006: $60,813.
Biggest contracts:
$47,512 with Army for Airframe Structural Components. Signed on 2006-02-10. Completion date: 2006-03-10.
$10,800, same as above.Signed on 2004-04-01. Completion date: 2004-04-09.
$8,872 with Army for Millwork. Signed on 2004-05-04. Completion date: 2004-05-28.
$7,765 with Army for Lumber and Related Basic Wood Materials. Signed on 2004-05-18. Completion date: 2004-06-11.
ERIN MASLY (MEIXEL VALLEY ROAD in SAYLORSBURG, PA; small business) : $10,652 in 2 contractsin 2001
$7,154 with Army for Education Services. Signed on 2001-07-18. Completion date: 2001-09-14.
$3,498, same as above.Signed on 2001-09-25. Completion date: 2001-09-14.
Top industries in this zip code by the number of employees in 2005:


 Nearest zip codes: 18322, 18354, 18091, 18331, 18360, 18072.