Estimated zip code population in 2022: 4,027 Zip code population in 2010: 4,192 Zip code population in 2000: 4,238
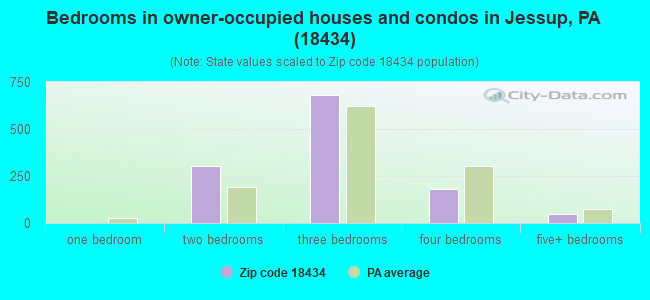
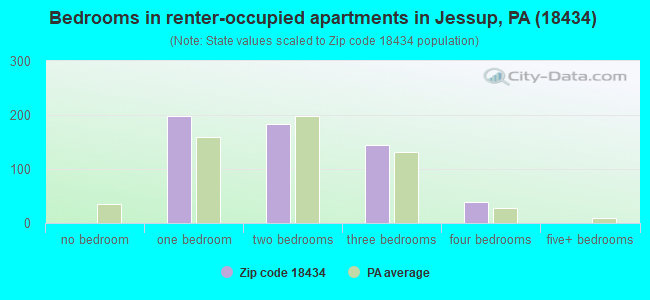
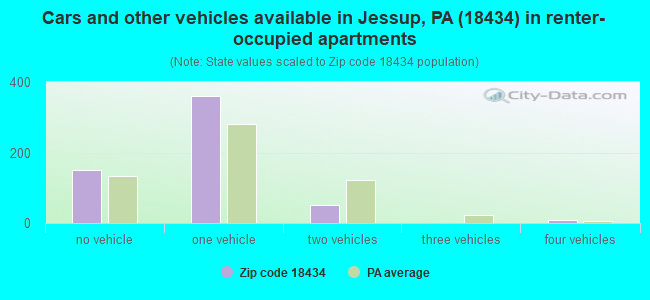
Houses and condos: 1,973 Renter-occupied apartments: 568
% of renters here:
32%
State:
31%
March 2022 cost of living index in zip code 18434: 93.8 (less than average, U.S. average is 100)
Land area: 6.6 sq. mi. Water area: 0.0 sq. mi.
Population density: 606 people per square mile
(low).
OSM Map
General Map
Google Map
MSN Map
OSM Map
General Map
Google Map
MSN Map
OSM Map
General Map
Google Map
MSN Map
OSM Map
General Map
Google Map
MSN Map
Please wait while loading the map...
Real estate property taxes paid for housing units in 2022:
This zip code:
0.9% ($1,563)
Pennsylvania:
1.3% ($3,094)
Median real estate property taxes paid for housing units with mortgages in 2022: $1,900 (1.2%) Median real estate property taxes paid for housing units with no mortgage in 2022: $1,185 (0.7%)
Business Search- 14 Million verified businesses
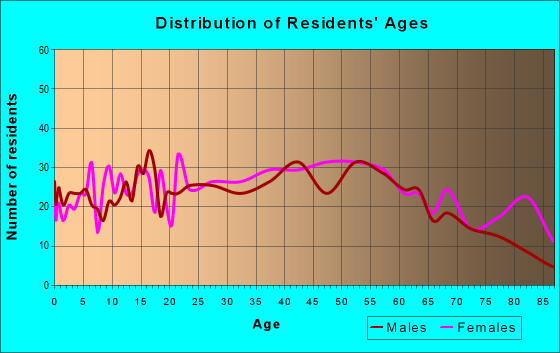
Males: 1,892
(47.0%)
Females: 2,134
(53.0%)
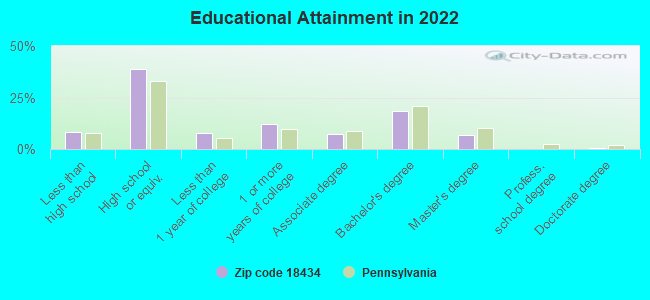
For population 25 years and over in 18434:
High school or higher: 91.6%
Bachelor's degree or higher: 25.8%
Graduate or professional degree: 7.6%
Unemployed: 2.4%
Mean travel time to work (commute): 22.2 minutes
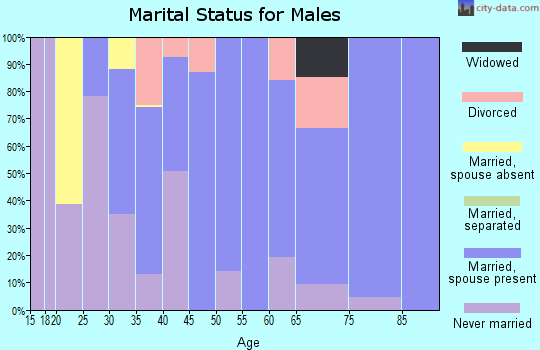
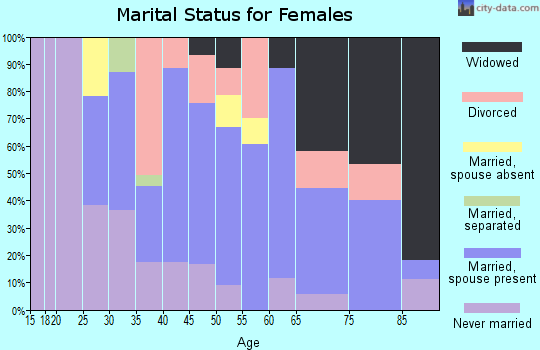
For population 15 years and over in 18434:
Never married: 38.7%
Now married: 42.3%
Separated: 1.1%
Widowed: 4.1%
Divorced: 13.9%
Zip code 18434 compared to state average:
Unemployed percentage below state average.
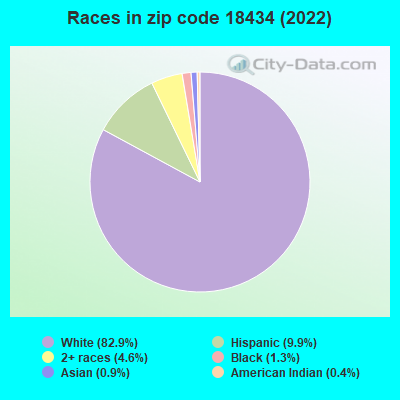
Black race population percentage significantly below state average.
Median age above state average.
Foreign-born population percentage significantly below state average.
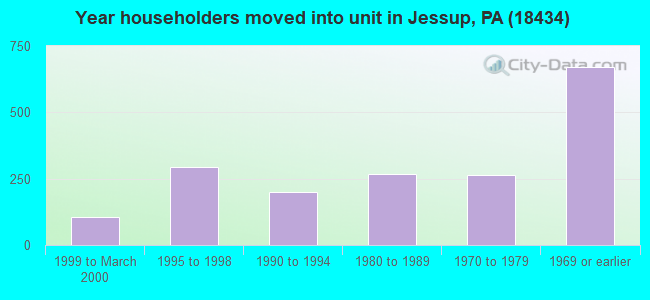
Length of stay since moving in significantly above state average.
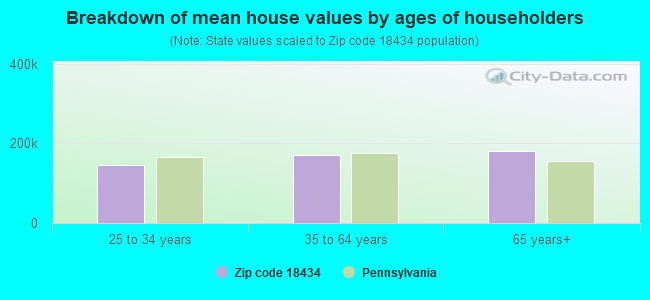
Estimated median house/condo value in 2022: $167,682
18434:
$167,682
Pennsylvania:
$245,500
According to our research of Pennsylvania and other state lists, there were 3 registered sex offenders living in 18434 zip code as of May 20, 2024. The ratio of all residents to sex offenders in zip code 18434 is 1,367 to 1. The ratio of registered sex offenders to all residents in this zip code is lower than the state average.
Median resident age:
This zip code:
45.7 years
Pennsylvania median age:
40.9 years
Average household size:
This zip code:
2.2 people
Pennsylvania:
2.4 people
Averages for the 2020 tax year for zip code 18434, filed in 2021:
Average Adjusted Gross Income (AGI) in 2020: $50,261 (Individual Income Tax Returns)
Here:
$50,261
State:
$75,707
Salary/wage: $46,275 (reported on 79.9% of returns)
Here:
$46,275
State:
$62,806
(% of AGI for various income ranges: 1003.2% for AGIs below $25k, 3433.9% for AGIs $25k-50k, 6075.3% for AGIs $50k-75k, 7956.5% for AGIs $75k-100k, 16287.1% for AGIs $100k-200k)
Taxable interest for individuals: $1,152 (reported on 27.9% of returns)
This zip code:
$1,152
Pennsylvania:
$1,633
(% of AGI for various income ranges: 34.3% for AGIs below $25k, 12.2% for AGIs $25k-50k, 48.0% for AGIs $50k-75k, 37.6% for AGIs $75k-100k, 161.2% for AGIs $100k-200k)
Ordinary dividends: $2,932 (reported on 21.5% of returns)
Here:
$2,932
State:
$7,382
(% of AGI for various income ranges: 34.5% for AGIs below $25k, 38.6% for AGIs $25k-50k, 61.3% for AGIs $50k-75k, 134.1% for AGIs $75k-100k, 361.8% for AGIs $100k-200k)
Net capital gain/loss in AGI: +$3,555 (reported on 14.2% of returns)
Here:
+$3,555
State:
+$23,522
(% of AGI for various income ranges: 16.8% for AGIs below $25k, 20.4% for AGIs $25k-50k, 67.7% for AGIs $50k-75k, 75.9% for AGIs $75k-100k, 347.6% for AGIs $100k-200k)
Profit/loss from business: +$9,218 (reported on 10.0% of returns)
Here:
+$9,218
State:
+$16,274
(% of AGI for various income ranges: 70.0% for AGIs below $25k, 99.8% for AGIs $25k-50k, 112.7% for AGIs $50k-75k, 82.4% for AGIs $75k-100k, 430.6% for AGIs $100k-200k)
Taxable individual retirement arrangement distribution: $10,488 (reported on 11.4% of returns)
18434:
$10,488
Pennsylvania:
$18,583
(% of AGI for various income ranges: 96.2% for AGIs below $25k, 75.5% for AGIs $25k-50k, 183.3% for AGIs $50k-75k, 345.9% for AGIs $75k-100k, 389.4% for AGIs $100k-200k)
Total itemized deductions: $28,625 (reported on 1.8% of returns)
Here:
$28,625
State:
$34,850
(% of AGI for various income ranges: 90.4% for AGIs $25k-50k, 412.9% for AGIs $100k-200k)
Charity contributions: $2,367 (reported on 1.4% of returns)
Here:
$2,367
State:
$12,392
(% of AGI for various income ranges: 23.7% for AGIs $50k-75k)
Taxes paid: $6,900 (reported on 1.8% of returns)
18434:
$6,900
State:
$8,200
(% of AGI for various income ranges: 162.4% for AGIs $100k-200k)
Earned income credit: $2,146 (reported on 12.8% of returns)
Here:
$2,146
State:
$2,100
(% of AGI for various income ranges: 71.9% for AGIs below $25k, 53.7% for AGIs $25k-50k)
Percentage of individuals using paid preparers for their 2020 taxes: 92.7%
Here:
93%
State:
92%
(% for various income ranges: 90.1% for AGIs below $25k, 95.0% for AGIs $25k-50k, 94.9% for AGIs $50k-75k, 90.9% for AGIs $75k-100k, 100.0% for AGIs $100k-200k, 0.0% for AGIs over 200k)
Averages for the 2012 tax year for zip code 18434, filed in 2013:
Average Adjusted Gross Income (AGI) in 2012: $42,225 (Individual Income Tax Returns)
Here:
$42,225
State:
$61,346
Salary/wage: $38,048 (reported on 83.0% of returns)
Here:
$38,048
State:
$51,902
(% of AGI for various income ranges: 69.1% for AGIs below $25k, 79.2% for AGIs $25k-50k, 78.7% for AGIs $50k-75k, 78.3% for AGIs $75k-100k, 65.7% for AGIs $100k-200k)
Taxable interest for individuals: $1,032 (reported on 35.9% of returns)
This zip code:
$1,032
Pennsylvania:
$1,588
(% of AGI for various income ranges: 1.8% for AGIs below $25k, 0.9% for AGIs $25k-50k, 0.9% for AGIs $50k-75k, 0.6% for AGIs $75k-100k, 0.6% for AGIs $100k-200k)
Ordinary dividends: $2,200 (reported on 24.8% of returns)
Here:
$2,200
State:
$5,827
(% of AGI for various income ranges: 1.7% for AGIs below $25k, 1.1% for AGIs $25k-50k, 1.0% for AGIs $50k-75k, 1.4% for AGIs $75k-100k, 1.6% for AGIs $100k-200k)
Net capital gain/loss in AGI: +$754 (reported on 13.6% of returns)
Here:
+$754
State:
+$14,495
(% of AGI for various income ranges: 0.5% for AGIs $50k-75k, 0.6% for AGIs $75k-100k, 0.5% for AGIs $100k-200k)
Profit/loss from business: +$9,718 (reported on 10.7% of returns)
Here:
+$9,718
State:
+$16,268
(% of AGI for various income ranges: 5.2% for AGIs below $25k, 3.1% for AGIs $25k-50k, 1.3% for AGIs $50k-75k, 0.8% for AGIs $75k-100k, 3.1% for AGIs $100k-200k)
Taxable individual retirement arrangement distribution: $11,235 (reported on 12.6% of returns)
18434:
$11,235
Pennsylvania:
$14,550
(% of AGI for various income ranges: 5.6% for AGIs below $25k, 2.8% for AGIs $25k-50k, 2.4% for AGIs $50k-75k, 3.1% for AGIs $75k-100k, 4.2% for AGIs $100k-200k)
Total itemized deductions: $14,751 (20% of AGI, reported on 19.9% of returns)
Here:
$14,751
State:
$23,538
Here:
19.8% of AGI
State:
18.4% of AGI
(% of AGI for various income ranges: 4.6% for AGIs below $25k, 5.8% for AGIs $25k-50k, 6.4% for AGIs $50k-75k, 8.8% for AGIs $75k-100k, 8.4% for AGIs $100k-200k)
Charity contributions: $1,597 (reported on 16.5% of returns)
Here:
$1,597
State:
$4,025
(% of AGI for various income ranges: 0.4% for AGIs below $25k, 0.4% for AGIs $25k-50k, 0.6% for AGIs $50k-75k, 0.7% for AGIs $75k-100k, 0.9% for AGIs $100k-200k)
Taxes paid: $5,461 (reported on 19.9% of returns)
18434:
$5,461
State:
$9,982
(% of AGI for various income ranges: 0.9% for AGIs below $25k, 1.7% for AGIs $25k-50k, 2.1% for AGIs $50k-75k, 3.3% for AGIs $75k-100k, 4.3% for AGIs $100k-200k)
Earned income credit: $2,052 (reported on 13.1% of returns)
Here:
$2,052
State:
$2,106
(% of AGI for various income ranges: 4.3% for AGIs below $25k, 0.7% for AGIs $25k-50k)
Percentage of individuals using paid preparers for their 2012 taxes: 55.8%
Here:
56%
State:
53%
(% for various income ranges: 51.2% for AGIs below $25k, 53.6% for AGIs $25k-50k, 62.9% for AGIs $50k-75k, 63.2% for AGIs $75k-100k, 64.3% for AGIs $100k-200k)
Averages for the 2004 tax year for zip code 18434, filed in 2005:
Average Adjusted Gross Income (AGI) in 2004: $36,798 (Individual Income Tax Returns)
Here:
$36,798
State:
$48,049
Salary/wage: $33,672 (reported on 83.5% of returns)
Here:
$33,672
State:
$42,646
(% of AGI for various income ranges: 72.6% for AGIs below $10k, 70.6% for AGIs $10k-25k, 83.5% for AGIs $25k-50k, 84.1% for AGIs $50k-75k, 78.3% for AGIs $75k-100k, 53.7% for AGIs over 100k)
Taxable interest for individuals: $1,217 (reported on 54.5% of returns)
This zip code:
$1,217
Pennsylvania:
$1,657
(% of AGI for various income ranges: 7.8% for AGIs below $10k, 3.8% for AGIs $10k-25k, 1.9% for AGIs $25k-50k, 0.9% for AGIs $50k-75k, 1.6% for AGIs $75k-100k, 1.1% for AGIs over 100k)
Taxable dividends: $1,611 (reported on 29.2% of returns)
Here:
$1,611
State:
$3,566
(% of AGI for various income ranges: 3.2% for AGIs below $10k, 1.8% for AGIs $10k-25k, 0.7% for AGIs $25k-50k, 1.1% for AGIs $50k-75k, 1.1% for AGIs $75k-100k, 2.1% for AGIs over 100k)
Net capital gain/loss: +$3,010 (reported on 15.9% of returns)
Here:
+$3,010
State:
+$9,716
(% of AGI for various income ranges: -3.0% for AGIs below $10k, 0.6% for AGIs $10k-25k, -0.2% for AGIs $25k-50k, 0.3% for AGIs $50k-75k, 0.4% for AGIs $75k-100k, 7.9% for AGIs over 100k)
Profit/loss from business: +$8,723 (reported on 11.1% of returns)
Here:
+$8,723
State:
+$14,267
(% of AGI for various income ranges: 5.1% for AGIs below $10k, 4.2% for AGIs $10k-25k, 2.6% for AGIs $25k-50k, 2.9% for AGIs $50k-75k, 2.9% for AGIs $75k-100k, 0.5% for AGIs over 100k)
IRA payment deduction: $2,805 (reported on 4.4% of returns)
18434:
$2,805
Pennsylvania:
$2,903
(% of AGI for various income ranges: 0.4% for AGIs $10k-25k, 0.6% for AGIs $25k-50k, 0.3% for AGIs $50k-75k, 0.3% for AGIs $75k-100k)
Total itemized deductions: $12,753 (18% of AGI, reported on 19.2% of returns)
Here:
$12,753
State:
$18,804
Here:
17.6% of AGI
State:
19.5% of AGI
(% of AGI for various income ranges: 3.8% for AGIs $10k-25k, 6.1% for AGIs $25k-50k, 7.6% for AGIs $50k-75k, 8.4% for AGIs $75k-100k, 7.4% for AGIs over 100k)
Charity contributions deductions: $1,679 (2% of AGI, reported on 17.6% of returns)
Here:
$1,679
State:
$3,337
Here:
2.2% of AGI
State:
3.3% of AGI
(% of AGI for various income ranges: 0.3% for AGIs $10k-25k, 0.6% for AGIs $25k-50k, 0.9% for AGIs $50k-75k, 0.9% for AGIs $75k-100k, 1.4% for AGIs over 100k)
Total tax: $4,619 (reported on 76.9% of returns)
18434:
$4,619
State:
$8,008
(% of AGI for various income ranges: 2.6% for AGIs below $10k, 4.5% for AGIs $10k-25k, 7.2% for AGIs $25k-50k, 9.4% for AGIs $50k-75k, 11.1% for AGIs $75k-100k, 17.7% for AGIs over 100k)
Earned income credit: $1,347 (reported on 11.4% of returns)
Here:
$1,347
State:
$1,643
Percentage of individuals using paid preparers for their 2004 taxes: 56.1%
Here:
56%
State:
56%
(% for various income ranges: 51.4% for AGIs below $10k, 58.0% for AGIs $10k-25k, 54.9% for AGIs $25k-50k, 56.9% for AGIs $50k-75k, 56.1% for AGIs $75k-100k, 78.7% for AGIs over 100k)
Household received Food Stamps/SNAP in the past 12 months: 363 Household did not receive Food Stamps/SNAP in the past 12 months: 1,433
Women who had a birth in the past 12 months: 164 (57 now married, 94 unmarried) Women who did not have a birth in the past 12 months: 773 (251 now married, 524 unmarried)
Housing units in zip code 18434 with a mortgage: 665 (132 second mortgage, 112 both second mortgage and home equity loan) Houses without a mortgage: 29
Median monthly owner costs for units with a mortgage: $1,219 Median monthly owner costs for units without a mortgage: $436
Residents with income below the poverty level in 2022:
This zip code:
18.6%
Whole state:
11.8%
Residents with income below 50% of the poverty level in 2022:
This zip code:
5.2%
Whole state:
6.1%
Median number of rooms in houses and condos:
Here:
6.5
State:
6.8
Median number of rooms in apartments:
Here:
5.0
State:
4.3
Notable locations in this zip code not listed on our city pages
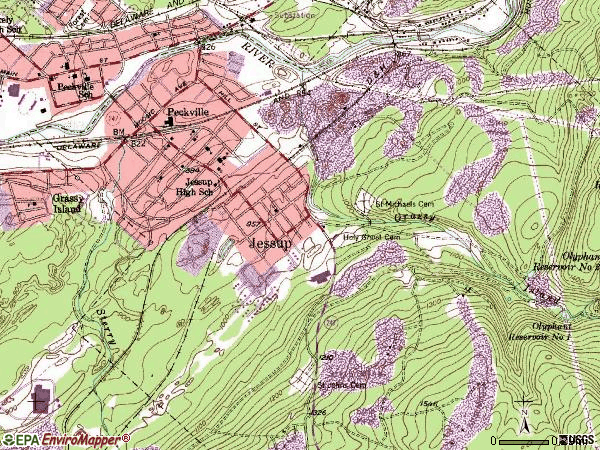
Notable locations in zip code 18434: Consumers Powder Companys Mill (A), S V White Colliery (B), Mount Jessup Colliery (C), Peckville Station (D), Jessup Hose Company 1 Station 25 (E), Pierce Breaker (F), Dolphs Breaker (G), Jessup Hose Company 2 and Ambulance Association Station 25 (H). Display/hide their locations on the map
Reservoirs: Olyphant Reservoir Number 3 (A), O'Conner Reservoir (B), Olyphant Reservoir Number 2 (C), Olyphant Reservoir Number 1 (D). Display/hide their locations on the map
In group quarters: 4 (-1 institutionalized population)
Size of family households: 570 2-persons, 221 3-persons, 155 4-persons, 163 5-persons, 14 6-persons
Size of nonfamily households: 525 1-person, 142 2-persons
287 married couples with children.
524 single-parent households (96 men, 428 women).
93.0% of residents of 18434 zip code speak English at home.
4.4% of residents speak Spanish at home (100% very well).
0.4% of residents speak other Indo-European language at home (100% very well).
1.2% of residents speak Asian or Pacific Island language at home (49% very well, 51% well).
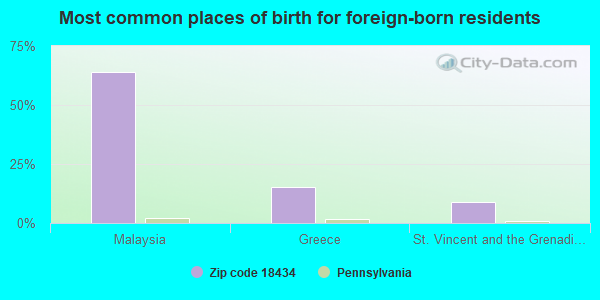
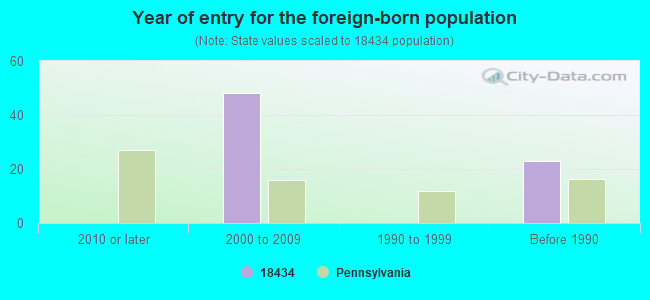
Foreign born population: 80 (2.0%) (100.0% of them are naturalized citizens)
This zip code:
2.0%
Whole state:
7.5%
64%Malaysia
15%Greece
9%St. Vincent and the Grenadines
28%Italian
27%Irish
9%German
8%Polish
5%English
4%American
3%Slovak
Year of entry for the foreign-born population
02010 or later
482000 to 2009
01990 to 1999
23Before 1990
Housing units lacking complete plumbing facilities: 4.2% Housing units lacking complete kitchen facilities: 6.5%
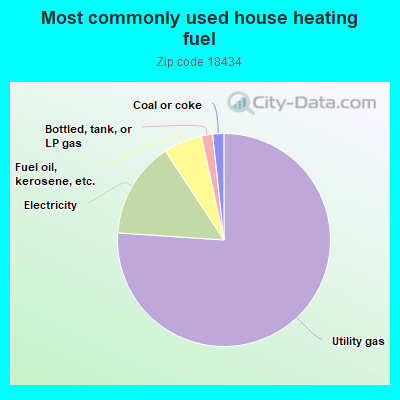
76.3%Utility gas
14.7%Electricity
5.9%Fuel oil, kerosene, etc.
1.7%Bottled, tank, or LP gas
1.7%Coal or coke
Population in 1990: 4,349.
Place of birth for U.S.-born residents:
This state: 3,565
Northeast: 209
Midwest: 1
South: 108
West: 36
78% of the 18434 zip code residents lived in the same house 5 years ago. Out of people who lived in different houses, 94% lived in this county. Out of people who lived in different counties, 50% lived in Pennsylvania.
90% of the 18434 zip code residents lived in the same house 1 year ago. Out of people who lived in different houses, 75% moved from this county. Out of people who lived in different houses, 14% moved from different county within same state. Out of people who lived in different houses, 9% moved from different state.
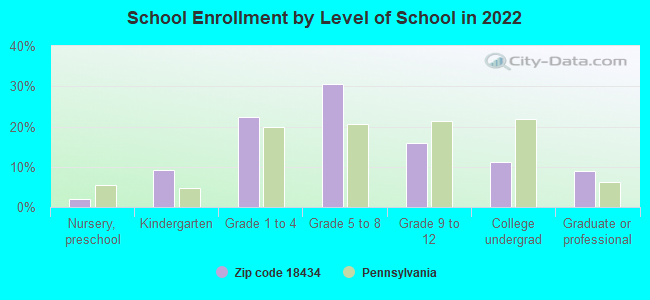
Private vs. public school enrollment:
Students in private schools in grades 1 to 8 (elementary and middle school): 74
Here:
16.4%
Pennsylvania:
15.7%
Students in private schools in grades 9 to 12 (high school): 84
Here:
59.6%
Pennsylvania:
13.4%
Students in private undergraduate colleges: 73
Here:
75.2%
Pennsylvania:
39.8%
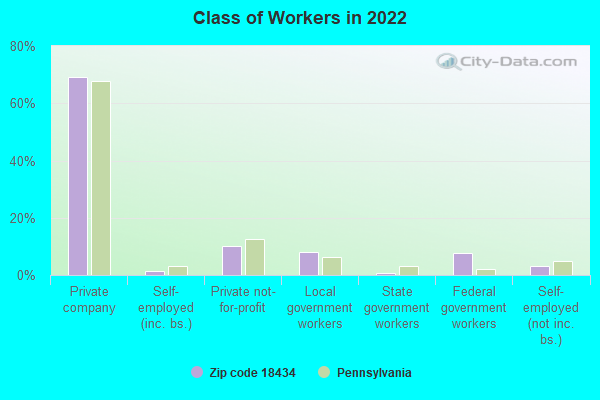
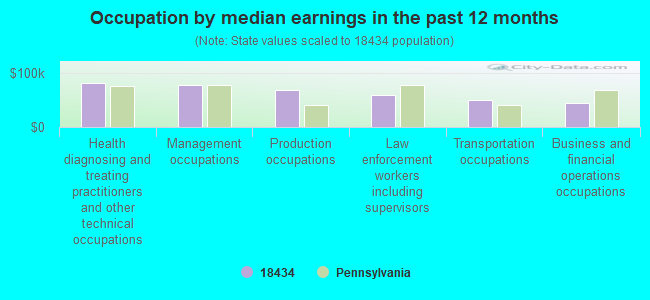
Occupation by median earnings in the past 12 months ($)
81,734Health diagnosing and treating practitioners and other technical occupations
78,904Management occupations
68,854Production occupations
59,887Law enforcement workers including supervisors
51,041Transportation occupations
45,424Business and financial operations occupations
Companies with federal contracts located in this zip code:
MATERIAL TECHNOLOGY & LOGISTIC (1325 MELLOW DR in JESSUP, PA; small business) : $1,136,031 in 17 contractsfrom 1999 to 2005
Contracts for Flags and Pennants, Badges and Insignia, Textile Fabrics, Hose, Pipe, Tube, Lubrication, and Railing Fittings by Defense Logistics Agency Signed by year:2000: $0; 2001: $243,000; 2002: $803,600; 2003: $0; 2004: $31,250; 2005: $33,180; 2006: $0.
Biggest contracts:
$90,000 with Defense Logistics Agency for Flags and Pennants. Signed on 2002-03-12. Completion date: 2002-05-10.
$90,000, same as above.Signed on 2002-03-06. Completion date: 2002-05-20.
$90,000, same as above.Signed on 2002-03-07. Completion date: 2002-05-20.
$84,000, same as above.Signed on 2002-07-10. Completion date: 2002-09-30.
PENA-PLAS COMPANY (1249 MID VALLEY DRIVE in JESSUP, PA; small business) : $8,149 in 2 contractsin 2005
$5,124 with Army for Pipe, Tube and Rigid Tubing. Signed on 2005-10-25. Completion date: 2005-11-03.
$3,025 with Army for Miscellaneous Items. Signed on 2005-02-15. Completion date: 2005-02-25.
SCRANTON COOPERAGE, INC (1264 MID VALLEY DR in JESSUP, PA; small business) : $1,800 in 3 contractsfrom 2003 to 2004
$1,200 with Army for Other Salvage Services. Signed on 2004-02-17. Completion date: 2004-05-12.
$600, same as above.Signed on 2003-06-02. Completion date: 2003-05-12.
$0, same as above.Signed on 2003-06-02. Completion date: 2003-05-12.
Top industries in this zip code by the number of employees in 2005:
Health Care and Social Assistance: Blood and Organ Banks (100-249 employees: 1 establishment)
Other Services (except Public Administration): Linen Supply (100-249: 1)
Construction: Plumbing, Heating, and Air-Conditioning Contractors (50-99: 1, 1-4: 1)
Wholesale Trade: Paint, Varnish, and Supplies Merchant Wholesalers (20-49: 1)
Construction: Water and Sewer Line and Related Structures Construction (20-49: 1)
People in group quarters in 2010:
2 people in other noninstitutional facilities
People in group quarters in 2000:
9 people in homes for the mentally retarded
3 people in religious group quarters
Fatal accident statistics in 2010:
Fatal accident count: 1
Vehicles involved in fatal accidents: 1
Fatal accidents caused by drunken drivers: 0
Fatalities: 1
Persons involved in fatal accidents: 1
Pedestrians involved in fatal accidents: 0
Home Mortgage Disclosure Act Aggregated Statistics For Year 2009 (Based on 2 partial tracts)
A) FHA, FSA/RHS & VA Home Purchase Loans
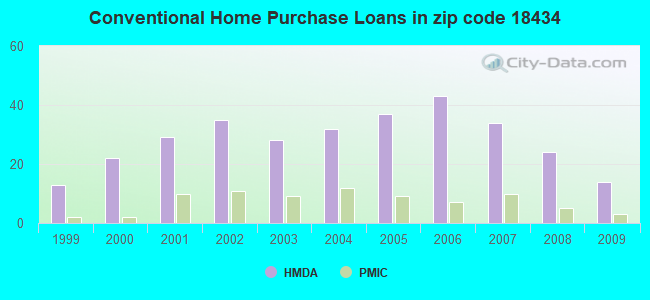
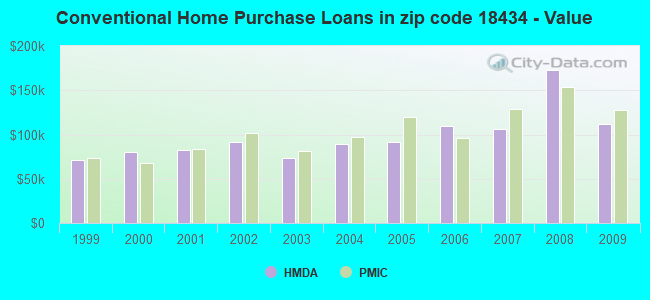
B) Conventional Home Purchase Loans
C) Refinancings
D) Home Improvement Loans
F) Non-occupant Loans on < 5 Family Dwellings (A B C & D)
Number
Average Value
Number
Average Value
Number
Average Value
Number
Average Value
Number
Average Value
LOANS ORIGINATED
16
$103,681
14
$112,087
58
$123,036
14
$49,508
6
$67,865
APPLICATIONS APPROVED, NOT ACCEPTED
0
$0
1
$72,770
3
$153,860
2
$37,115
0
$0
APPLICATIONS DENIED
0
$0
2
$151,040
20
$131,602
4
$9,370
0
$0
APPLICATIONS WITHDRAWN
2
$100,695
2
$124,580
22
$127,088
1
$122,010
1
$74,230
FILES CLOSED FOR INCOMPLETENESS
1
$99,960
0
$0
4
$101,430
0
$0
1
$79,380
Aggregated Statistics For Year 2008 (Based on 2 partial tracts)
A) FHA, FSA/RHS & VA Home Purchase Loans
B) Conventional Home Purchase Loans
C) Refinancings
D) Home Improvement Loans
E) Loans on Dwellings For 5+ Families
F) Non-occupant Loans on < 5 Family Dwellings (A B C & D)
Number
Average Value
Number
Average Value
Number
Average Value
Number
Average Value
Number
Average Value
Number
Average Value
LOANS ORIGINATED
4
$146,082
24
$172,848
40
$116,424
25
$29,282
1
$73,500
10
$96,138
APPLICATIONS APPROVED, NOT ACCEPTED
1
$82,320
1
$223,440
10
$92,389
2
$31,605
0
$0
1
$65,410
APPLICATIONS DENIED
2
$112,085
5
$245,932
30
$154,154
10
$148,470
0
$0
1
$154,350
APPLICATIONS WITHDRAWN
1
$83,790
4
$162,068
10
$114,587
1
$110,250
0
$0
1
$70,560
FILES CLOSED FOR INCOMPLETENESS
0
$0
0
$0
4
$142,590
0
$0
0
$0
0
$0
Aggregated Statistics For Year 2007 (Based on 2 partial tracts)
A) FHA, FSA/RHS & VA Home Purchase Loans
B) Conventional Home Purchase Loans
C) Refinancings
D) Home Improvement Loans
F) Non-occupant Loans on < 5 Family Dwellings (A B C & D)
Number
Average Value
Number
Average Value
Number
Average Value
Number
Average Value
Number
Average Value
LOANS ORIGINATED
4
$143,692
34
$105,883
46
$96,205
29
$37,054
7
$119,804
APPLICATIONS APPROVED, NOT ACCEPTED
0
$0
4
$80,298
7
$109,516
2
$53,290
1
$98,490
APPLICATIONS DENIED
1
$134,510
7
$129,884
47
$109,937
16
$58,249
11
$98,089
APPLICATIONS WITHDRAWN
1
$145,530
1
$233,730
18
$119,478
4
$27,012
2
$65,785
FILES CLOSED FOR INCOMPLETENESS
0
$0
1
$106,580
4
$118,152
1
$36,750
1
$33,080
Aggregated Statistics For Year 2006 (Based on 2 partial tracts)
A) FHA, FSA/RHS & VA Home Purchase Loans
B) Conventional Home Purchase Loans
C) Refinancings
D) Home Improvement Loans
F) Non-occupant Loans on < 5 Family Dwellings (A B C & D)
G) Loans On Manufactured Home Dwelling (A B C & D)
Number
Average Value
Number
Average Value
Number
Average Value
Number
Average Value
Number
Average Value
Number
Average Value
LOANS ORIGINATED
1
$86,730
43
$109,806
60
$85,297
26
$29,852
13
$79,323
1
$31,610
APPLICATIONS APPROVED, NOT ACCEPTED
0
$0
7
$81,164
15
$69,923
7
$62,790
5
$63,944
0
$0
APPLICATIONS DENIED
0
$0
7
$127,996
71
$229,682
14
$47,723
4
$94,080
0
$0
APPLICATIONS WITHDRAWN
1
$76,440
5
$66,886
34
$95,745
2
$48,875
3
$64,680
0
$0
FILES CLOSED FOR INCOMPLETENESS
0
$0
2
$91,140
5
$94,522
0
$0
0
$0
0
$0
Aggregated Statistics For Year 2005 (Based on 2 partial tracts)
A) FHA, FSA/RHS & VA Home Purchase Loans
B) Conventional Home Purchase Loans
C) Refinancings
D) Home Improvement Loans
F) Non-occupant Loans on < 5 Family Dwellings (A B C & D)
G) Loans On Manufactured Home Dwelling (A B C & D)
Number
Average Value
Number
Average Value
Number
Average Value
Number
Average Value
Number
Average Value
Number
Average Value
LOANS ORIGINATED
2
$82,690
37
$91,915
65
$90,009
20
$34,214
10
$68,943
1
$50,710
APPLICATIONS APPROVED, NOT ACCEPTED
0
$0
5
$80,850
12
$103,268
1
$30,870
1
$30,870
0
$0
APPLICATIONS DENIED
0
$0
11
$75,839
49
$97,365
7
$47,144
4
$141,855
0
$0
APPLICATIONS WITHDRAWN
0
$0
7
$108,044
40
$114,421
4
$125,132
2
$138,180
0
$0
FILES CLOSED FOR INCOMPLETENESS
0
$0
2
$121,275
4
$135,058
0
$0
0
$0
0
$0
Aggregated Statistics For Year 2004 (Based on 2 partial tracts)
A) FHA, FSA/RHS & VA Home Purchase Loans
B) Conventional Home Purchase Loans
C) Refinancings
D) Home Improvement Loans
E) Loans on Dwellings For 5+ Families
F) Non-occupant Loans on < 5 Family Dwellings (A B C & D)
Number
Average Value
Number
Average Value
Number
Average Value
Number
Average Value
Number
Average Value
Number
Average Value
LOANS ORIGINATED
4
$72,765
32
$89,716
72
$80,166
23
$25,789
0
$0
10
$63,137
APPLICATIONS APPROVED, NOT ACCEPTED
0
$0
5
$71,884
9
$79,380
1
$83,050
0
$0
3
$60,760
APPLICATIONS DENIED
0
$0
6
$80,238
32
$81,218
7
$39,584
0
$0
3
$77,910
APPLICATIONS WITHDRAWN
1
$66,150
4
$53,288
19
$77,136
3
$55,617
1
$191,840
0
$0
FILES CLOSED FOR INCOMPLETENESS
0
$0
2
$76,810
3
$68,847
0
$0
0
$0
1
$38,950
Aggregated Statistics For Year 2003 (Based on 2 partial tracts)
A) FHA, FSA/RHS & VA Home Purchase Loans
B) Conventional Home Purchase Loans
C) Refinancings
D) Home Improvement Loans
F) Non-occupant Loans on < 5 Family Dwellings (A B C & D)
Number
Average Value
Number
Average Value
Number
Average Value
Number
Average Value
Number
Average Value
LOANS ORIGINATED
5
$95,256
28
$73,999
139
$79,047
21
$25,550
12
$60,332
APPLICATIONS APPROVED, NOT ACCEPTED
0
$0
2
$83,425
20
$85,444
3
$21,560
1
$56,590
APPLICATIONS DENIED
0
$0
5
$75,412
46
$79,987
5
$42,630
2
$55,495
APPLICATIONS WITHDRAWN
0
$0
1
$47,770
25
$75,294
0
$0
0
$0
FILES CLOSED FOR INCOMPLETENESS
0
$0
0
$0
3
$136,463
1
$14,700
0
$0
Aggregated Statistics For Year 2002 (Based on 2 partial tracts)
A) FHA, FSA/RHS & VA Home Purchase Loans
B) Conventional Home Purchase Loans
C) Refinancings
D) Home Improvement Loans
F) Non-occupant Loans on < 5 Family Dwellings (A B C & D)
Number
Average Value
Number
Average Value
Number
Average Value
Number
Average Value
Number
Average Value
LOANS ORIGINATED
5
$77,764
35
$91,371
94
$78,536
12
$47,469
9
$56,104
APPLICATIONS APPROVED, NOT ACCEPTED
0
$0
3
$49,243
12
$82,259
1
$14,700
1
$26,460
APPLICATIONS DENIED
0
$0
4
$59,168
44
$75,120
7
$14,280
1
$158,030
APPLICATIONS WITHDRAWN
0
$0
2
$91,140
22
$89,002
1
$7,350
1
$99,220
FILES CLOSED FOR INCOMPLETENESS
0
$0
1
$51,450
6
$109,760
0
$0
1
$67,620
Aggregated Statistics For Year 2001 (Based on 2 partial tracts)
A) FHA, FSA/RHS & VA Home Purchase Loans
B) Conventional Home Purchase Loans
C) Refinancings
D) Home Improvement Loans
F) Non-occupant Loans on < 5 Family Dwellings (A B C & D)
Number
Average Value
Number
Average Value
Number
Average Value
Number
Average Value
Number
Average Value
LOANS ORIGINATED
4
$79,195
29
$82,269
62
$67,632
17
$21,099
7
$53,026
APPLICATIONS APPROVED, NOT ACCEPTED
1
$49,240
4
$43,548
18
$82,688
2
$30,500
1
$113,930
APPLICATIONS DENIED
0
$0
12
$64,558
35
$73,122
7
$16,486
3
$72,030
APPLICATIONS WITHDRAWN
0
$0
2
$76,075
24
$82,136
1
$11,030
0
$0
FILES CLOSED FOR INCOMPLETENESS
0
$0
1
$37,480
1
$88,200
0
$0
0
$0
Aggregated Statistics For Year 2000 (Based on 2 partial tracts)
A) FHA, FSA/RHS & VA Home Purchase Loans
B) Conventional Home Purchase Loans
C) Refinancings
D) Home Improvement Loans
F) Non-occupant Loans on < 5 Family Dwellings (A B C & D)
Number
Average Value
Number
Average Value
Number
Average Value
Number
Average Value
Number
Average Value
LOANS ORIGINATED
3
$69,580
22
$79,881
35
$68,922
25
$17,875
3
$48,020
APPLICATIONS APPROVED, NOT ACCEPTED
1
$87,470
4
$37,670
8
$85,076
1
$15,440
0
$0
APPLICATIONS DENIED
0
$0
10
$37,852
30
$56,644
4
$37,852
0
$0
APPLICATIONS WITHDRAWN
0
$0
3
$56,840
15
$63,357
1
$3,670
0
$0
FILES CLOSED FOR INCOMPLETENESS
0
$0
0
$0
1
$243,290
0
$0
0
$0
Aggregated Statistics For Year 1999 (Based on 1 partial tract)
A) FHA, FSA/RHS & VA Home Purchase Loans
B) Conventional Home Purchase Loans
C) Refinancings
D) Home Improvement Loans
F) Non-occupant Loans on < 5 Family Dwellings (A B C & D)
Detailed PMIC statistics for the following Tracts:1113.00
2003 - 2018 National Fire Incident Reporting System (NFIRS) incidents
Based on the data from the years 2003 - 2018 the average number of fires per year is 11. The highest number of fire incidents - 55 took place in 2017, and the least - 0 in 2004. The data has a rising trend.
When looking into fire subcategories, the most reports belonged to: Outside Fires (41.3%), and Structure Fires (37.4%).
Fire incident types reported to NFIRS in Zip Code 18434
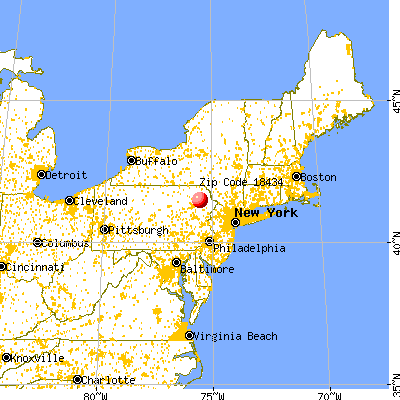


 Nearest zip codes: 18403, 18452, 18512, 18447, 18519, 18509.


 : $1,136,031 in 17 contracts from 1999 to 2005
 Based on the data from the years 2003 - 2018 the average number of fires per year is 11. The highest number of fire incidents - 55 took place in 2017, and the least - 0 in 2004. The data has a rising trend.
 When looking into fire subcategories, the most reports belonged to: Outside Fires (41.3%), and Structure Fires (37.4%).