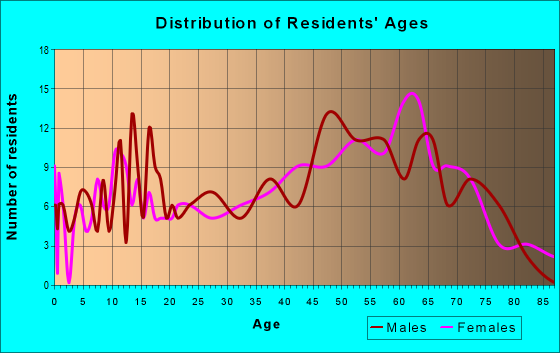
Estimated zip code population in 2022: 1,244 Zip code population in 2010: 1,340 Zip code population in 2000: 1,451
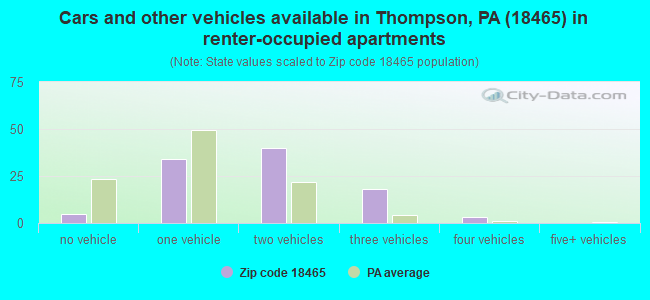
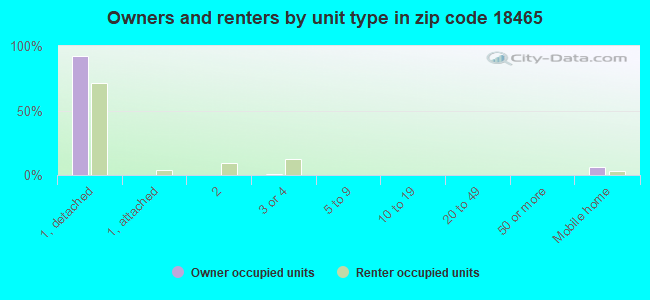
Houses and condos: 1,065 Renter-occupied apartments: 100
% of renters here:
20%
State:
31%
March 2022 cost of living index in zip code 18465: 93.4 (less than average, U.S. average is 100)
Land area: 47.1 sq. mi. Water area: 1.2 sq. mi.
Population density: 26 people per square mile
(very low).
OSM Map
General Map
Google Map
MSN Map
OSM Map
General Map
Google Map
MSN Map
OSM Map
General Map
Google Map
MSN Map
OSM Map
General Map
Google Map
MSN Map
Please wait while loading the map...
Real estate property taxes paid for housing units in 2022:
This zip code:
1.0% ($2,407)
Pennsylvania:
1.3% ($3,094)
Median real estate property taxes paid for housing units with mortgages in 2022: $2,183 (0.9%) Median real estate property taxes paid for housing units with no mortgage in 2022: $2,553 (1.1%)
Business Search- 14 Million verified businesses
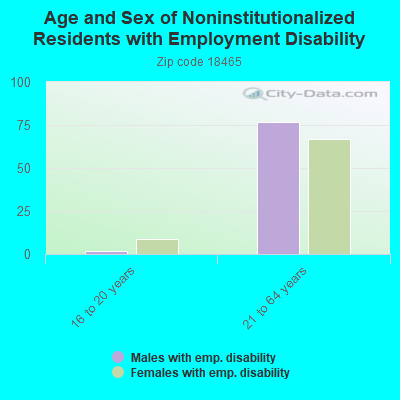
Males: 674
(54.2%)
Females: 569
(45.8%)
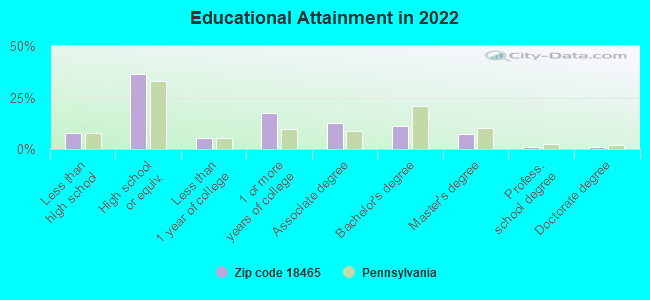
For population 25 years and over in 18465:
High school or higher: 90.7%
Bachelor's degree or higher: 20.3%
Graduate or professional degree: 9.5%
Unemployed: 4.6%
Mean travel time to work (commute): 31.9 minutes
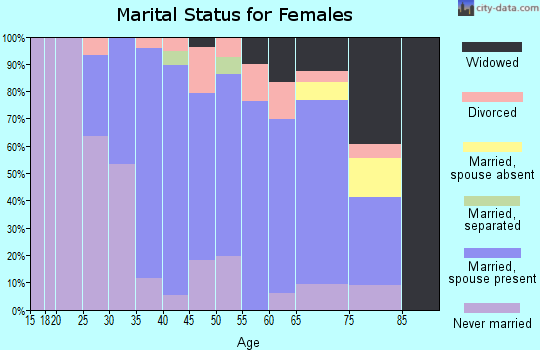
For population 15 years and over in 18465:
Never married: 22.0%
Now married: 55.2%
Separated: 1.6%
Widowed: 8.4%
Divorced: 12.9%
Zip code 18465 compared to state average:
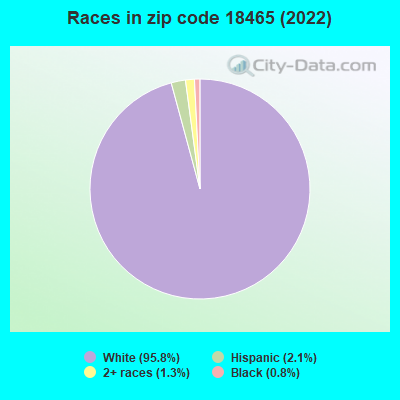
Black race population percentage significantly below state average.
Hispanic race population percentage significantly below state average.
Median age above state average.
Foreign-born population percentage significantly below state average.
Renting percentage below state average.
Length of stay since moving in significantly above state average.
Number of college students below state average.
Percentage of population with a bachelor's degree or higher below state average.
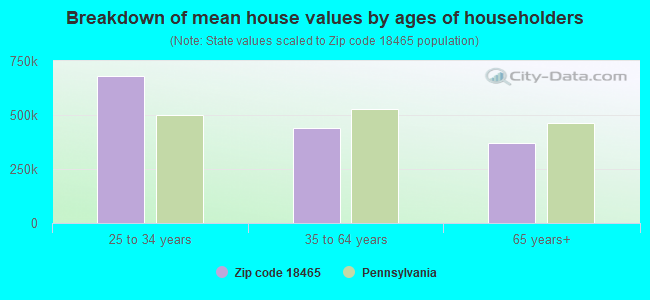
Estimated median house/condo value in 2022: $235,406
18465:
$235,406
Pennsylvania:
$245,500
According to our research of Pennsylvania and other state lists, there was 1 registered sex offender living in 18465 zip code as of May 20, 2024. The ratio of all residents to sex offenders in zip code 18465 is 1,358 to 1. The ratio of registered sex offenders to all residents in this zip code is lower than the state average.
Median resident age:
This zip code:
47.0 years
Pennsylvania median age:
40.9 years
Average household size:
This zip code:
2.5 people
Pennsylvania:
2.4 people
Averages for the 2020 tax year for zip code 18465, filed in 2021:
Average Adjusted Gross Income (AGI) in 2020: $56,213 (Individual Income Tax Returns)
Here:
$56,213
State:
$75,707
Salary/wage: $44,317 (reported on 75.4% of returns)
Here:
$44,317
State:
$62,806
(% of AGI for various income ranges: 860.7% for AGIs below $25k, 3212.3% for AGIs $25k-50k, 6046.2% for AGIs $50k-75k, 8506.0% for AGIs $75k-100k, 17148.0% for AGIs $100k-200k)
Taxable interest for individuals: $832 (reported on 31.9% of returns)
This zip code:
$832
Pennsylvania:
$1,633
(% of AGI for various income ranges: 11.4% for AGIs below $25k, 30.0% for AGIs $25k-50k, 56.2% for AGIs $50k-75k, 66.0% for AGIs $75k-100k, 100.0% for AGIs $100k-200k)
Ordinary dividends: $3,779 (reported on 20.3% of returns)
Here:
$3,779
State:
$7,382
(% of AGI for various income ranges: 10.7% for AGIs below $25k, 43.8% for AGIs $25k-50k, 116.3% for AGIs $50k-75k, 728.0% for AGIs $100k-200k)
Net capital gain/loss in AGI: +$6,162 (reported on 18.8% of returns)
Here:
+$6,162
State:
+$23,522
(% of AGI for various income ranges: 4.3% for AGIs below $25k, 40.0% for AGIs $25k-50k, 255.0% for AGIs $50k-75k, 1078.0% for AGIs $100k-200k)
Profit/loss from business: +$9,209 (reported on 15.9% of returns)
Here:
+$9,209
State:
+$16,274
(% of AGI for various income ranges: 128.6% for AGIs below $25k, 205.4% for AGIs $25k-50k, 306.2% for AGIs $50k-75k, 642.0% for AGIs $100k-200k)
Taxable individual retirement arrangement distribution: $17,088 (reported on 11.6% of returns)
18465:
$17,088
Pennsylvania:
$18,583
(% of AGI for various income ranges: 212.3% for AGIs $25k-50k, 610.0% for AGIs $50k-75k, 1206.0% for AGIs $100k-200k)
Total itemized deductions: $22,600 (reported on 4.3% of returns)
Here:
$22,600
State:
$34,850
(% of AGI for various income ranges: 1356.0% for AGIs $75k-100k)
Taxes paid: $8,400 (reported on 4.3% of returns)
18465:
$8,400
State:
$8,200
(% of AGI for various income ranges: 504.0% for AGIs $75k-100k)
Earned income credit: $1,870 (reported on 14.5% of returns)
Here:
$1,870
State:
$2,100
(% of AGI for various income ranges: 75.7% for AGIs below $25k, 62.3% for AGIs $25k-50k)
Percentage of individuals using paid preparers for their 2020 taxes: 92.8%
Here:
93%
State:
92%
(% for various income ranges: 90.9% for AGIs below $25k, 94.4% for AGIs $25k-50k, 100.0% for AGIs $50k-75k, 87.5% for AGIs $75k-100k, 90.0% for AGIs $100k-200k)
Averages for the 2012 tax year for zip code 18465, filed in 2013:
Average Adjusted Gross Income (AGI) in 2012: $44,690 (Individual Income Tax Returns)
Here:
$44,690
State:
$61,346
Salary/wage: $35,161 (reported on 74.2% of returns)
Here:
$35,161
State:
$51,902
(% of AGI for various income ranges: 61.3% for AGIs below $25k, 68.4% for AGIs $25k-50k, 68.9% for AGIs $50k-75k, 53.2% for AGIs $75k-100k, 43.8% for AGIs $100k-200k)
Taxable interest for individuals: $1,652 (reported on 40.3% of returns)
This zip code:
$1,652
Pennsylvania:
$1,588
(% of AGI for various income ranges: 3.6% for AGIs below $25k, 1.9% for AGIs $25k-50k, 0.3% for AGIs $50k-75k, 1.4% for AGIs $75k-100k, 1.4% for AGIs $100k-200k)
Ordinary dividends: $2,694 (reported on 27.4% of returns)
Here:
$2,694
State:
$5,827
(% of AGI for various income ranges: 1.3% for AGIs below $25k, 1.4% for AGIs $25k-50k, 1.2% for AGIs $50k-75k, 1.2% for AGIs $75k-100k, 2.6% for AGIs $100k-200k)
Net capital gain/loss in AGI: +$3,591 (reported on 17.7% of returns)
Here:
+$3,591
State:
+$14,495
(% of AGI for various income ranges: 0.9% for AGIs $50k-75k, 7.2% for AGIs $75k-100k)
Profit/loss from business: +$9,140 (reported on 16.1% of returns)
Here:
+$9,140
State:
+$16,268
(% of AGI for various income ranges: 4.9% for AGIs below $25k, 4.4% for AGIs $25k-50k, 7.8% for AGIs $50k-75k)
Taxable individual retirement arrangement distribution: $8,133 (reported on 14.5% of returns)
18465:
$8,133
Pennsylvania:
$14,550
Total itemized deductions: $17,893 (21% of AGI, reported on 22.6% of returns)
Here:
$17,893
State:
$23,538
Here:
20.9% of AGI
State:
18.4% of AGI
(% of AGI for various income ranges: 15.7% for AGIs below $25k, 7.0% for AGIs $25k-50k, 9.1% for AGIs $50k-75k, 8.1% for AGIs $75k-100k, 8.5% for AGIs $100k-200k)
Charity contributions: $1,900 (reported on 16.1% of returns)
Here:
$1,900
State:
$4,025
(% of AGI for various income ranges: 1.3% for AGIs below $25k, 1.1% for AGIs $50k-75k, 1.1% for AGIs $100k-200k)
Taxes paid: $6,114 (reported on 22.6% of returns)
18465:
$6,114
State:
$9,982
(% of AGI for various income ranges: 1.5% for AGIs below $25k, 2.0% for AGIs $25k-50k, 3.4% for AGIs $50k-75k, 2.9% for AGIs $75k-100k, 4.4% for AGIs $100k-200k)
Earned income credit: $1,730 (reported on 16.1% of returns)
Here:
$1,730
State:
$2,106
(% of AGI for various income ranges: 4.3% for AGIs below $25k, 0.8% for AGIs $25k-50k)
Percentage of individuals using paid preparers for their 2012 taxes: 64.5%
Here:
65%
State:
53%
(% for various income ranges: 57.7% for AGIs below $25k, 60.0% for AGIs $25k-50k, 72.7% for AGIs $50k-75k, 83.3% for AGIs $75k-100k, 75.0% for AGIs $100k-200k)
Averages for the 2004 tax year for zip code 18465, filed in 2005:
Average Adjusted Gross Income (AGI) in 2004: $38,063 (Individual Income Tax Returns)
Here:
$38,063
State:
$48,049
Salary/wage: $31,079 (reported on 77.3% of returns)
Here:
$31,079
State:
$42,646
(% of AGI for various income ranges: 70.5% for AGIs below $10k, 66.6% for AGIs $10k-25k, 72.6% for AGIs $25k-50k, 75.2% for AGIs $50k-75k, 72.3% for AGIs $75k-100k, 32.8% for AGIs over 100k)
Taxable interest for individuals: $1,683 (reported on 47.5% of returns)
This zip code:
$1,683
Pennsylvania:
$1,657
(% of AGI for various income ranges: 9.3% for AGIs below $10k, 3.5% for AGIs $10k-25k, 0.7% for AGIs $25k-50k, 1.9% for AGIs $50k-75k, 1.3% for AGIs $75k-100k, 2.6% for AGIs over 100k)
Taxable dividends: $1,032 (reported on 25.5% of returns)
Here:
$1,032
State:
$3,566
(% of AGI for various income ranges: 3.1% for AGIs below $10k, 1.6% for AGIs $10k-25k, 0.6% for AGIs $25k-50k, 0.2% for AGIs $50k-75k, 0.7% for AGIs $75k-100k, 0.5% for AGIs over 100k)
Net capital gain/loss: +$1,361 (reported on 19.7% of returns)
Here:
+$1,361
State:
+$9,716
(% of AGI for various income ranges: -2.0% for AGIs below $10k, 0.3% for AGIs $10k-25k, 0.6% for AGIs $25k-50k, 1.3% for AGIs $50k-75k, -0.3% for AGIs $75k-100k, 1.3% for AGIs over 100k)
Profit/loss from business: +$5,590 (reported on 16.6% of returns)
Here:
+$5,590
State:
+$14,267
(% of AGI for various income ranges: 5.2% for AGIs below $10k, 8.7% for AGIs $10k-25k, 6.6% for AGIs $25k-50k, -2.0% for AGIs $50k-75k, 0.6% for AGIs $75k-100k)
IRA payment deduction: $1,737 (reported on 3.1% of returns)
18465:
$1,737
Pennsylvania:
$2,903
Total itemized deductions: $15,762 (20% of AGI, reported on 21.5% of returns)
Here:
$15,762
State:
$18,804
Here:
19.7% of AGI
State:
19.5% of AGI
(% of AGI for various income ranges: 9.4% for AGIs $10k-25k, 6.5% for AGIs $25k-50k, 10.5% for AGIs $50k-75k, 11.3% for AGIs $75k-100k, 9.4% for AGIs over 100k)
Charity contributions deductions: $2,176 (2% of AGI, reported on 17.9% of returns)
Here:
$2,176
State:
$3,337
Here:
2.4% of AGI
State:
3.3% of AGI
(% of AGI for various income ranges: 1.8% for AGIs below $10k, 0.5% for AGIs $25k-50k, 0.8% for AGIs $50k-75k, 1.1% for AGIs $75k-100k, 2.1% for AGIs over 100k)
Total tax: $5,709 (reported on 74.5% of returns)
18465:
$5,709
State:
$8,008
(% of AGI for various income ranges: 3.7% for AGIs below $10k, 4.7% for AGIs $10k-25k, 7.0% for AGIs $25k-50k, 8.5% for AGIs $50k-75k, 11.6% for AGIs $75k-100k, 22.3% for AGIs over 100k)
Earned income credit: $1,620 (reported on 16.6% of returns)
Here:
$1,620
State:
$1,643
Percentage of individuals using paid preparers for their 2004 taxes: 63.7%
Here:
64%
State:
56%
(% for various income ranges: 56.6% for AGIs below $10k, 64.0% for AGIs $10k-25k, 66.9% for AGIs $25k-50k, 66.7% for AGIs $50k-75k, 59.5% for AGIs $75k-100k, 78.3% for AGIs over 100k)
Household received Food Stamps/SNAP in the past 12 months: 51 Household did not receive Food Stamps/SNAP in the past 12 months: 436
Women who had a birth in the past 12 months: 28 (26 now married, 3 unmarried) Women who did not have a birth in the past 12 months: 187 (86 now married, 99 unmarried)
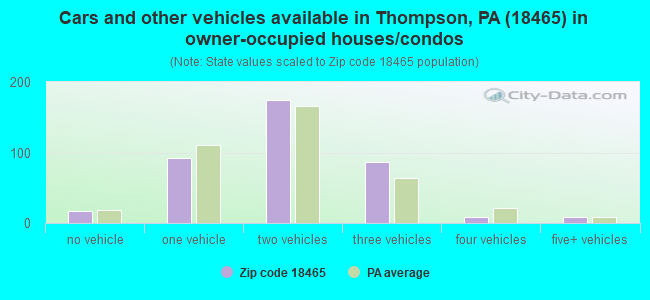
Housing units in zip code 18465 with a mortgage: 181 (8 second mortgage, 8 both second mortgage and home equity loan) Houses without a mortgage: 9
Median monthly owner costs for units with a mortgage: $1,354 Median monthly owner costs for units without a mortgage: $613
Residents with income below the poverty level in 2022:
This zip code:
15.3%
Whole state:
11.8%
Residents with income below 50% of the poverty level in 2022:
This zip code:
4.7%
Whole state:
6.1%
Median number of rooms in houses and condos:
Here:
6.4
State:
6.8
Median number of rooms in apartments:
Here:
5.7
State:
4.3
Notable locations in this zip code not listed on our city pages
Lakes, reservoirs, and swamps: Sinkhole Swamp (A), Mud Pond (B), Coxton Lake (C), Roberts Pond (D), Romobe Lake (E), Fiddle Lake (F), Dunn Pond (G), Lake White Lark (H). Display/hide their locations on the map
Size of family households: 167 2-persons, 76 3-persons, 44 4-persons, 17 5-persons, 20 6-persons, 1 7-or-more-persons
Size of nonfamily households: 126 1-person, 32 2-persons, 1 4-persons
118 married couples with children.
103 single-parent households (45 men, 58 women).
97.0% of residents of 18465 zip code speak English at home.
1.5% of residents speak Spanish at home (76% very well, 24% not well).
1.0% of residents speak other Indo-European language at home (91% very well, 9% well).
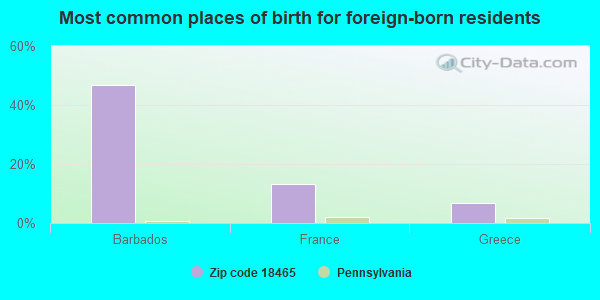
Foreign born population: 15 (1.3%) (80.6% of them are naturalized citizens)
This zip code:
1.3%
Whole state:
7.5%
47%Barbados
13%France
7%Greece
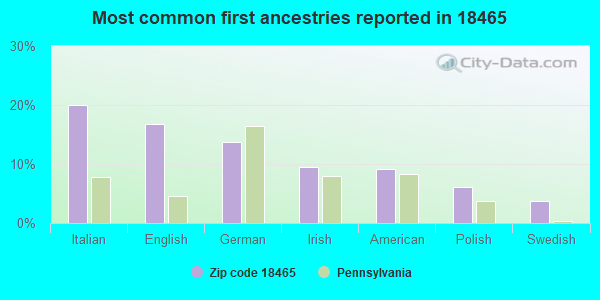
20%Italian
17%English
14%German
10%Irish
9%American
6%Polish
4%Swedish
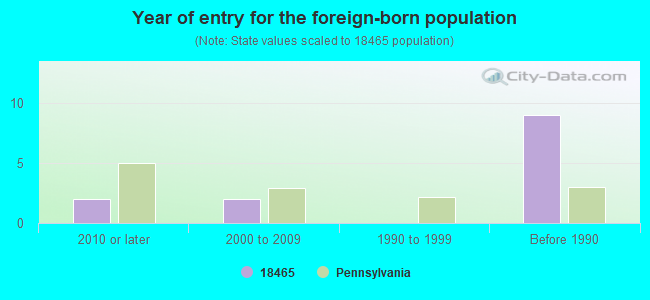
Year of entry for the foreign-born population
22010 or later
22000 to 2009
01990 to 1999
9Before 1990
Facilities with environmental interests located in this zip code:
ARARAT TWP (RR 1 in THOMPSON, PA)
National Pollutant Discharge Elimination System NON-MAJOR (Tracking pollutant discharge elimination systems) - permit Business SIC classification: SEWERAGE SYSTEMS Alternative names: ARARAT TWP SUPERVISORS
Housing units lacking complete plumbing facilities: 2.6% Housing units lacking complete kitchen facilities: 4.1%
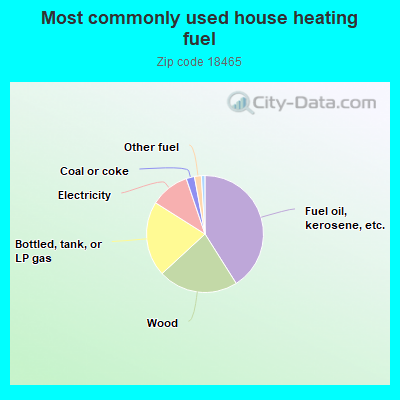
41.2%Fuel oil, kerosene, etc.
22.2%Wood
20.9%Bottled, tank, or LP gas
10.9%Electricity
2.3%Coal or coke
1.9%Other fuel
1.0%Utility gas
Population in 1990: 1,277. Population change in the 1990s: +174 (+13.6%).
Place of birth for U.S.-born residents:
This state: 648
Northeast: 490
Midwest: 3
South: 62
West: 34
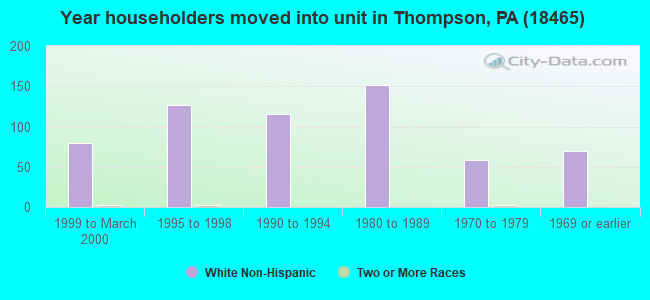
74% of the 18465 zip code residents lived in the same house 5 years ago. Out of people who lived in different houses, 51% lived in this county. Out of people who lived in different counties, 50% lived in Pennsylvania.
91% of the 18465 zip code residents lived in the same house 1 year ago. Out of people who lived in different houses, 38% moved from this county. Out of people who lived in different houses, 30% moved from different county within same state. Out of people who lived in different houses, 30% moved from different state. Out of people who lived in different houses, 1% moved from abroad.
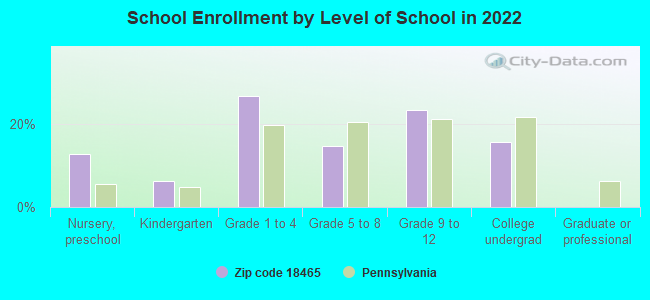
Private vs. public school enrollment:
Students in private schools in grades 1 to 8 (elementary and middle school): 2
Here:
2.5%
Pennsylvania:
15.7%
Students in private schools in grades 9 to 12 (high school): 1
Here:
2.2%
Pennsylvania:
13.4%
Students in private undergraduate colleges: 2
Here:
9.0%
Pennsylvania:
39.8%
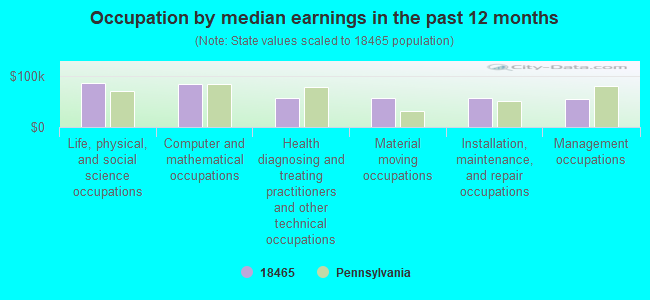
Occupation by median earnings in the past 12 months ($)
86,456Life, physical, and social science occupations
83,870Computer and mathematical occupations
57,767Health diagnosing and treating practitioners and other technical occupations
56,662Material moving occupations
56,232Installation, maintenance, and repair occupations
54,459Management occupations
Top industries in this zip code by the number of employees in 2005:
Wholesale Trade: Other Construction Material Merchant Wholesalers (10-19 employees: 1 establishment)
Construction: Site Preparation Contractors (5-9: 1, 1-4: 1)
Administrative and Support and Waste Management and Remediation Services: Solid Waste Collection (5-9: 1)
Construction: Electrical Contractors (5-9: 1)
Accommodation and Food Services: Recreational and Vacation Camps (except Campgrounds) (1-4: 2)
Health Care and Social Assistance: Services for the Elderly and Persons with Disabilities (1-4: 2)
Construction: New Single-Family Housing Construction (except Operative Builders) (1-4: 1)
Other Services (except Public Administration): Religious Organizations (1-4: 1)
Fatal accident statistics in 2010:
Fatal accident count: 1
Vehicles involved in fatal accidents: 2
Fatal accidents caused by drunken drivers: 0
Fatalities: 1
Persons involved in fatal accidents: 2
Pedestrians involved in fatal accidents: 0
Most common first names in zip code 18465 among deceased individuals
Name
Count
Lived (average)
Mary
13
75.6 years
Joseph
12
75.7 years
William
11
80.5 years
John
9
70.8 years
Helen
9
81.8 years
George
9
74.9 years
Raymond
8
68.4 years
Harry
7
80.0 years
Harold
7
75.2 years
Edward
7
69.1 years
Most common last names in zip code 18465 among deceased individuals
Last name
Count
Lived (average)
Smith
10
81.2 years
Thorn
7
77.1 years
Slocum
6
75.5 years
Williams
6
82.3 years
Potter
6
72.8 years
Lamb
5
85.8 years
Markovitch
5
86.6 years
Avery
5
83.0 years
Burman
4
70.0 years
Walker
4
89.0 years
Businesses in zip code 18465
U-Haul: 1
Discuss Thompson, Pennsylvania (PA) on our hugely popular Pennsylvania forum.
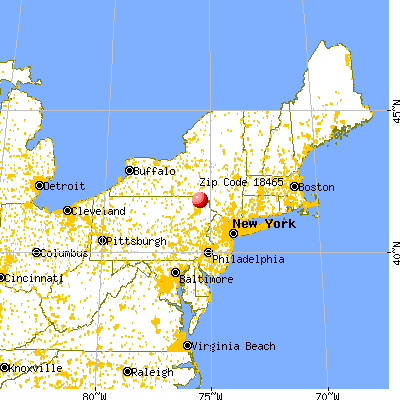


 Nearest zip codes: 18430, 18454, 18825, 18470, 18847, 18842.