Estimated zip code population in 2022: 3,562 Zip code population in 2010: 3,881 Zip code population in 2000: 3,831
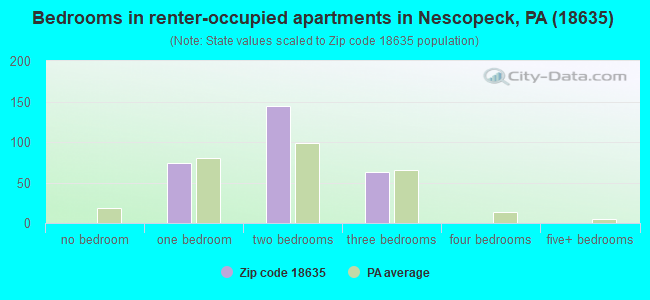
Houses and condos: 1,714 Renter-occupied apartments: 282
% of renters here:
18%
State:
31%
March 2022 cost of living index in zip code 18635: 92.1 (less than average, U.S. average is 100)
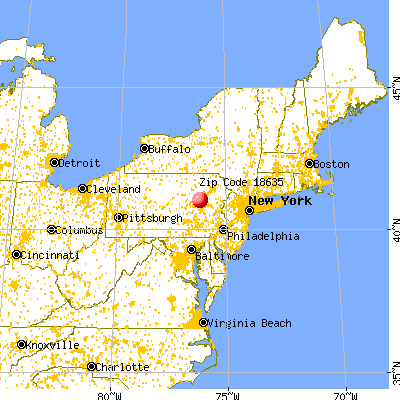
Land area: 38.2 sq. mi. Water area: 0.5 sq. mi.
Population density: 93 people per square mile
(very low).
OSM Map
General Map
Google Map
MSN Map
OSM Map
General Map
Google Map
MSN Map
OSM Map
General Map
Google Map
MSN Map
OSM Map
General Map
Google Map
MSN Map
Please wait while loading the map...
Real estate property taxes paid for housing units in 2022:
This zip code:
1.0% ($2,094)
Pennsylvania:
1.3% ($3,094)
Median real estate property taxes paid for housing units with mortgages in 2022: $2,281 (1.1%) Median real estate property taxes paid for housing units with no mortgage in 2022: $1,891 (1.0%)
Business Search- 14 Million verified businesses
Males: 1,836
(51.6%)
Females: 1,725
(48.4%)
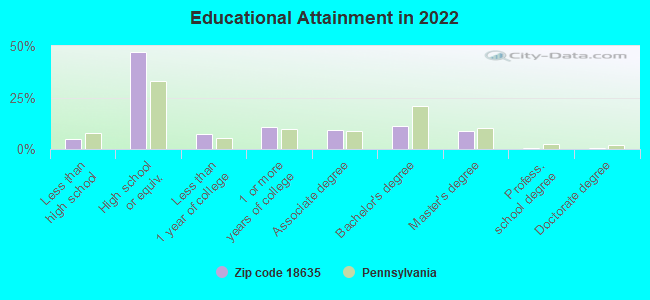
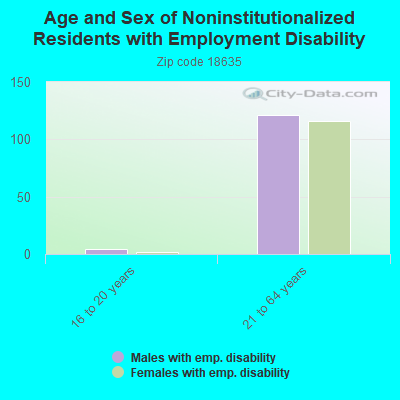
For population 25 years and over in 18635:
High school or higher: 94.4%
Bachelor's degree or higher: 20.6%
Graduate or professional degree: 9.5%
Unemployed: 2.9%
Mean travel time to work (commute): 24.5 minutes
For population 15 years and over in 18635:
Never married: 21.5%
Now married: 59.9%
Separated: 1.5%
Widowed: 7.6%
Divorced: 9.6%
Zip code 18635 compared to state average:
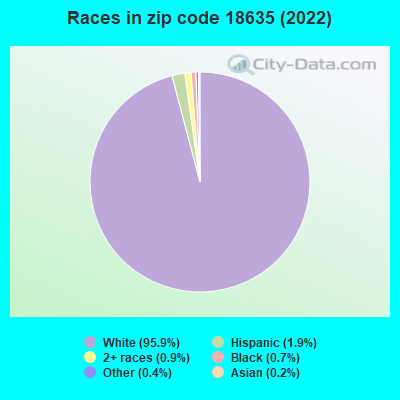
Black race population percentage significantly below state average.
Hispanic race population percentage significantly below state average.
Median age above state average.
Foreign-born population percentage significantly below state average.
Renting percentage below state average.
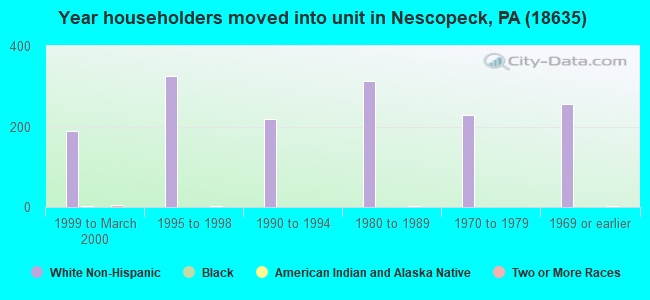
Length of stay since moving in significantly above state average.
Percentage of population with a bachelor's degree or higher below state average.
Averages for the 2020 tax year for zip code 18635, filed in 2021:
Average Adjusted Gross Income (AGI) in 2020: $57,314 (Individual Income Tax Returns)
Here:
$57,314
State:
$75,707
Salary/wage: $51,279 (reported on 82.8% of returns)
Here:
$51,279
State:
$62,806
(% of AGI for various income ranges: 1035.1% for AGIs below $25k, 3528.3% for AGIs $25k-50k, 6088.0% for AGIs $50k-75k, 9252.1% for AGIs $75k-100k, 15587.8% for AGIs $100k-200k, 53240.0% for AGIs over 200k)
Taxable interest for individuals: $576 (reported on 30.5% of returns)
This zip code:
$576
Pennsylvania:
$1,633
(% of AGI for various income ranges: 17.2% for AGIs below $25k, 17.1% for AGIs $25k-50k, 16.0% for AGIs $50k-75k, 32.9% for AGIs $75k-100k, 48.9% for AGIs $100k-200k, 185.0% for AGIs over 200k)
Ordinary dividends: $2,612 (reported on 21.2% of returns)
Here:
$2,612
State:
$7,382
(% of AGI for various income ranges: 30.5% for AGIs below $25k, 48.1% for AGIs $25k-50k, 57.6% for AGIs $50k-75k, 104.3% for AGIs $75k-100k, 174.4% for AGIs $100k-200k, 930.0% for AGIs over 200k)
Net capital gain/loss in AGI: +$7,133 (reported on 13.3% of returns)
Here:
+$7,133
State:
+$23,522
(% of AGI for various income ranges: 8.8% for AGIs below $25k, 11.0% for AGIs $25k-50k, 30.4% for AGIs $50k-75k, 140.7% for AGIs $75k-100k, 506.7% for AGIs $100k-200k, 3285.0% for AGIs over 200k)
Profit/loss from business: +$9,636 (reported on 10.8% of returns)
Here:
+$9,636
State:
+$16,274
(% of AGI for various income ranges: 90.2% for AGIs below $25k, 155.0% for AGIs $25k-50k, 89.2% for AGIs $50k-75k, 135.7% for AGIs $75k-100k, 371.1% for AGIs $100k-200k)
Taxable individual retirement arrangement distribution: $10,200 (reported on 10.8% of returns)
18635:
$10,200
Pennsylvania:
$18,583
(% of AGI for various income ranges: 97.7% for AGIs below $25k, 74.3% for AGIs $25k-50k, 194.4% for AGIs $50k-75k, 223.6% for AGIs $75k-100k, 396.1% for AGIs $100k-200k)
Total itemized deductions: $30,760 (reported on 2.5% of returns)
Here:
$30,760
State:
$34,850
(% of AGI for various income ranges: 81.2% for AGIs $25k-50k, 665.0% for AGIs $100k-200k)
Charity contributions: $10,500 (reported on 1.5% of returns)
Here:
$10,500
State:
$12,392
(% of AGI for various income ranges: 175.0% for AGIs $100k-200k)
Taxes paid: $7,540 (reported on 2.5% of returns)
18635:
$7,540
State:
$8,200
(% of AGI for various income ranges: 29.8% for AGIs $25k-50k, 140.0% for AGIs $100k-200k)
Earned income credit: $2,019 (reported on 12.8% of returns)
Here:
$2,019
State:
$2,100
(% of AGI for various income ranges: 72.1% for AGIs below $25k, 51.2% for AGIs $25k-50k)
Percentage of individuals using paid preparers for their 2020 taxes: 91.1%
Here:
91%
State:
92%
(% for various income ranges: 89.4% for AGIs below $25k, 90.7% for AGIs $25k-50k, 93.8% for AGIs $50k-75k, 89.5% for AGIs $75k-100k, 96.2% for AGIs $100k-200k, 83.3% for AGIs over 200k)
Averages for the 2012 tax year for zip code 18635, filed in 2013:
Average Adjusted Gross Income (AGI) in 2012: $47,360 (Individual Income Tax Returns)
Here:
$47,360
State:
$61,346
Salary/wage: $42,890 (reported on 85.9% of returns)
Here:
$42,890
State:
$51,902
(% of AGI for various income ranges: 69.6% for AGIs below $25k, 84.4% for AGIs $25k-50k, 82.6% for AGIs $50k-75k, 82.1% for AGIs $75k-100k, 101.8% for AGIs $100k-200k)
Taxable interest for individuals: $654 (reported on 32.8% of returns)
This zip code:
$654
Pennsylvania:
$1,588
(% of AGI for various income ranges: 1.2% for AGIs below $25k, 0.4% for AGIs $25k-50k, 0.5% for AGIs $50k-75k, 0.2% for AGIs $75k-100k, 0.5% for AGIs $100k-200k)
Ordinary dividends: $2,277 (reported on 22.4% of returns)
Here:
$2,277
State:
$5,827
(% of AGI for various income ranges: 2.0% for AGIs below $25k, 0.4% for AGIs $25k-50k, 0.9% for AGIs $50k-75k, 0.9% for AGIs $75k-100k, 2.1% for AGIs $100k-200k)
Net capital gain/loss in AGI: +$4,695 (reported on 11.5% of returns)
Here:
+$4,695
State:
+$14,495
(% of AGI for various income ranges: 0.1% for AGIs $25k-50k, 0.2% for AGIs $50k-75k, 0.5% for AGIs $75k-100k, 4.7% for AGIs $100k-200k)
Profit/loss from business: +$8,787 (reported on 12.0% of returns)
Here:
+$8,787
State:
+$16,268
(% of AGI for various income ranges: 5.1% for AGIs below $25k, 2.4% for AGIs $25k-50k, 2.6% for AGIs $50k-75k, 0.9% for AGIs $75k-100k, 2.6% for AGIs $100k-200k)
Taxable individual retirement arrangement distribution: $8,665 (reported on 8.9% of returns)
18635:
$8,665
Pennsylvania:
$14,550
(% of AGI for various income ranges: 4.4% for AGIs below $25k, 1.4% for AGIs $25k-50k, 1.3% for AGIs $50k-75k, 3.5% for AGIs $75k-100k)
Total itemized deductions: $19,365 (20% of AGI, reported on 19.3% of returns)
Here:
$19,365
State:
$23,538
Here:
20.4% of AGI
State:
18.4% of AGI
(% of AGI for various income ranges: 5.0% for AGIs below $25k, 4.4% for AGIs $25k-50k, 6.3% for AGIs $50k-75k, 7.2% for AGIs $75k-100k, 18.0% for AGIs $100k-200k)
Charity contributions: $3,584 (reported on 13.0% of returns)
Here:
$3,584
State:
$4,025
(% of AGI for various income ranges: 0.4% for AGIs $25k-50k, 0.5% for AGIs $50k-75k, 0.9% for AGIs $75k-100k, 3.0% for AGIs $100k-200k)
Taxes paid: $6,800 (reported on 19.3% of returns)
18635:
$6,800
State:
$9,982
(% of AGI for various income ranges: 0.8% for AGIs below $25k, 1.3% for AGIs $25k-50k, 2.0% for AGIs $50k-75k, 2.8% for AGIs $75k-100k, 6.9% for AGIs $100k-200k)
Earned income credit: $1,791 (reported on 16.7% of returns)
Here:
$1,791
State:
$2,106
(% of AGI for various income ranges: 4.8% for AGIs below $25k, 0.9% for AGIs $25k-50k)
Percentage of individuals using paid preparers for their 2012 taxes: 55.7%
Here:
56%
State:
53%
(% for various income ranges: 54.7% for AGIs below $25k, 53.1% for AGIs $25k-50k, 58.1% for AGIs $50k-75k, 55.0% for AGIs $75k-100k, 73.3% for AGIs $100k-200k)
Averages for the 2004 tax year for zip code 18635, filed in 2005:
Average Adjusted Gross Income (AGI) in 2004: $36,043 (Individual Income Tax Returns)
Here:
$36,043
State:
$48,049
Salary/wage: $34,414 (reported on 87.2% of returns)
Here:
$34,414
State:
$42,646
(% of AGI for various income ranges: 118.5% for AGIs below $10k, 78.9% for AGIs $10k-25k, 85.4% for AGIs $25k-50k, 86.6% for AGIs $50k-75k, 83.6% for AGIs $75k-100k, 73.0% for AGIs over 100k)
Taxable interest for individuals: $1,090 (reported on 43.6% of returns)
This zip code:
$1,090
Pennsylvania:
$1,657
(% of AGI for various income ranges: 6.4% for AGIs below $10k, 2.4% for AGIs $10k-25k, 1.0% for AGIs $25k-50k, 1.1% for AGIs $50k-75k, 0.5% for AGIs $75k-100k, 1.7% for AGIs over 100k)
Taxable dividends: $1,397 (reported on 26.0% of returns)
Here:
$1,397
State:
$3,566
(% of AGI for various income ranges: 6.1% for AGIs below $10k, 1.4% for AGIs $10k-25k, 0.6% for AGIs $25k-50k, 0.4% for AGIs $50k-75k, 1.4% for AGIs $75k-100k, 1.6% for AGIs over 100k)
Net capital gain/loss: +$1,942 (reported on 15.0% of returns)
Here:
+$1,942
State:
+$9,716
(% of AGI for various income ranges: -4.4% for AGIs below $10k, -0.1% for AGIs $10k-25k, 0.4% for AGIs $25k-50k, 0.1% for AGIs $50k-75k, 1.2% for AGIs $75k-100k, 3.5% for AGIs over 100k)
Profit/loss from business: +$11,055 (reported on 12.9% of returns)
Here:
+$11,055
State:
+$14,267
(% of AGI for various income ranges: 7.6% for AGIs below $10k, 4.6% for AGIs $10k-25k, 3.4% for AGIs $25k-50k, 2.4% for AGIs $50k-75k, 3.2% for AGIs $75k-100k, 7.2% for AGIs over 100k)
IRA payment deduction: $2,407 (reported on 3.2% of returns)
18635:
$2,407
Pennsylvania:
$2,903
Total itemized deductions: $14,561 (20% of AGI, reported on 18.6% of returns)
Here:
$14,561
State:
$18,804
Here:
20.2% of AGI
State:
19.5% of AGI
(% of AGI for various income ranges: 5.7% for AGIs $10k-25k, 5.3% for AGIs $25k-50k, 8.8% for AGIs $50k-75k, 9.6% for AGIs $75k-100k, 9.7% for AGIs over 100k)
Charity contributions deductions: $2,613 (3% of AGI, reported on 15.2% of returns)
Here:
$2,613
State:
$3,337
Here:
3.4% of AGI
State:
3.3% of AGI
(% of AGI for various income ranges: 0.6% for AGIs $10k-25k, 0.6% for AGIs $25k-50k, 1.3% for AGIs $50k-75k, 1.5% for AGIs $75k-100k, 1.9% for AGIs over 100k)
Total tax: $4,482 (reported on 75.5% of returns)
18635:
$4,482
State:
$8,008
(% of AGI for various income ranges: 3.7% for AGIs below $10k, 4.8% for AGIs $10k-25k, 6.9% for AGIs $25k-50k, 8.4% for AGIs $50k-75k, 10.4% for AGIs $75k-100k, 18.2% for AGIs over 100k)
Earned income credit: $1,408 (reported on 11.5% of returns)
Here:
$1,408
State:
$1,643
Percentage of individuals using paid preparers for their 2004 taxes: 55.5%
Here:
56%
State:
56%
(% for various income ranges: 52.0% for AGIs below $10k, 53.5% for AGIs $10k-25k, 56.9% for AGIs $25k-50k, 56.8% for AGIs $50k-75k, 63.6% for AGIs $75k-100k, 60.0% for AGIs over 100k)
Household received Food Stamps/SNAP in the past 12 months: 108 Household did not receive Food Stamps/SNAP in the past 12 months: 1,411
Women who had a birth in the past 12 months: 57 (48 now married, 10 unmarried) Women who did not have a birth in the past 12 months: 603 (274 now married, 327 unmarried)
Housing units in zip code 18635 with a mortgage: 621 (49 second mortgage, 47 both second mortgage and home equity loan) Houses without a mortgage: 24
Median monthly owner costs for units with a mortgage: $1,313 Median monthly owner costs for units without a mortgage: $540
Residents with income below the poverty level in 2022:
This zip code:
4.8%
Whole state:
11.8%
Residents with income below 50% of the poverty level in 2022:
This zip code:
3.3%
Whole state:
6.1%
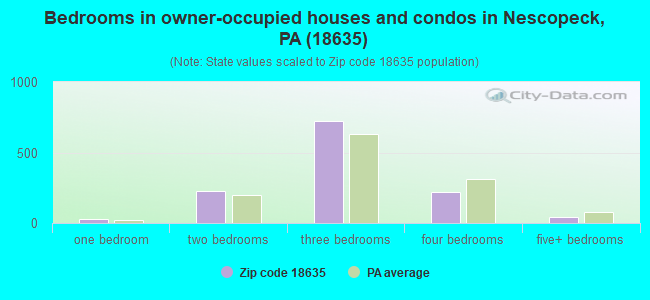
Median number of rooms in houses and condos:
Here:
6.5
State:
6.8
Median number of rooms in apartments:
Here:
4.5
State:
4.3
Notable locations in this zip code not listed on our city pages
Notable locations in zip code 18635: Nescopeck Township Volunteer Fire Company 1 (A), Nescopeck Volunteer Fire Company 1 (B). Display/hide their locations on the map
Size of family households: 510 2-persons, 262 3-persons, 145 4-persons, 46 5-persons, 43 6-persons, 7 7-or-more-persons
Size of nonfamily households: 410 1-person, 90 2-persons, 9 3-persons
545 married couples with children.
101 single-parent households (34 men, 67 women).
95.9% of residents of 18635 zip code speak English at home.
2.9% of residents speak Spanish at home (82% very well, 12% well, 5% not well).
0.7% of residents speak other Indo-European language at home (88% very well, 12% well).
0.1% of residents speak Asian or Pacific Island language at home (100% not well).
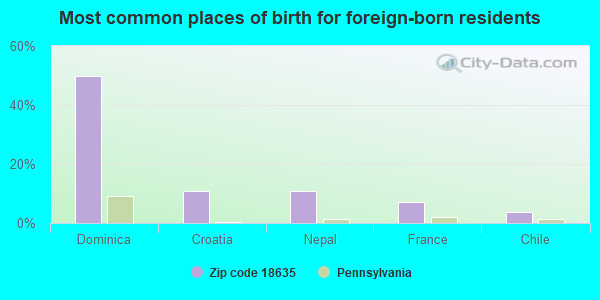
Foreign born population: 28 (0.8%) (60.2% of them are naturalized citizens)
This zip code:
0.8%
Whole state:
7.5%
50%Dominica
11%Croatia
11%Nepal
7%France
4%Chile
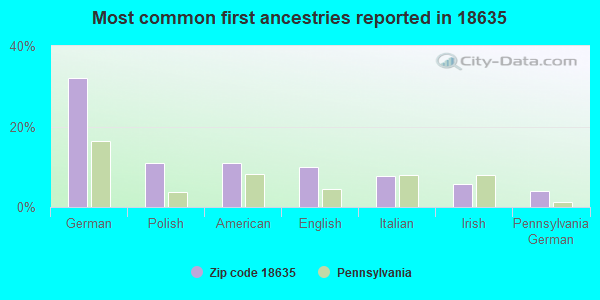
32%German
11%Polish
11%American
10%English
8%Italian
6%Irish
4%Pennsylvania German
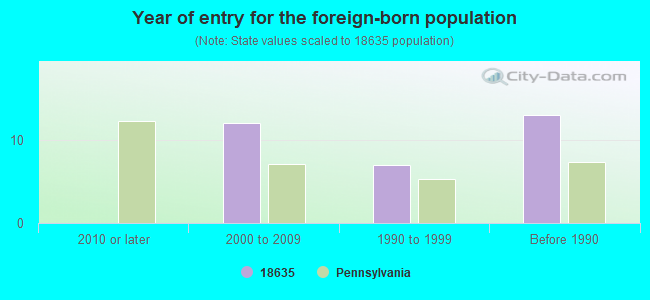
Year of entry for the foreign-born population
02010 or later
122000 to 2009
71990 to 1999
13Before 1990
Facilities with environmental interests located in this zip code:
BEAR AUTO SALES (1103 3RD STREET in NESCOPECK, PA)
AIR MINOR (AIRS/AFS) Business SIC classification: MOTOR VEHICLE DEALERS (USED ONLY); AUTOMOTIVE REPAIR SHOPS
BARLETTA MATERIALS & CONST/NESCOPECK (HONEY HOLE SR 93 in NESCOPECK, PA)
AIR SYNTHETIC MINOR (AIRS/AFS) Business SIC classification: ASPHALT PAVING MIXTURES AND BLOCKS Alternative names: BARLETTA A & SONS NESC, BARLETTA MATS AND CONST/NESCOPECK
Housing units lacking complete plumbing facilities: 2.2% Housing units lacking complete kitchen facilities: 1.8%
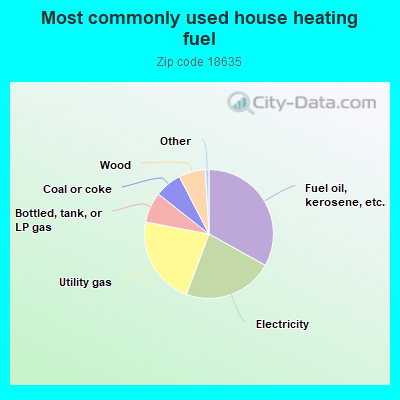
33.2%Fuel oil, kerosene, etc.
22.7%Electricity
22.3%Utility gas
7.7%Bottled, tank, or LP gas
6.8%Coal or coke
6.7%Wood
Population in 1990: 2,723. Population change in the 1990s: +1,108 (+40.7%).
Place of birth for U.S.-born residents:
This state: 3,031
Northeast: 264
Midwest: 43
South: 126
West: 38
72% of the 18635 zip code residents lived in the same house 5 years ago. Out of people who lived in different houses, 46% lived in this county. Out of people who lived in different counties, 50% lived in Pennsylvania.
95% of the 18635 zip code residents lived in the same house 1 year ago. Out of people who lived in different houses, 47% moved from this county. Out of people who lived in different houses, 47% moved from different county within same state. Out of people who lived in different houses, 9% moved from different state.
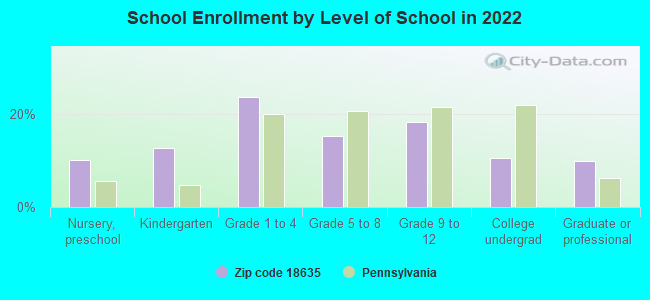
Private vs. public school enrollment:
Students in private schools in grades 1 to 8 (elementary and middle school): 35
Here:
13.5%
Pennsylvania:
15.7%
Students in private schools in grades 9 to 12 (high school):
Here:
0.0%
Pennsylvania:
13.4%
Students in private undergraduate colleges: 2
Here:
4.1%
Pennsylvania:
39.8%
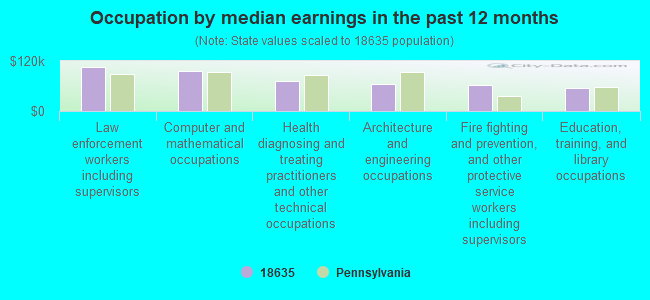
Occupation by median earnings in the past 12 months ($)
105,283Law enforcement workers including supervisors
97,191Computer and mathematical occupations
71,957Health diagnosing and treating practitioners and other technical occupations
64,830Architecture and engineering occupations
63,305Fire fighting and prevention, and other protective service workers including supervisors
54,293Education, training, and library occupations
Top industries in this zip code by the number of employees in 2005:
Administrative and Support and Waste Management and Remediation Services: Solid Waste Collection (50-99 employees: 1 establishment, 1-4 employees: 1 establishment)
Other Services (except Public Administration): Religious Organizations (5-9: 1, 1-4: 4)
Construction: Power and Communication Line and Related Structures Construction (10-19: 1)
Fatal accident statistics in 2014:
Fatal accident count: 2
Vehicles involved in fatal accidents: 2
Fatal accidents caused by drunken drivers: 2
Fatalities: 2
Persons involved in fatal accidents: 2
Pedestrians involved in fatal accidents: 0
Fatal accident statistics in 2012:
Fatal accident count: 1
Vehicles involved in fatal accidents: 1
Fatal accidents caused by drunken drivers: 0
Fatalities: 1
Persons involved in fatal accidents: 1
Pedestrians involved in fatal accidents: 0
Home Mortgage Disclosure Act Aggregated Statistics For Year 2009 (Based on 2 partial tracts)
A) FHA, FSA/RHS & VA Home Purchase Loans
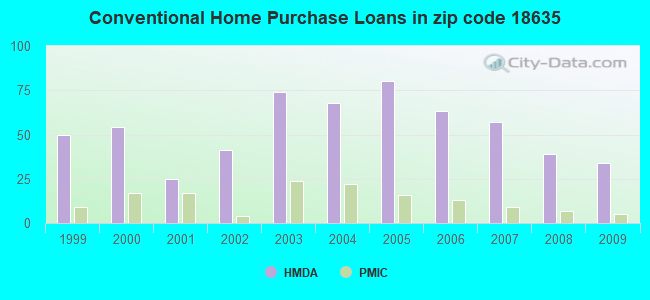
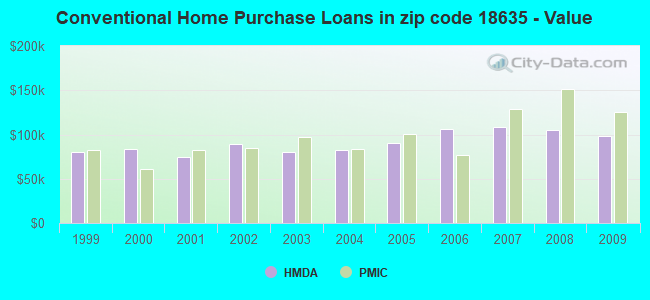
B) Conventional Home Purchase Loans
C) Refinancings
D) Home Improvement Loans
E) Loans on Dwellings For 5+ Families
F) Non-occupant Loans on < 5 Family Dwellings (A B C & D)
G) Loans On Manufactured Home Dwelling (A B C & D)
Number
Average Value
Number
Average Value
Number
Average Value
Number
Average Value
Number
Average Value
Number
Average Value
Number
Average Value
LOANS ORIGINATED
15
$104,749
34
$98,627
102
$124,993
36
$28,037
1
$238,500
10
$68,211
7
$77,819
APPLICATIONS APPROVED, NOT ACCEPTED
0
$0
2
$171,720
10
$117,628
0
$0
0
$0
1
$41,980
0
$0
APPLICATIONS DENIED
3
$96,673
10
$68,211
56
$129,386
14
$18,399
0
$0
5
$84,334
3
$81,727
APPLICATIONS WITHDRAWN
1
$121,160
1
$103,990
24
$142,424
2
$63,440
0
$0
0
$0
0
$0
FILES CLOSED FOR INCOMPLETENESS
1
$151,690
2
$45,790
7
$157,683
2
$42,930
0
$0
0
$0
0
$0
Aggregated Statistics For Year 2008 (Based on 2 partial tracts)
A) FHA, FSA/RHS & VA Home Purchase Loans
B) Conventional Home Purchase Loans
C) Refinancings
D) Home Improvement Loans
F) Non-occupant Loans on < 5 Family Dwellings (A B C & D)
G) Loans On Manufactured Home Dwelling (A B C & D)
Number
Average Value
Number
Average Value
Number
Average Value
Number
Average Value
Number
Average Value
Number
Average Value
LOANS ORIGINATED
10
$122,684
39
$105,258
72
$103,628
51
$27,385
9
$66,144
7
$44,293
APPLICATIONS APPROVED, NOT ACCEPTED
0
$0
3
$56,923
10
$110,855
8
$31,720
0
$0
1
$37,210
APPLICATIONS DENIED
1
$93,490
8
$86,934
88
$115,629
21
$30,301
2
$57,240
8
$104,344
APPLICATIONS WITHDRAWN
0
$0
6
$109,552
27
$136,281
2
$15,265
2
$44,360
0
$0
FILES CLOSED FOR INCOMPLETENESS
1
$56,290
2
$91,585
7
$94,719
1
$86,810
0
$0
0
$0
Aggregated Statistics For Year 2007 (Based on 2 partial tracts)
A) FHA, FSA/RHS & VA Home Purchase Loans
B) Conventional Home Purchase Loans
C) Refinancings
D) Home Improvement Loans
F) Non-occupant Loans on < 5 Family Dwellings (A B C & D)
G) Loans On Manufactured Home Dwelling (A B C & D)
Number
Average Value
Number
Average Value
Number
Average Value
Number
Average Value
Number
Average Value
Number
Average Value
LOANS ORIGINATED
6
$126,405
57
$108,856
93
$122,122
54
$31,146
9
$114,798
7
$75,093
APPLICATIONS APPROVED, NOT ACCEPTED
0
$0
13
$79,842
25
$115,472
10
$38,065
2
$44,360
7
$64,871
APPLICATIONS DENIED
0
$0
13
$81,310
129
$107,713
42
$37,887
9
$94,234
5
$82,044
APPLICATIONS WITHDRAWN
0
$0
6
$125,292
53
$116,064
9
$23,850
2
$116,390
2
$79,180
FILES CLOSED FOR INCOMPLETENESS
0
$0
7
$129,063
16
$164,148
2
$49,130
0
$0
0
$0
Aggregated Statistics For Year 2006 (Based on 2 partial tracts)
A) FHA, FSA/RHS & VA Home Purchase Loans
B) Conventional Home Purchase Loans
C) Refinancings
D) Home Improvement Loans
F) Non-occupant Loans on < 5 Family Dwellings (A B C & D)
G) Loans On Manufactured Home Dwelling (A B C & D)
Number
Average Value
Number
Average Value
Number
Average Value
Number
Average Value
Number
Average Value
Number
Average Value
LOANS ORIGINATED
6
$111,142
63
$106,106
104
$85,319
54
$26,429
9
$89,464
6
$49,132
APPLICATIONS APPROVED, NOT ACCEPTED
0
$0
16
$161,941
28
$80,034
9
$23,214
2
$49,130
7
$52,879
APPLICATIONS DENIED
1
$98,260
13
$83,365
129
$102,751
43
$47,034
5
$82,044
7
$42,794
APPLICATIONS WITHDRAWN
2
$85,385
6
$67,893
77
$112,052
5
$58,004
2
$80,615
1
$115,430
FILES CLOSED FOR INCOMPLETENESS
0
$0
3
$71,233
16
$124,795
0
$0
0
$0
1
$86,810
Aggregated Statistics For Year 2005 (Based on 2 partial tracts)
A) FHA, FSA/RHS & VA Home Purchase Loans
B) Conventional Home Purchase Loans
C) Refinancings
D) Home Improvement Loans
F) Non-occupant Loans on < 5 Family Dwellings (A B C & D)
G) Loans On Manufactured Home Dwelling (A B C & D)
Number
Average Value
Number
Average Value
Number
Average Value
Number
Average Value
Number
Average Value
Number
Average Value
LOANS ORIGINATED
6
$106,688
80
$90,499
97
$88,692
59
$30,011
10
$59,434
8
$61,532
APPLICATIONS APPROVED, NOT ACCEPTED
2
$83,475
7
$61,601
27
$71,903
4
$23,850
0
$0
3
$28,937
APPLICATIONS DENIED
0
$0
21
$61,192
148
$100,106
41
$30,272
12
$53,106
8
$34,344
APPLICATIONS WITHDRAWN
1
$109,710
15
$84,461
58
$105,236
9
$115,964
5
$78,418
0
$0
FILES CLOSED FOR INCOMPLETENESS
0
$0
4
$60,580
10
$148,919
1
$22,900
1
$41,020
0
$0
Aggregated Statistics For Year 2004 (Based on 2 partial tracts)
A) FHA, FSA/RHS & VA Home Purchase Loans
B) Conventional Home Purchase Loans
C) Refinancings
D) Home Improvement Loans
E) Loans on Dwellings For 5+ Families
F) Non-occupant Loans on < 5 Family Dwellings (A B C & D)
G) Loans On Manufactured Home Dwelling (A B C & D)
Number
Average Value
Number
Average Value
Number
Average Value
Number
Average Value
Number
Average Value
Number
Average Value
Number
Average Value
LOANS ORIGINATED
4
$83,475
68
$82,325
164
$87,029
53
$22,590
1
$232,780
14
$47,564
9
$25,122
APPLICATIONS APPROVED, NOT ACCEPTED
2
$90,630
9
$69,960
35
$80,790
6
$28,938
0
$0
2
$66,305
1
$59,150
APPLICATIONS DENIED
1
$71,550
21
$69,688
100
$96,917
26
$27,483
0
$0
10
$85,288
6
$45,792
APPLICATIONS WITHDRAWN
1
$95,400
6
$63,442
68
$91,710
8
$56,525
0
$0
0
$0
5
$72,122
FILES CLOSED FOR INCOMPLETENESS
0
$0
5
$85,860
8
$90,034
2
$14,310
0
$0
0
$0
0
$0
Aggregated Statistics For Year 2003 (Based on 4 partial tracts)
A) FHA, FSA/RHS & VA Home Purchase Loans
B) Conventional Home Purchase Loans
C) Refinancings
D) Home Improvement Loans
F) Non-occupant Loans on < 5 Family Dwellings (A B C & D)
Number
Average Value
Number
Average Value
Number
Average Value
Number
Average Value
Number
Average Value
LOANS ORIGINATED
9
$94,801
74
$79,684
338
$89,734
66
$29,110
25
$83,385
APPLICATIONS APPROVED, NOT ACCEPTED
0
$0
8
$87,860
60
$92,784
13
$39,077
0
$0
APPLICATIONS DENIED
2
$98,515
17
$89,051
160
$92,119
38
$27,592
8
$51,692
APPLICATIONS WITHDRAWN
1
$115,940
7
$69,779
82
$92,830
3
$23,213
0
$0
FILES CLOSED FOR INCOMPLETENESS
0
$0
2
$51,995
8
$85,702
3
$76,637
0
$0
Aggregated Statistics For Year 2002 (Based on 4 partial tracts)
A) FHA, FSA/RHS & VA Home Purchase Loans
B) Conventional Home Purchase Loans
C) Refinancings
D) Home Improvement Loans
F) Non-occupant Loans on < 5 Family Dwellings (A B C & D)
Number
Average Value
Number
Average Value
Number
Average Value
Number
Average Value
Number
Average Value
LOANS ORIGINATED
1
$53,420
41
$88,983
127
$73,298
20
$30,126
8
$50,406
APPLICATIONS APPROVED, NOT ACCEPTED
0
$0
4
$96,705
30
$77,654
4
$52,470
1
$62,010
APPLICATIONS DENIED
1
$75,370
12
$65,612
63
$74,499
11
$20,687
5
$76,130
APPLICATIONS WITHDRAWN
0
$0
1
$126,020
44
$81,309
1
$6,680
0
$0
FILES CLOSED FOR INCOMPLETENESS
0
$0
1
$126,020
3
$123,157
0
$0
0
$0
Aggregated Statistics For Year 2001 (Based on 4 partial tracts)
A) FHA, FSA/RHS & VA Home Purchase Loans
B) Conventional Home Purchase Loans
C) Refinancings
D) Home Improvement Loans
E) Loans on Dwellings For 5+ Families
F) Non-occupant Loans on < 5 Family Dwellings (A B C & D)
Number
Average Value
Number
Average Value
Number
Average Value
Number
Average Value
Number
Average Value
Number
Average Value
LOANS ORIGINATED
7
$91,786
25
$74,320
80
$63,942
25
$19,664
1
$201,630
5
$46,144
APPLICATIONS APPROVED, NOT ACCEPTED
0
$0
5
$55,904
15
$63,371
2
$15,840
0
$0
0
$0
APPLICATIONS DENIED
0
$0
12
$37,578
57
$65,820
10
$27,857
0
$0
1
$33,390
APPLICATIONS WITHDRAWN
0
$0
3
$60,990
30
$74,980
0
$0
0
$0
1
$49,610
FILES CLOSED FOR INCOMPLETENESS
0
$0
0
$0
2
$72,505
0
$0
0
$0
0
$0
Aggregated Statistics For Year 2000 (Based on 4 partial tracts)
A) FHA, FSA/RHS & VA Home Purchase Loans
B) Conventional Home Purchase Loans
C) Refinancings
D) Home Improvement Loans
F) Non-occupant Loans on < 5 Family Dwellings (A B C & D)
Number
Average Value
Number
Average Value
Number
Average Value
Number
Average Value
Number
Average Value
LOANS ORIGINATED
4
$76,310
54
$83,417
41
$61,990
23
$29,340
5
$43,694
APPLICATIONS APPROVED, NOT ACCEPTED
2
$83,000
1
$63,920
10
$81,776
3
$30,800
0
$0
APPLICATIONS DENIED
0
$0
7
$46,401
44
$54,518
15
$21,258
5
$45,028
APPLICATIONS WITHDRAWN
1
$85,860
7
$59,830
30
$58,450
2
$57,240
0
$0
FILES CLOSED FOR INCOMPLETENESS
0
$0
0
$0
8
$58,432
0
$0
0
$0
Aggregated Statistics For Year 1999 (Based on 2 partial tracts)
A) FHA, FSA/RHS & VA Home Purchase Loans
B) Conventional Home Purchase Loans
C) Refinancings
D) Home Improvement Loans
F) Non-occupant Loans on < 5 Family Dwellings (A B C & D)
Detailed PMIC statistics for the following Tracts:0514.00
, 2162.00
2004 - 2018 National Fire Incident Reporting System (NFIRS) incidents
According to the data from the years 2004 - 2018 the average number of fire incidents per year is 8. The highest number of fires - 21 took place in 2015, and the least - 0 in 2006. The data has a rising trend.
When looking into fire subcategories, the most incidents belonged to: Outside Fires (35.0%), and Structure Fires (32.5%).
Fire incident types reported to NFIRS in Zip Code 18635


 Nearest zip codes: 18246, 18603, 18249, 18631, 18256, 18241.


 According to the data from the years 2004 - 2018 the average number of fire incidents per year is 8. The highest number of fires - 21 took place in 2015, and the least - 0 in 2006. The data has a rising trend.
 When looking into fire subcategories, the most incidents belonged to: Outside Fires (35.0%), and Structure Fires (32.5%).