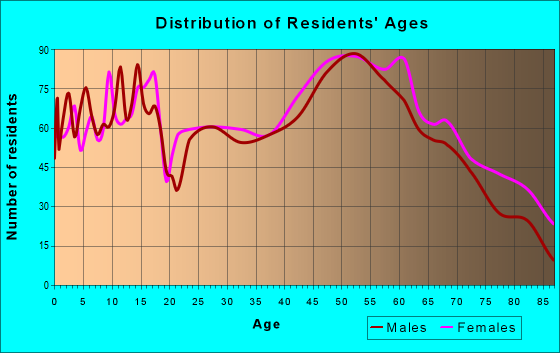
Estimated zip code population in 2022: 11,266 Zip code population in 2010: 10,731 Zip code population in 2000: 10,811
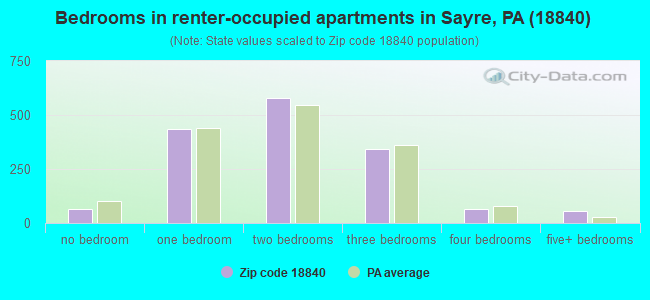
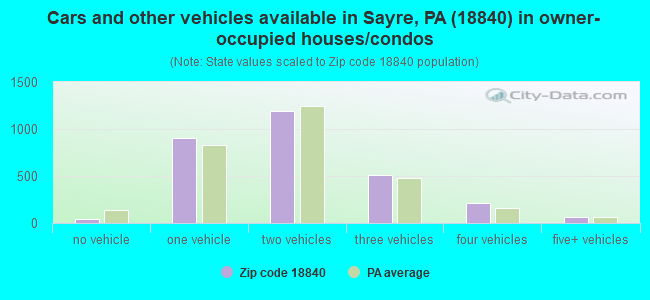
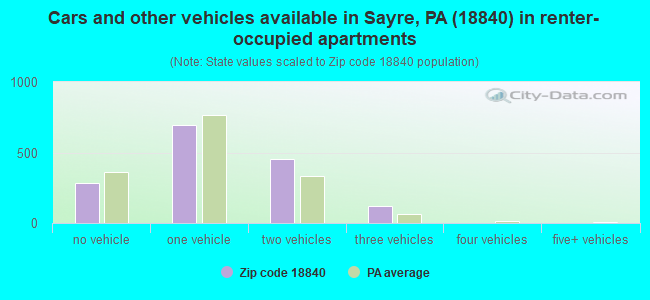
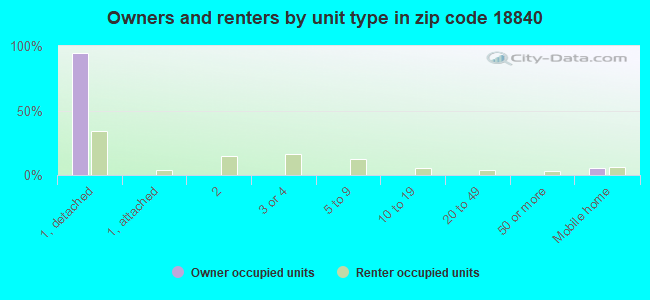
Houses and condos: 4,935 Renter-occupied apartments: 1,549
% of renters here:
35%
State:
31%
March 2022 cost of living index in zip code 18840: 85.5 (less than average, U.S. average is 100)
Land area: 45.0 sq. mi. Water area: 0.8 sq. mi.
Population density: 250 people per square mile
(very low).
OSM Map
General Map
Google Map
MSN Map
OSM Map
General Map
Google Map
MSN Map
OSM Map
General Map
Google Map
MSN Map
OSM Map
General Map
Google Map
MSN Map
Please wait while loading the map...
Real estate property taxes paid for housing units in 2022:
This zip code:
1.3% ($2,378)
Pennsylvania:
1.3% ($3,094)
Median real estate property taxes paid for housing units with mortgages in 2022: $2,465 (1.3%) Median real estate property taxes paid for housing units with no mortgage in 2022: $2,147 (1.3%)
Averages for the 2020 tax year for zip code 18840, filed in 2021:
Average Adjusted Gross Income (AGI) in 2020: $62,330 (Individual Income Tax Returns)
Here:
$62,330
State:
$75,707
Salary/wage: $55,677 (reported on 78.7% of returns)
Here:
$55,677
State:
$62,806
(% of AGI for various income ranges: 1088.2% for AGIs below $25k, 3275.2% for AGIs $25k-50k, 6094.6% for AGIs $50k-75k, 8602.4% for AGIs $75k-100k, 16088.5% for AGIs $100k-200k, 75438.3% for AGIs over 200k)
Taxable interest for individuals: $998 (reported on 34.7% of returns)
This zip code:
$998
Pennsylvania:
$1,633
(% of AGI for various income ranges: 21.5% for AGIs below $25k, 22.9% for AGIs $25k-50k, 23.7% for AGIs $50k-75k, 80.3% for AGIs $75k-100k, 133.9% for AGIs $100k-200k, 541.7% for AGIs over 200k)
Ordinary dividends: $4,677 (reported on 20.9% of returns)
Here:
$4,677
State:
$7,382
(% of AGI for various income ranges: 27.8% for AGIs below $25k, 37.7% for AGIs $25k-50k, 86.1% for AGIs $50k-75k, 181.8% for AGIs $75k-100k, 413.7% for AGIs $100k-200k, 2418.3% for AGIs over 200k)
Net capital gain/loss in AGI: +$15,074 (reported on 15.8% of returns)
Here:
+$15,074
State:
+$23,522
(% of AGI for various income ranges: 29.0% for AGIs below $25k, 28.8% for AGIs $25k-50k, 66.1% for AGIs $50k-75k, 170.6% for AGIs $75k-100k, 483.7% for AGIs $100k-200k, 14170.0% for AGIs over 200k)
Profit/loss from business: +$14,471 (reported on 9.5% of returns)
Here:
+$14,471
State:
+$16,274
(% of AGI for various income ranges: 56.2% for AGIs below $25k, 54.0% for AGIs $25k-50k, 59.2% for AGIs $50k-75k, 257.0% for AGIs $75k-100k, 303.9% for AGIs $100k-200k, 5530.0% for AGIs over 200k)
Taxable individual retirement arrangement distribution: $18,487 (reported on 12.2% of returns)
18840:
$18,487
Pennsylvania:
$18,583
(% of AGI for various income ranges: 115.1% for AGIs below $25k, 142.7% for AGIs $25k-50k, 259.8% for AGIs $50k-75k, 346.4% for AGIs $75k-100k, 1002.7% for AGIs $100k-200k, 3178.3% for AGIs over 200k)
Total itemized deductions: $36,750 (reported on 3.2% of returns)
Here:
$36,750
State:
$34,850
(% of AGI for various income ranges: 99.7% for AGIs below $25k, 104.2% for AGIs $50k-75k, 145.5% for AGIs $75k-100k, 461.7% for AGIs $100k-200k, 3008.3% for AGIs over 200k)
Charity contributions: $13,891 (reported on 2.2% of returns)
Here:
$13,891
State:
$12,392
(% of AGI for various income ranges: 29.3% for AGIs $50k-75k, 107.3% for AGIs $100k-200k, 1525.0% for AGIs over 200k)
Taxes paid: $7,494 (reported on 3.2% of returns)
18840:
$7,494
State:
$8,200
(% of AGI for various income ranges: 11.3% for AGIs below $25k, 50.5% for AGIs $50k-75k, 99.0% for AGIs $100k-200k, 620.0% for AGIs over 200k)
Earned income credit: $2,148 (reported on 13.6% of returns)
Here:
$2,148
State:
$2,100
(% of AGI for various income ranges: 79.9% for AGIs below $25k, 57.6% for AGIs $25k-50k)
Percentage of individuals using paid preparers for their 2020 taxes: 96.8%
Here:
97%
State:
92%
(% for various income ranges: 95.7% for AGIs below $25k, 97.0% for AGIs $25k-50k, 97.4% for AGIs $50k-75k, 97.9% for AGIs $75k-100k, 97.1% for AGIs $100k-200k, 100.0% for AGIs over 200k)
Averages for the 2012 tax year for zip code 18840, filed in 2013:
Average Adjusted Gross Income (AGI) in 2012: $52,276 (Individual Income Tax Returns)
Here:
$52,276
State:
$61,346
Salary/wage: $46,317 (reported on 81.0% of returns)
Here:
$46,317
State:
$51,902
(% of AGI for various income ranges: 68.6% for AGIs below $25k, 77.3% for AGIs $25k-50k, 74.6% for AGIs $50k-75k, 73.2% for AGIs $75k-100k, 73.6% for AGIs $100k-200k, 61.8% for AGIs over 200k)
Taxable interest for individuals: $945 (reported on 37.7% of returns)
This zip code:
$945
Pennsylvania:
$1,588
(% of AGI for various income ranges: 1.5% for AGIs below $25k, 0.6% for AGIs $25k-50k, 0.5% for AGIs $50k-75k, 0.5% for AGIs $75k-100k, 0.8% for AGIs $100k-200k, 0.6% for AGIs over 200k)
Ordinary dividends: $3,671 (reported on 24.5% of returns)
Here:
$3,671
State:
$5,827
(% of AGI for various income ranges: 1.8% for AGIs below $25k, 1.2% for AGIs $25k-50k, 1.8% for AGIs $50k-75k, 1.5% for AGIs $75k-100k, 1.6% for AGIs $100k-200k, 2.5% for AGIs over 200k)
Net capital gain/loss in AGI: +$11,013 (reported on 14.8% of returns)
Here:
+$11,013
State:
+$14,495
(% of AGI for various income ranges: 0.2% for AGIs below $25k, 0.3% for AGIs $25k-50k, 0.5% for AGIs $50k-75k, 1.2% for AGIs $75k-100k, 2.6% for AGIs $100k-200k, 11.9% for AGIs over 200k)
Profit/loss from business: +$13,523 (reported on 9.5% of returns)
Here:
+$13,523
State:
+$16,268
(% of AGI for various income ranges: 3.6% for AGIs below $25k, 3.0% for AGIs $25k-50k, 1.0% for AGIs $50k-75k, 1.5% for AGIs $75k-100k, 1.6% for AGIs $100k-200k, 4.7% for AGIs over 200k)
Taxable individual retirement arrangement distribution: $14,689 (reported on 13.8% of returns)
18840:
$14,689
Pennsylvania:
$14,550
(% of AGI for various income ranges: 5.1% for AGIs below $25k, 3.0% for AGIs $25k-50k, 3.5% for AGIs $50k-75k, 4.3% for AGIs $75k-100k, 3.9% for AGIs $100k-200k, 4.0% for AGIs over 200k)
Total itemized deductions: $20,071 (17% of AGI, reported on 21.5% of returns)
Here:
$20,071
State:
$23,538
Here:
17.3% of AGI
State:
18.4% of AGI
(% of AGI for various income ranges: 4.8% for AGIs below $25k, 5.6% for AGIs $25k-50k, 7.7% for AGIs $50k-75k, 7.5% for AGIs $75k-100k, 10.6% for AGIs $100k-200k, 10.4% for AGIs over 200k)
Charity contributions: $3,945 (reported on 15.8% of returns)
Here:
$3,945
State:
$4,025
(% of AGI for various income ranges: 0.5% for AGIs below $25k, 0.5% for AGIs $25k-50k, 0.9% for AGIs $50k-75k, 1.0% for AGIs $75k-100k, 1.7% for AGIs $100k-200k, 1.9% for AGIs over 200k)
Taxes paid: $9,416 (reported on 21.5% of returns)
18840:
$9,416
State:
$9,982
(% of AGI for various income ranges: 1.0% for AGIs below $25k, 1.8% for AGIs $25k-50k, 2.7% for AGIs $50k-75k, 3.2% for AGIs $75k-100k, 5.5% for AGIs $100k-200k, 6.7% for AGIs over 200k)
Earned income credit: $2,019 (reported on 15.4% of returns)
Here:
$2,019
State:
$2,106
(% of AGI for various income ranges: 4.8% for AGIs below $25k, 1.0% for AGIs $25k-50k)
Percentage of individuals using paid preparers for their 2012 taxes: 64.2%
Here:
64%
State:
53%
(% for various income ranges: 56.2% for AGIs below $25k, 65.0% for AGIs $25k-50k, 69.3% for AGIs $50k-75k, 76.7% for AGIs $75k-100k, 72.5% for AGIs $100k-200k, 76.9% for AGIs over 200k)
Averages for the 2004 tax year for zip code 18840, filed in 2005:
Average Adjusted Gross Income (AGI) in 2004: $40,305 (Individual Income Tax Returns)
Here:
$40,305
State:
$48,049
Salary/wage: $37,643 (reported on 82.4% of returns)
Here:
$37,643
State:
$42,646
(% of AGI for various income ranges: 87.2% for AGIs below $10k, 72.0% for AGIs $10k-25k, 79.3% for AGIs $25k-50k, 78.2% for AGIs $50k-75k, 80.3% for AGIs $75k-100k, 74.0% for AGIs over 100k)
Taxable interest for individuals: $1,311 (reported on 51.0% of returns)
This zip code:
$1,311
Pennsylvania:
$1,657
(% of AGI for various income ranges: 4.0% for AGIs below $10k, 2.5% for AGIs $10k-25k, 1.4% for AGIs $25k-50k, 1.5% for AGIs $50k-75k, 1.1% for AGIs $75k-100k, 1.8% for AGIs over 100k)
Taxable dividends: $2,582 (reported on 28.5% of returns)
Here:
$2,582
State:
$3,566
(% of AGI for various income ranges: 4.0% for AGIs below $10k, 1.9% for AGIs $10k-25k, 1.5% for AGIs $25k-50k, 1.0% for AGIs $50k-75k, 1.3% for AGIs $75k-100k, 2.8% for AGIs over 100k)
Net capital gain/loss: +$3,986 (reported on 18.9% of returns)
Here:
+$3,986
State:
+$9,716
(% of AGI for various income ranges: -0.4% for AGIs below $10k, 0.4% for AGIs $10k-25k, 0.7% for AGIs $25k-50k, 1.1% for AGIs $50k-75k, 1.4% for AGIs $75k-100k, 4.3% for AGIs over 100k)
Profit/loss from business: +$9,567 (reported on 11.3% of returns)
Here:
+$9,567
State:
+$14,267
(% of AGI for various income ranges: -0.4% for AGIs below $10k, 3.1% for AGIs $10k-25k, 2.3% for AGIs $25k-50k, 1.8% for AGIs $50k-75k, 2.1% for AGIs $75k-100k, 4.0% for AGIs over 100k)
IRA payment deduction: $2,543 (reported on 2.7% of returns)
18840:
$2,543
Pennsylvania:
$2,903
(% of AGI for various income ranges: 0.3% for AGIs $10k-25k, 0.3% for AGIs $25k-50k, 0.1% for AGIs $50k-75k, 0.1% for AGIs $75k-100k, 0.1% for AGIs over 100k)
Self-employed pension: $13,522 (reported on 0.5% of returns)
Here:
$13,522
Pennsylvania:
$14,674
Total itemized deductions: $16,910 (20% of AGI, reported on 23.1% of returns)
Here:
$16,910
State:
$18,804
Here:
19.9% of AGI
State:
19.5% of AGI
(% of AGI for various income ranges: 4.5% for AGIs below $10k, 5.5% for AGIs $10k-25k, 6.6% for AGIs $25k-50k, 8.5% for AGIs $50k-75k, 14.2% for AGIs $75k-100k, 12.5% for AGIs over 100k)
Charity contributions deductions: $2,621 (3% of AGI, reported on 20.2% of returns)
Here:
$2,621
State:
$3,337
Here:
3.0% of AGI
State:
3.3% of AGI
(% of AGI for various income ranges: 0.5% for AGIs below $10k, 0.7% for AGIs $10k-25k, 0.6% for AGIs $25k-50k, 0.9% for AGIs $50k-75k, 1.4% for AGIs $75k-100k, 2.3% for AGIs over 100k)
Total tax: $5,849 (reported on 72.4% of returns)
18840:
$5,849
State:
$8,008
(% of AGI for various income ranges: 2.1% for AGIs below $10k, 3.9% for AGIs $10k-25k, 6.7% for AGIs $25k-50k, 8.9% for AGIs $50k-75k, 10.9% for AGIs $75k-100k, 17.4% for AGIs over 100k)
Earned income credit: $1,557 (reported on 15.4% of returns)
Here:
$1,557
State:
$1,643
Percentage of individuals using paid preparers for their 2004 taxes: 65.6%
Here:
66%
State:
56%
(% for various income ranges: 58.0% for AGIs below $10k, 65.5% for AGIs $10k-25k, 68.7% for AGIs $25k-50k, 69.6% for AGIs $50k-75k, 69.5% for AGIs $75k-100k, 66.8% for AGIs over 100k)
Likely homosexual households (counted as self-reported same-sex unmarried-partner households)
Lesbian couples: 0.0% of all households
Gay men: 0.9% of all households
Household received Food Stamps/SNAP in the past 12 months: 514 Household did not receive Food Stamps/SNAP in the past 12 months: 3,948
Women who had a birth in the past 12 months: 57 (5 now married, 44 unmarried) Women who did not have a birth in the past 12 months: 2,598 (954 now married, 1,646 unmarried)
Housing units in zip code 18840 with a mortgage: 1,776 (196 second mortgage, 6 home equity loan, 179 both second mortgage and home equity loan) Houses without a mortgage: 211
Median monthly owner costs for units with a mortgage: $1,354 Median monthly owner costs for units without a mortgage: $572
Residents with income below the poverty level in 2022:
This zip code:
12.4%
Whole state:
11.8%
Residents with income below 50% of the poverty level in 2022:
This zip code:
7.2%
Whole state:
6.1%
Median number of rooms in houses and condos:
Here:
7.2
State:
6.8
Median number of rooms in apartments:
Here:
4.6
State:
4.3
Notable locations in this zip code not listed on our city pages
Notable locations in zip code 18840: Sayre Fire Department Howard Elmer Hose Company 4 (A), Sayre Fire Department Engine Company 1 (B), South Waverly Fire Department (C), Litchfield Township Volunteer Fire Company (D), Athens Township Volunteer Fire Company (E), Sayre Fire Department J E Wheelock Hose Company 5 (F). Display/hide their locations on the map
Streams, rivers, and creeks: Cayuta Creek (A), Stone Lick Creek (B), Fall Creek (C), Browns Run (D), Orcutt Creek (E). Display/hide their locations on the map
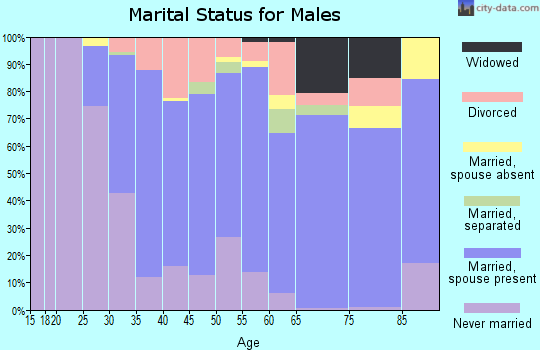
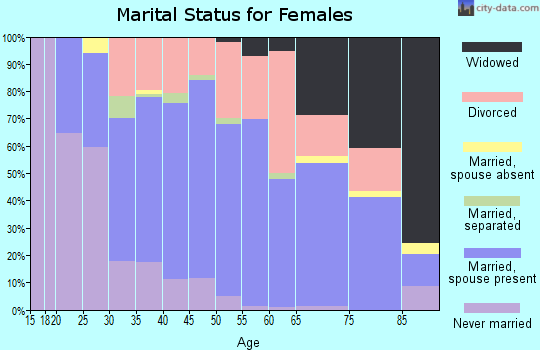
1,384 married couples with children.
1,222 single-parent households (712 men, 510 women).
95.3% of residents of 18840 zip code speak English at home.
0.6% of residents speak Spanish at home (87% very well, 13% well).
2.5% of residents speak other Indo-European language at home (81% very well, 8% well, 10% not at all).
0.6% of residents speak Asian or Pacific Island language at home (75% very well, 25% well).
0.3% of residents speak other language at home (100% very well).
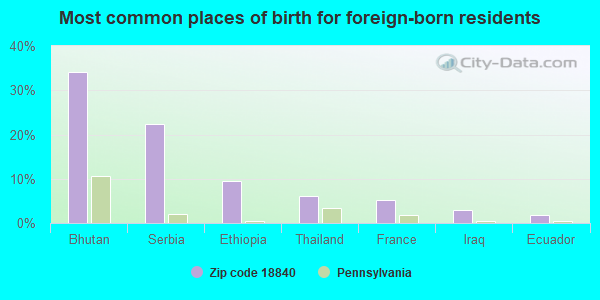
Foreign born population: 419 (3.7%) (31.3% of them are naturalized citizens)
Facilities with environmental interests located in this zip code:
BELDEN & BLAKE CORP/BRADFORD WEST COMP S (SUNNYFIELD DR GILLETT in SAYRE, PA)
AIR MINOR (AIRS/AFS) Business SIC classification: OIL AND GAS FIELD SERVICES
AJAX X-RAY INC (150 BRADFORD ST in SAYRE, PA)
TRI REPORTER (Tracking of toxic chemicals releasing facilities) Business SIC classification: ALUMINUM FOUNDRIES; COPPER FOUNDRIES
Housing units lacking complete plumbing facilities: 1.6% Housing units lacking complete kitchen facilities: 1.3%
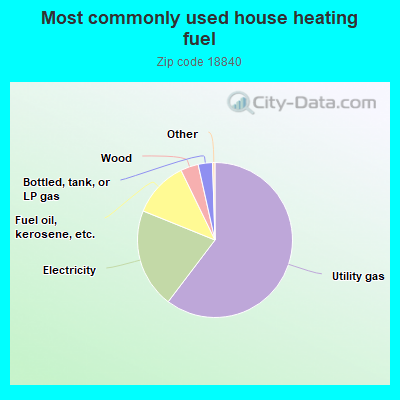
60.4%Utility gas
20.8%Electricity
11.7%Fuel oil, kerosene, etc.
3.7%Wood
3.0%Bottled, tank, or LP gas
Population in 1990: 10,320. Population change in the 1990s: +491 (+4.8%).
Place of birth for U.S.-born residents:
This state: 7,550
Northeast: 2,498
Midwest: 131
South: 358
West: 281
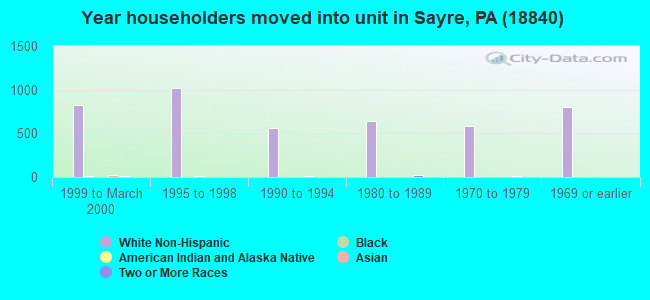
61% of the 18840 zip code residents lived in the same house 5 years ago. Out of people who lived in different houses, 58% lived in this county. Out of people who lived in different counties, 50% lived in Pennsylvania.
90% of the 18840 zip code residents lived in the same house 1 year ago. Out of people who lived in different houses, 60% moved from this county. Out of people who lived in different houses, 4% moved from different county within same state. Out of people who lived in different houses, 27% moved from different state. Out of people who lived in different houses, 10% moved from abroad.
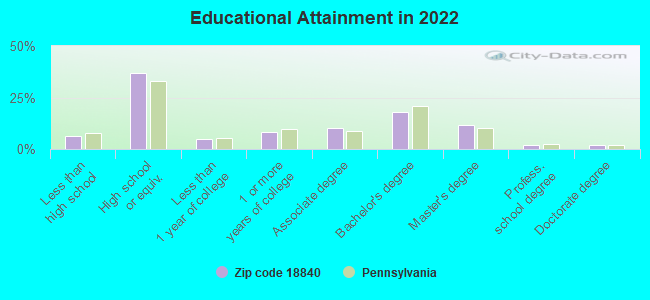
Private vs. public school enrollment:
Students in private schools in grades 1 to 8 (elementary and middle school): 92
Here:
7.6%
Pennsylvania:
15.7%
Students in private schools in grades 9 to 12 (high school): 23
Here:
4.1%
Pennsylvania:
13.4%
Students in private undergraduate colleges: 89
Here:
45.4%
Pennsylvania:
39.8%
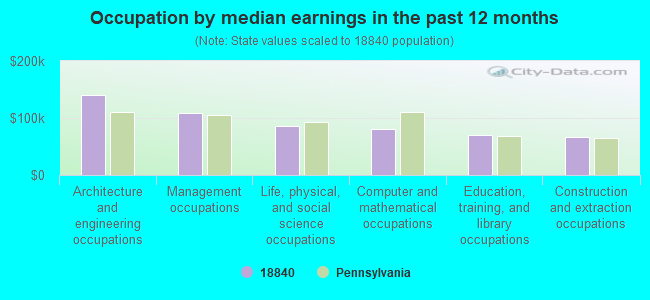
Occupation by median earnings in the past 12 months ($)
139,714Architecture and engineering occupations
109,408Management occupations
86,456Life, physical, and social science occupations
80,628Computer and mathematical occupations
70,908Education, training, and library occupations
65,939Construction and extraction occupations
Companies with federal contracts located in this zip code:
TWIN TIER HOSPITALITY LLC (255 SPRING STREET SUITE 10 in SAYRE, PA; small business) : $124,197 in 6 contractsfrom 2004 to 2005
Contracts for Lodging - Hotel/Motel by Army Signed by year:2000: $0; 2001: $0; 2002: $0; 2003: $0; 2004: $108,808; 2005: $15,389; 2006: $0.
Biggest contracts:
$90,364 with Army for Lodging - Hotel/Motel. Signed on 2004-10-07. Completion date: 2004-11-20.
$13,804, same as above.Signed on 2004-12-02. Completion date: 2004-11-20.
$8,400, same as above.Signed on 2005-05-27. Completion date: 2005-05-31.
$6,149, same as above.Signed on 2005-01-13. Completion date: 2004-11-20.
STAVER HYDRAULICS CO , INC (1 STOVER ACRES ST in SAYRE, PA; small business) : $65,143 in 15 contractsfrom 2004 to 2006
Contracts for Packing and Gasket Materials, Hose, Pipe, Tube, Lubrication, and Railing Fittings, Miscellaneous Electrical and Electronic Components by Defense Logistics Agency, Navy, Army Signed by year:2000: $0; 2001: $0; 2002: $0; 2003: $0; 2004: $6,240; 2005: $46,671; 2006: $12,232.
Biggest contracts:
$13,290 with Defense Logistics Agency for Packing and Gasket Materials. Signed on 2005-08-10. Completion date: 2005-10-10.
$8,385, same as above.Signed on 2006-03-22. Completion date: 2006-05-22.
$6,800, same as above.Signed on 2005-05-12. Completion date: 2005-07-12.
$4,858 with Defense Logistics Agency for Hose, Pipe, Tube, Lubrication, and Railing Fittings. Signed on 2005-10-14. Completion date: 2005-11-28.
Top industries in this zip code by the number of employees in 2005:
Health Care and Social Assistance: General Medical and Surgical Hospitals (over 1000 employees: 1 establishment)
Health Care and Social Assistance: All Other Outpatient Care Centers (500-999: 1)
Administrative and Support and Waste Management and Remediation Services: Temporary Help Services (100-249: 1, 1-4: 1)
Management of Companies and Enterprises: Offices of Other Holding Companies (100-249: 1)
People in group quarters in 2010:
48 people in nursing facilities/skilled-nursing facilities
People in group quarters in 2000:
50 people in nursing homes
23 people in other group homes
4 people in other noninstitutional group quarters
Fatal accident statistics in 2012:
Fatal accident count: 1
Vehicles involved in fatal accidents: 1
Fatal accidents caused by drunken drivers: 0
Fatalities: 1
Persons involved in fatal accidents: 3
Pedestrians involved in fatal accidents: 0
Fatal accident statistics in 2010:
Fatal accident count: 1
Vehicles involved in fatal accidents: 2
Fatal accidents caused by drunken drivers: 0
Fatalities: 1
Persons involved in fatal accidents: 6
Pedestrians involved in fatal accidents: 0
2008 - 2018 National Fire Incident Reporting System (NFIRS) incidents
According to the data from the years 2008 - 2018 the average number of fire incidents per year is 25. The highest number of fire incidents - 55 took place in 2016, and the least - 8 in 2010. The data has a declining trend.
When looking into fire subcategories, the most incidents belonged to: Structure Fires (50.4%), and Outside Fires (21.2%).
Fire incident types reported to NFIRS in Zip Code 18840


 Nearest zip codes: 18810, 14892, 18831, 14825, 18850, 18817.


 According to the data from the years 2008 - 2018 the average number of fire incidents per year is 25. The highest number of fire incidents - 55 took place in 2016, and the least - 8 in 2010. The data has a declining trend.
 When looking into fire subcategories, the most incidents belonged to: Structure Fires (50.4%), and Outside Fires (21.2%).