Estimated zip code population in 2022: 743 Zip code population in 2010: 919 Zip code population in 2000: 918
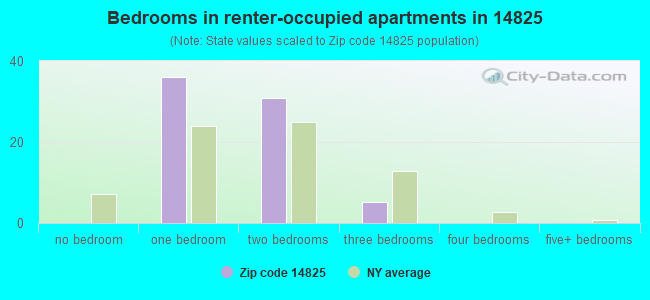
Houses and condos: 344 Renter-occupied apartments: 72
% of renters here:
23%
State:
46%
March 2022 cost of living index in zip code 14825: 93.5 (less than average, U.S. average is 100)
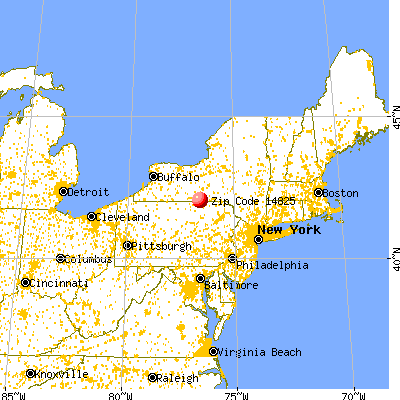
Land area: 16.9 sq. mi. Water area: 0.0 sq. mi.
Population density: 44 people per square mile
(very low).
OSM Map
General Map
Google Map
MSN Map
OSM Map
General Map
Google Map
MSN Map
OSM Map
General Map
Google Map
MSN Map
OSM Map
General Map
Google Map
MSN Map
Please wait while loading the map...
Real estate property taxes paid for housing units in 2022:
This zip code:
1.5% ($2,292)
New York:
1.5% ($6,180)
Median real estate property taxes paid for housing units with mortgages in 2022: $3,270 (2.1%) Median real estate property taxes paid for housing units with no mortgage in 2022: $1,445 (1.0%)
Business Search- 14 Million verified businesses
Males: 328
(44.3%)
Females: 414
(55.7%)
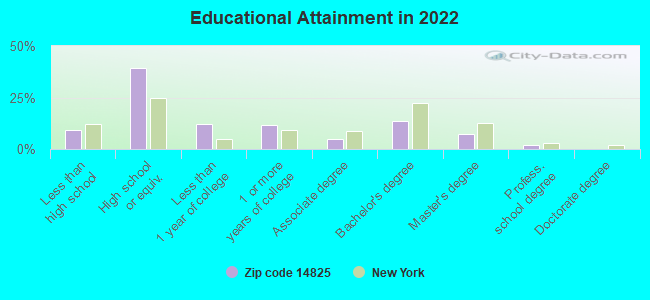
For population 25 years and over in 14825:
High school or higher: 90.1%
Bachelor's degree or higher: 23.3%
Graduate or professional degree: 9.7%
Unemployed: 1.7%
Mean travel time to work (commute): 28.1 minutes
For population 15 years and over in 14825:
Never married: 36.8%
Now married: 44.5%
Separated: 0.0%
Widowed: 6.6%
Divorced: 12.1%
Zip code 14825 compared to state average:
Median house value significantly below state average.
Unemployed percentage significantly below state average.
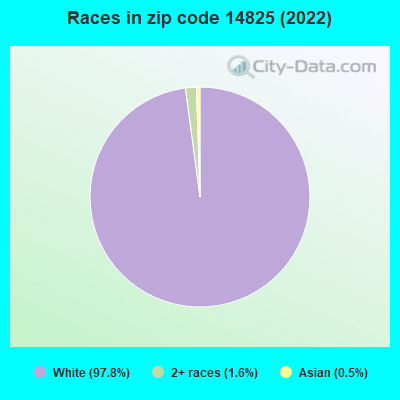
Black race population percentage significantly below state average.
Hispanic race population percentage significantly below state average.
Median age significantly above state average.
Foreign-born population percentage significantly below state average.
Renting percentage below state average.
Length of stay since moving in above state average.
Number of rooms per house above state average.
Percentage of population with a bachelor's degree or higher below state average.
Averages for the 2020 tax year for zip code 14825, filed in 2021:
Average Adjusted Gross Income (AGI) in 2020: $50,864 (Individual Income Tax Returns)
Here:
$50,864
State:
$90,930
Salary/wage: $44,280 (reported on 83.3% of returns)
Here:
$44,280
State:
$72,104
(% of AGI for various income ranges: 1108.8% for AGIs below $25k, 3143.8% for AGIs $25k-50k, 6462.0% for AGIs $50k-75k, 9253.3% for AGIs $75k-100k, 12916.7% for AGIs $100k-200k)
Taxable interest for individuals: $342 (reported on 33.3% of returns)
This zip code:
$342
New York:
$3,075
(% of AGI for various income ranges: 5.0% for AGIs below $25k, 20.0% for AGIs $25k-50k, 26.7% for AGIs $75k-100k, 43.3% for AGIs $100k-200k)
Ordinary dividends: $1,175 (reported on 11.1% of returns)
Here:
$1,175
State:
$11,095
(% of AGI for various income ranges: 94.0% for AGIs $50k-75k)
Net capital gain/loss in AGI: +$3,100 (reported on 5.6% of returns)
Here:
+$3,100
State:
+$44,925
(% of AGI for various income ranges: 77.5% for AGIs below $25k)
Profit/loss from business: +$6,700 (reported on 8.3% of returns)
Here:
+$6,700
State:
+$14,940
(% of AGI for various income ranges: 251.3% for AGIs below $25k)
Taxable individual retirement arrangement distribution: $11,167 (reported on 8.3% of returns)
14825:
$11,167
New York:
$19,609
(% of AGI for various income ranges: 418.8% for AGIs $25k-50k)
Earned income credit: $2,300 (reported on 13.9% of returns)
Here:
$2,300
State:
$2,138
(% of AGI for various income ranges: 143.8% for AGIs below $25k)
Percentage of individuals using paid preparers for their 2020 taxes: 102.8%
Here:
103%
State:
95%
(% for various income ranges: 100.0% for AGIs below $25k, 100.0% for AGIs $25k-50k, 100.0% for AGIs $50k-75k, 100.0% for AGIs $75k-100k, 125.0% for AGIs $100k-200k)
Averages for the 2012 tax year for zip code 14825, filed in 2013:
Average Adjusted Gross Income (AGI) in 2012: $45,460 (Individual Income Tax Returns)
Here:
$45,460
State:
$77,088
Salary/wage: $39,609 (reported on 85.0% of returns)
Here:
$39,609
State:
$60,593
(% of AGI for various income ranges: 75.9% for AGIs below $25k, 84.6% for AGIs $25k-50k, 73.6% for AGIs $50k-75k, 78.6% for AGIs $75k-100k, 61.4% for AGIs $100k-200k)
Taxable interest for individuals: $315 (reported on 32.5% of returns)
This zip code:
$315
New York:
$3,125
(% of AGI for various income ranges: 0.1% for AGIs below $25k, 0.1% for AGIs $25k-50k, 0.3% for AGIs $50k-75k, 0.1% for AGIs $75k-100k, 0.3% for AGIs $100k-200k)
Ordinary dividends: $520 (reported on 12.5% of returns)
Here:
$520
State:
$10,299
Profit/loss from business: +$3,475 (reported on 10.0% of returns)
Here:
+$3,475
State:
+$16,168
Taxable individual retirement arrangement distribution: $10,267 (reported on 7.5% of returns)
14825:
$10,267
New York:
$17,621
Total itemized deductions: $18,017 (18% of AGI, reported on 15.0% of returns)
Here:
$18,017
State:
$34,985
Here:
17.9% of AGI
State:
21.3% of AGI
(% of AGI for various income ranges: 13.9% for AGIs $50k-75k, 10.5% for AGIs $100k-200k)
Charity contributions: $1,175 (reported on 10.0% of returns)
Here:
$1,175
State:
$5,572
Taxes paid: $8,067 (reported on 15.0% of returns)
14825:
$8,067
State:
$18,656
(% of AGI for various income ranges: 4.7% for AGIs $50k-75k, 6.1% for AGIs $100k-200k)
Earned income credit: $2,075 (reported on 20.0% of returns)
Here:
$2,075
State:
$2,230
(% of AGI for various income ranges: 6.1% for AGIs below $25k, 1.1% for AGIs $25k-50k)
Percentage of individuals using paid preparers for their 2012 taxes: 65.0%
Here:
65%
State:
66%
(% for various income ranges: 62.5% for AGIs below $25k, 60.0% for AGIs $25k-50k, 71.4% for AGIs $50k-75k, 50.0% for AGIs $75k-100k, 100.0% for AGIs $100k-200k)
Averages for the 2004 tax year for zip code 14825, filed in 2005:
Average Adjusted Gross Income (AGI) in 2004: $34,711 (Individual Income Tax Returns)
Here:
$34,711
State:
$59,519
Salary/wage: $33,295 (reported on 86.0% of returns)
Here:
$33,295
State:
$50,673
(% of AGI for various income ranges: 80.5% for AGIs below $10k, 72.0% for AGIs $10k-25k, 88.3% for AGIs $25k-50k, 83.2% for AGIs $50k-75k, 85.0% for AGIs $75k-100k, 77.1% for AGIs over 100k)
Taxable interest for individuals: $436 (reported on 45.5% of returns)
This zip code:
$436
New York:
$2,377
(% of AGI for various income ranges: 1.8% for AGIs below $10k, 1.0% for AGIs $10k-25k, 0.3% for AGIs $25k-50k, 0.4% for AGIs $50k-75k, 0.2% for AGIs $75k-100k, 1.4% for AGIs over 100k)
Taxable dividends: $585 (reported on 14.6% of returns)
Here:
$585
State:
$5,394
(% of AGI for various income ranges: 1.0% for AGIs $10k-25k, 0.1% for AGIs $25k-50k, 0.1% for AGIs $50k-75k, 0.4% for AGIs $75k-100k)
Net capital gain/loss: +$421 (reported on 10.5% of returns)
Here:
+$421
State:
+$23,581
Profit/loss from business: +$3,617 (reported on 12.9% of returns)
Here:
+$3,617
State:
+$13,809
Total itemized deductions: $14,525 (21% of AGI, reported on 16.3% of returns)
Here:
$14,525
State:
$25,864
Here:
20.6% of AGI
State:
21.9% of AGI
Charity contributions deductions: $1,358 (2% of AGI, reported on 14.6% of returns)
Here:
$1,358
State:
$4,439
Here:
1.9% of AGI
State:
3.6% of AGI
Total tax: $4,138 (reported on 70.0% of returns)
14825:
$4,138
State:
$11,730
(% of AGI for various income ranges: 2.4% for AGIs below $10k, 3.5% for AGIs $10k-25k, 6.5% for AGIs $25k-50k, 9.0% for AGIs $50k-75k, 10.3% for AGIs $75k-100k, 14.3% for AGIs over 100k)
Earned income credit: $1,857 (reported on 21.2% of returns)
Here:
$1,857
State:
$1,757
Percentage of individuals using paid preparers for their 2004 taxes: 65.0%
Here:
65%
State:
67%
(% for various income ranges: 58.6% for AGIs below $10k, 64.2% for AGIs $10k-25k, 64.5% for AGIs $25k-50k, 68.0% for AGIs $50k-75k, 67.9% for AGIs $75k-100k, 92.3% for AGIs over 100k)
Household received Food Stamps/SNAP in the past 12 months: 32 Household did not receive Food Stamps/SNAP in the past 12 months: 280
Women who had a birth in the past 12 months: 4 (0 now married, 4 unmarried) Women who did not have a birth in the past 12 months: 184 (43 now married, 141 unmarried)
Housing units in zip code 14825 with a mortgage: 111 (13 second mortgage, 13 both second mortgage and home equity loan) Median monthly owner costs for units with a mortgage: $1,179 Median monthly owner costs for units without a mortgage: $401
Residents with income below the poverty level in 2022:
This zip code:
13.3%
Whole state:
14.3%
Residents with income below 50% of the poverty level in 2022:
This zip code:
3.8%
Whole state:
6.8%
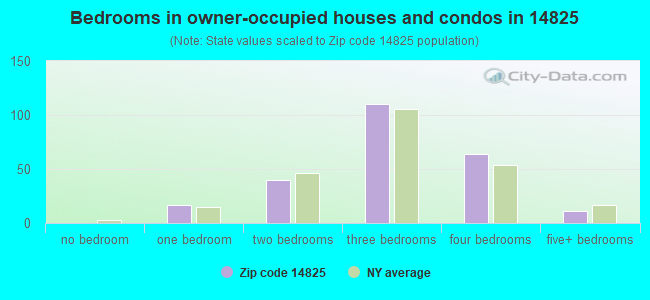
Median number of rooms in houses and condos:
Here:
6.6
State:
6.3
Median number of rooms in apartments:
Here:
4.5
State:
3.8
Notable locations in this zip code not listed on our city pages
In group quarters: 11 (-1 institutionalized population)
Size of family households: 126 2-persons, 37 3-persons, 15 4-persons, 17 5-persons, 10 6-persons
Size of nonfamily households: 91 1-person, 17 2-persons
35 married couples with children.
117 single-parent households (117 women).
100.1% of residents of 14825 zip code speak English at home.
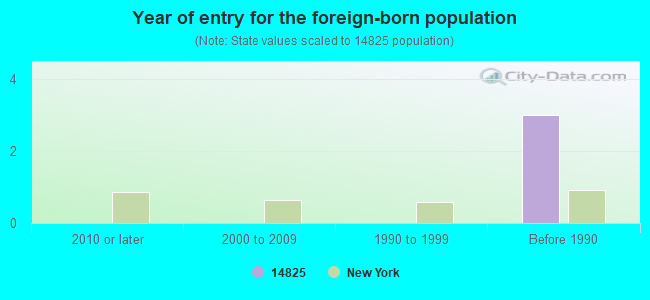
Foreign born population: 0 (0.0%)
:
0.0%
Whole state:
22.7%
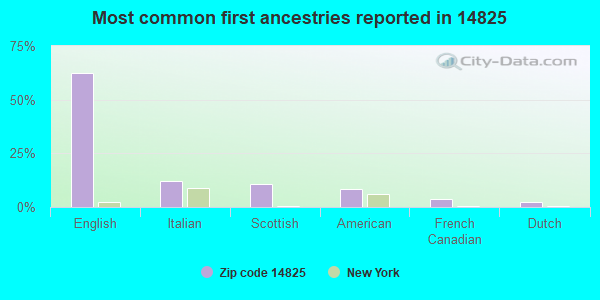
63%English
12%Italian
11%Scottish
8%American
4%French Canadian
2%Dutch
Year of entry for the foreign-born population
02010 or later
02000 to 2009
01990 to 1999
3Before 1990
Facilities with environmental interests located in this zip code:
CHEMUNG ES ( in CHEMUNG, NY)
(National Center for Education Statistics) - STATE ID-600101060001 Organizations: WAVERLY CSD (SCHOOL DISTRICT)
BAKER ROAD FACILITY (RTE 17 @ DRY CREEK RD in CHEMUNG, NY)
National Pollutant Discharge Elimination System NON-MAJOR (Tracking pollutant discharge elimination systems) - permit Business SIC classification: SEWERAGE SYSTEMS Organizations: CHEMUNG CO ELMIRA SD (CONTACT/OWNER)
Alternative names: CHEMUNG CO ELMIRA SD
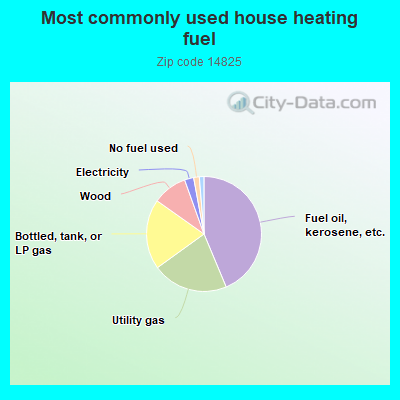
44.0%Fuel oil, kerosene, etc.
21.5%Utility gas
19.9%Bottled, tank, or LP gas
9.8%Wood
2.6%Electricity
1.6%No fuel used
1.3%Other fuel
Population in 1990: 615. Population change in the 1990s: +303 (+49.3%).
Place of birth for U.S.-born residents:
This state: 330
Northeast: 335
Midwest: 18
South: 22
West: 34
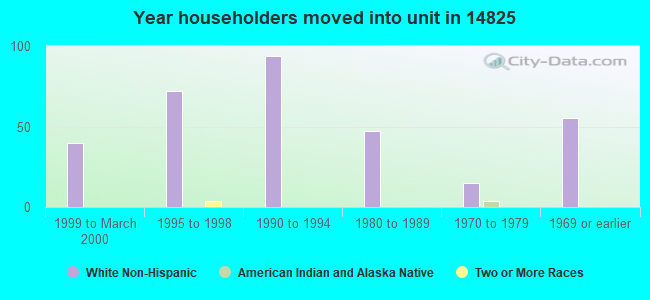
61% of the 14825 zip code residents lived in the same house 5 years ago. Out of people who lived in different houses, 56% lived in this county. Out of people who lived in different counties, 50% lived in New York.
99% of the 14825 zip code residents lived in the same house 1 year ago. Out of people who lived in different houses, 80% moved from different state.
Private vs. public school enrollment:
Students in private schools in grades 1 to 8 (elementary and middle school): 4
Here:
9.3%
New York:
15.6%
Students in private schools in grades 9 to 12 (high school): 10
Here:
14.9%
New York:
15.0%
Students in private undergraduate colleges:
Here:
0.0%
New York:
39.2%
Occupation by median earnings in the past 12 months ($)
88,243Management occupations
52,279Installation, maintenance, and repair occupations
38,453Food preparation and serving related occupations
36,764Office and administrative support occupations
36,048Construction and extraction occupations
11,358Education, training, and library occupations
Top industries in this zip code by the number of employees in 2005:
Other Services (except Public Administration): Religious Organizations (10-19 employees: 1 establishment, 1-4 employees: 2 establishments)
Wholesale Trade: Other Grocery and Related Products Merchant Wholesalers (10-19: 1)
Mining: Other Crushed and Broken Stone Mining and Quarrying (10-19: 1)
Accommodation and Food Services: Full-Service Restaurants (1-4: 1)
Professional, Scientific, and Technical Services: Surveying and Mapping (except Geophysical) Services (1-4: 1)
People in group quarters in 2010:
7 people in group homes intended for adults
People in group quarters in 2000:
7 people in homes for the mentally retarded
Home Mortgage Disclosure Act Aggregated Statistics For Year 2009 (Based on 2 partial tracts)
A) FHA, FSA/RHS & VA Home Purchase Loans
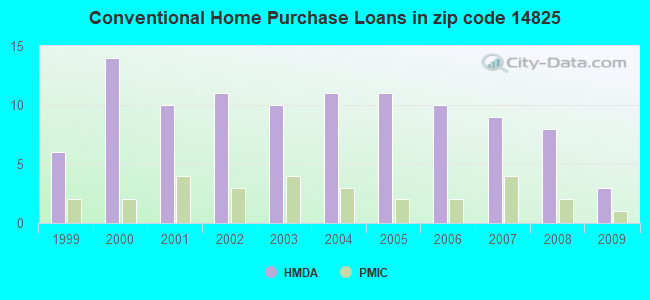
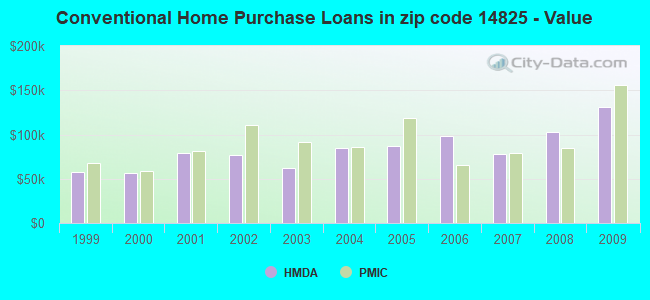
B) Conventional Home Purchase Loans
C) Refinancings
D) Home Improvement Loans
F) Non-occupant Loans on < 5 Family Dwellings (A B C & D)
G) Loans On Manufactured Home Dwelling (A B C & D)
Number
Average Value
Number
Average Value
Number
Average Value
Number
Average Value
Number
Average Value
Number
Average Value
LOANS ORIGINATED
1
$119,570
3
$130,927
20
$88,167
6
$30,650
2
$67,545
3
$70,257
APPLICATIONS APPROVED, NOT ACCEPTED
0
$0
1
$157,040
1
$171,790
1
$22,700
0
$0
1
$42,380
APPLICATIONS DENIED
1
$59,030
6
$35,065
6
$100,023
3
$7,947
1
$71,520
7
$37,246
APPLICATIONS WITHDRAWN
0
$0
0
$0
7
$131,576
0
$0
1
$138,120
0
$0
FILES CLOSED FOR INCOMPLETENESS
0
$0
0
$0
0
$0
0
$0
0
$0
0
$0
Aggregated Statistics For Year 2008 (Based on 2 partial tracts)
A) FHA, FSA/RHS & VA Home Purchase Loans
B) Conventional Home Purchase Loans
C) Refinancings
D) Home Improvement Loans
F) Non-occupant Loans on < 5 Family Dwellings (A B C & D)
G) Loans On Manufactured Home Dwelling (A B C & D)
Number
Average Value
Number
Average Value
Number
Average Value
Number
Average Value
Number
Average Value
Number
Average Value
LOANS ORIGINATED
2
$84,950
8
$103,304
12
$92,109
9
$20,433
1
$104,440
5
$56,912
APPLICATIONS APPROVED, NOT ACCEPTED
0
$0
1
$37,460
1
$102,170
1
$17,780
1
$37,460
1
$37,460
APPLICATIONS DENIED
0
$0
5
$77,724
10
$90,778
9
$17,532
2
$47,300
5
$37,688
APPLICATIONS WITHDRAWN
0
$0
1
$26,490
4
$110,682
1
$126,010
0
$0
0
$0
FILES CLOSED FOR INCOMPLETENESS
1
$51,460
0
$0
2
$58,650
0
$0
0
$0
0
$0
Aggregated Statistics For Year 2007 (Based on 2 partial tracts)
B) Conventional Home Purchase Loans
C) Refinancings
D) Home Improvement Loans
F) Non-occupant Loans on < 5 Family Dwellings (A B C & D)
G) Loans On Manufactured Home Dwelling (A B C & D)
Number
Average Value
Number
Average Value
Number
Average Value
Number
Average Value
Number
Average Value
LOANS ORIGINATED
9
$77,572
13
$74,021
16
$19,937
1
$26,110
5
$62,208
APPLICATIONS APPROVED, NOT ACCEPTED
1
$21,190
5
$77,194
1
$65,460
0
$0
1
$102,550
APPLICATIONS DENIED
3
$63,320
15
$72,577
9
$22,998
2
$19,490
2
$35,000
APPLICATIONS WITHDRAWN
2
$46,730
11
$95,632
2
$18,540
0
$0
1
$34,810
FILES CLOSED FOR INCOMPLETENESS
0
$0
0
$0
0
$0
0
$0
0
$0
Aggregated Statistics For Year 2006 (Based on 2 partial tracts)
A) FHA, FSA/RHS & VA Home Purchase Loans
B) Conventional Home Purchase Loans
C) Refinancings
D) Home Improvement Loans
F) Non-occupant Loans on < 5 Family Dwellings (A B C & D)
G) Loans On Manufactured Home Dwelling (A B C & D)
Number
Average Value
Number
Average Value
Number
Average Value
Number
Average Value
Number
Average Value
Number
Average Value
LOANS ORIGINATED
1
$101,410
10
$98,157
17
$71,117
8
$16,698
1
$34,430
3
$45,660
APPLICATIONS APPROVED, NOT ACCEPTED
0
$0
1
$66,600
4
$96,870
2
$20,245
0
$0
0
$0
APPLICATIONS DENIED
1
$51,840
7
$87,573
22
$82,629
12
$37,966
1
$67,360
8
$61,774
APPLICATIONS WITHDRAWN
0
$0
4
$92,898
11
$84,727
0
$0
1
$121,840
0
$0
FILES CLOSED FOR INCOMPLETENESS
0
$0
0
$0
0
$0
0
$0
0
$0
0
$0
Aggregated Statistics For Year 2005 (Based on 2 partial tracts)
A) FHA, FSA/RHS & VA Home Purchase Loans
B) Conventional Home Purchase Loans
C) Refinancings
D) Home Improvement Loans
F) Non-occupant Loans on < 5 Family Dwellings (A B C & D)
G) Loans On Manufactured Home Dwelling (A B C & D)
Number
Average Value
Number
Average Value
Number
Average Value
Number
Average Value
Number
Average Value
Number
Average Value
LOANS ORIGINATED
2
$61,110
11
$87,342
14
$70,247
11
$14,001
3
$49,193
2
$42,000
APPLICATIONS APPROVED, NOT ACCEPTED
0
$0
1
$80,220
4
$84,855
2
$27,055
0
$0
3
$54,617
APPLICATIONS DENIED
0
$0
8
$55,578
22
$76,213
9
$11,436
3
$14,883
8
$53,780
APPLICATIONS WITHDRAWN
0
$0
2
$50,515
13
$94,978
0
$0
0
$0
1
$46,540
FILES CLOSED FOR INCOMPLETENESS
0
$0
0
$0
2
$59,785
0
$0
0
$0
0
$0
Aggregated Statistics For Year 2004 (Based on 2 partial tracts)
B) Conventional Home Purchase Loans
C) Refinancings
D) Home Improvement Loans
F) Non-occupant Loans on < 5 Family Dwellings (A B C & D)
G) Loans On Manufactured Home Dwelling (A B C & D)
Number
Average Value
Number
Average Value
Number
Average Value
Number
Average Value
Number
Average Value
LOANS ORIGINATED
11
$84,762
17
$70,961
7
$21,623
1
$20,430
3
$47,553
APPLICATIONS APPROVED, NOT ACCEPTED
3
$73,537
6
$69,183
1
$30,650
1
$45,410
1
$74,540
APPLICATIONS DENIED
7
$53,409
34
$78,384
8
$25,021
1
$25,730
7
$48,436
APPLICATIONS WITHDRAWN
2
$77,570
14
$85,032
3
$23,713
1
$58,270
1
$65,840
FILES CLOSED FOR INCOMPLETENESS
1
$82,110
2
$113,330
0
$0
0
$0
0
$0
Aggregated Statistics For Year 2003 (Based on 2 partial tracts)
A) FHA, FSA/RHS & VA Home Purchase Loans
B) Conventional Home Purchase Loans
C) Refinancings
D) Home Improvement Loans
F) Non-occupant Loans on < 5 Family Dwellings (A B C & D)
Number
Average Value
Number
Average Value
Number
Average Value
Number
Average Value
Number
Average Value
LOANS ORIGINATED
2
$59,220
10
$62,587
34
$74,278
9
$14,968
2
$63,380
APPLICATIONS APPROVED, NOT ACCEPTED
0
$0
2
$63,380
6
$78,707
1
$15,140
0
$0
APPLICATIONS DENIED
0
$0
7
$58,381
22
$71,156
5
$18,088
1
$54,490
APPLICATIONS WITHDRAWN
0
$0
1
$21,950
14
$75,248
2
$30,085
1
$34,430
FILES CLOSED FOR INCOMPLETENESS
0
$0
0
$0
3
$92,203
0
$0
0
$0
Aggregated Statistics For Year 2002 (Based on 2 partial tracts)
A) FHA, FSA/RHS & VA Home Purchase Loans
B) Conventional Home Purchase Loans
C) Refinancings
D) Home Improvement Loans
F) Non-occupant Loans on < 5 Family Dwellings (A B C & D)
Number
Average Value
Number
Average Value
Number
Average Value
Number
Average Value
Number
Average Value
LOANS ORIGINATED
2
$51,085
11
$77,400
24
$80,378
9
$22,620
2
$32,355
APPLICATIONS APPROVED, NOT ACCEPTED
1
$35,570
3
$40,363
6
$70,508
2
$7,755
2
$35,570
APPLICATIONS DENIED
0
$0
9
$43,684
26
$65,158
6
$13,182
1
$29,520
APPLICATIONS WITHDRAWN
1
$47,300
0
$0
12
$71,928
1
$15,140
0
$0
FILES CLOSED FOR INCOMPLETENESS
0
$0
0
$0
4
$120,330
0
$0
0
$0
Aggregated Statistics For Year 2001 (Based on 2 partial tracts)
A) FHA, FSA/RHS & VA Home Purchase Loans
B) Conventional Home Purchase Loans
C) Refinancings
D) Home Improvement Loans
Number
Average Value
Number
Average Value
Number
Average Value
Number
Average Value
LOANS ORIGINATED
2
$37,270
10
$78,821
18
$68,259
12
$15,798
APPLICATIONS APPROVED, NOT ACCEPTED
0
$0
6
$69,752
2
$39,355
0
$0
APPLICATIONS DENIED
0
$0
12
$54,931
17
$65,775
3
$8,703
APPLICATIONS WITHDRAWN
0
$0
1
$67,730
12
$59,724
1
$20,430
FILES CLOSED FOR INCOMPLETENESS
0
$0
0
$0
3
$53,607
0
$0
Aggregated Statistics For Year 2000 (Based on 2 partial tracts)
A) FHA, FSA/RHS & VA Home Purchase Loans
B) Conventional Home Purchase Loans
C) Refinancings
D) Home Improvement Loans
F) Non-occupant Loans on < 5 Family Dwellings (A B C & D)
Number
Average Value
Number
Average Value
Number
Average Value
Number
Average Value
Number
Average Value
LOANS ORIGINATED
1
$81,360
14
$56,976
12
$58,368
8
$13,718
0
$0
APPLICATIONS APPROVED, NOT ACCEPTED
0
$0
7
$52,381
2
$73,600
1
$8,700
0
$0
APPLICATIONS DENIED
1
$48,440
34
$39,843
12
$51,462
7
$19,623
1
$38,220
APPLICATIONS WITHDRAWN
0
$0
2
$28,760
8
$49,145
0
$0
0
$0
FILES CLOSED FOR INCOMPLETENESS
0
$0
0
$0
1
$88,550
0
$0
0
$0
Aggregated Statistics For Year 1999 (Based on 1 partial tract)
A) FHA, FSA/RHS & VA Home Purchase Loans
B) Conventional Home Purchase Loans
C) Refinancings
D) Home Improvement Loans
F) Non-occupant Loans on < 5 Family Dwellings (A B C & D)
Detailed PMIC statistics for the following Tracts:0110.00
2002 - 2018 National Fire Incident Reporting System (NFIRS) incidents
Based on the data from the years 2002 - 2018 the average number of fires per year is 6. The highest number of reported fire incidents - 20 took place in 2014, and the least - 1 in 2003. The data has a rising trend.
When looking into fire subcategories, the most incidents belonged to: Outside Fires (35.5%), and Structure Fires (32.7%).
Fire incident types reported to NFIRS in Zip Code 14825


 Nearest zip codes: 14861, 14892, 14859, 18840, 14901, 14838.


 Based on the data from the years 2002 - 2018 the average number of fires per year is 6. The highest number of reported fire incidents - 20 took place in 2014, and the least - 1 in 2003. The data has a rising trend.
 When looking into fire subcategories, the most incidents belonged to: Outside Fires (35.5%), and Structure Fires (32.7%).