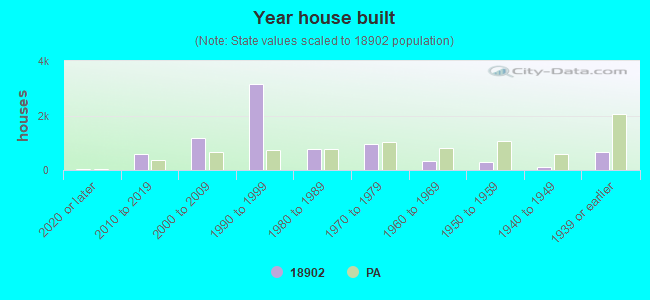
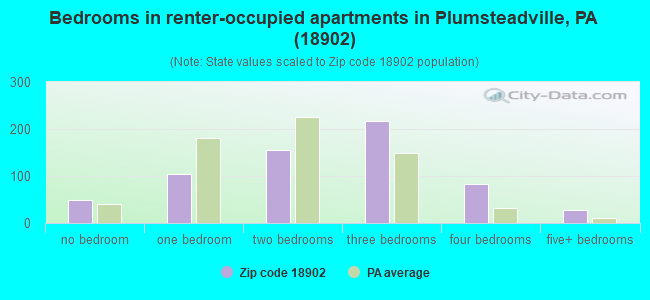
Houses and condos: 8,220 Renter-occupied apartments: 644
% of renters here:
8%
State:
31%
March 2022 cost of living index in zip code 18902: 103.1 (near average, U.S. average is 100)
Land area: 27.8 sq. mi. Water area: 0.1 sq. mi.
Population density: 812 people per square mile
(low).
OSM Map
Google Map
MSN Map
OSM Map
General Map
Google Map
MSN Map
OSM Map
Google Map
MSN Map
OSM Map
Google Map
MSN Map
Please wait while loading the map...
Real estate property taxes paid for housing units in 2022:
This zip code:
1.1% ($7,510)
Pennsylvania:
1.3% ($3,094)
Median real estate property taxes paid for housing units with mortgages in 2022: $7,680 (1.1%) Median real estate property taxes paid for housing units with no mortgage in 2022: $7,128 (1.1%)
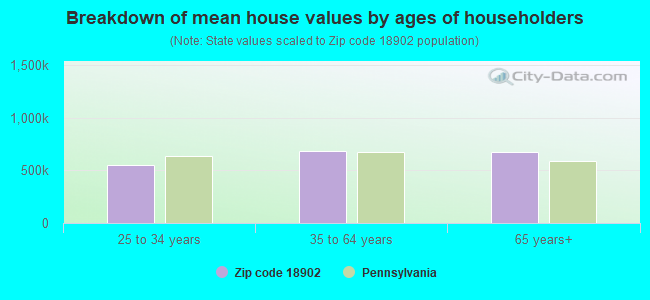
Estimated median house/condo value in 2022: $668,342
18902:
$668,342
Pennsylvania:
$245,500
According to our research of Pennsylvania and other state lists, there were 7 registered sex offenders living in 18902 zip code as of May 28, 2024. The ratio of all residents to sex offenders in zip code 18902 is 3,057 to 1. The ratio of registered sex offenders to all residents in this zip code is much lower than the state average.
Median resident age:
This zip code:
45.2 years
Pennsylvania median age:
40.9 years
Average household size:
This zip code:
2.8 people
Pennsylvania:
2.4 people
Averages for the 2020 tax year for zip code 18902, filed in 2021:
Average Adjusted Gross Income (AGI) in 2020: $172,628 (Individual Income Tax Returns)
Here:
$172,628
State:
$75,707
Salary/wage: $139,036 (reported on 83.7% of returns)
Here:
$139,036
State:
$62,806
(% of AGI for various income ranges: 1216.1% for AGIs below $25k, 3764.6% for AGIs $25k-50k, 6429.6% for AGIs $50k-75k, 9643.8% for AGIs $75k-100k, 20000.9% for AGIs $100k-200k, 108772.5% for AGIs over 200k)
Taxable interest for individuals: $2,263 (reported on 50.8% of returns)
This zip code:
$2,263
Pennsylvania:
$1,633
(% of AGI for various income ranges: 29.9% for AGIs below $25k, 52.4% for AGIs $25k-50k, 83.8% for AGIs $50k-75k, 95.3% for AGIs $75k-100k, 168.3% for AGIs $100k-200k, 1054.5% for AGIs over 200k)
Ordinary dividends: $11,033 (reported on 44.5% of returns)
Here:
$11,033
State:
$7,382
(% of AGI for various income ranges: 59.5% for AGIs below $25k, 157.0% for AGIs $25k-50k, 278.0% for AGIs $50k-75k, 363.4% for AGIs $75k-100k, 629.9% for AGIs $100k-200k, 4920.9% for AGIs over 200k)
Net capital gain/loss in AGI: +$43,918 (reported on 39.7% of returns)
Here:
+$43,918
State:
+$23,522
(% of AGI for various income ranges: 38.9% for AGIs below $25k, 98.0% for AGIs $25k-50k, 191.3% for AGIs $50k-75k, 331.9% for AGIs $75k-100k, 730.7% for AGIs $100k-200k, 21841.5% for AGIs over 200k)
Profit/loss from business: +$32,619 (reported on 18.2% of returns)
Here:
+$32,619
State:
+$16,274
(% of AGI for various income ranges: 150.8% for AGIs below $25k, 242.4% for AGIs $25k-50k, 501.9% for AGIs $50k-75k, 590.0% for AGIs $75k-100k, 1218.5% for AGIs $100k-200k, 4823.2% for AGIs over 200k)
Taxable individual retirement arrangement distribution: $33,416 (reported on 12.4% of returns)
18902:
$33,416
Pennsylvania:
$18,583
(% of AGI for various income ranges: 85.9% for AGIs below $25k, 182.2% for AGIs $25k-50k, 358.8% for AGIs $50k-75k, 533.0% for AGIs $75k-100k, 1243.8% for AGIs $100k-200k, 2724.4% for AGIs over 200k)
Self-employed (Keogh) retirement plans: $24,396 (reported on 2.4% of returns)
18902:
$24,396
Pennsylvania:
$25,407
(% of AGI for various income ranges: 61.2% for AGIs $50k-75k, 68.7% for AGIs $100k-200k, 637.1% for AGIs over 200k)
Total itemized deductions: $36,251 (reported on 22.9% of returns)
Here:
$36,251
State:
$34,850
(% of AGI for various income ranges: 162.0% for AGIs below $25k, 274.1% for AGIs $25k-50k, 561.7% for AGIs $50k-75k, 952.6% for AGIs $75k-100k, 1656.0% for AGIs $100k-200k, 7022.1% for AGIs over 200k)
Charity contributions: $9,409 (reported on 19.8% of returns)
Here:
$9,409
State:
$12,392
(% of AGI for various income ranges: 4.6% for AGIs below $25k, 22.5% for AGIs $25k-50k, 39.1% for AGIs $50k-75k, 90.2% for AGIs $75k-100k, 234.7% for AGIs $100k-200k, 2038.5% for AGIs over 200k)
Taxes paid: $9,302 (reported on 22.8% of returns)
18902:
$9,302
State:
$8,200
(% of AGI for various income ranges: 24.6% for AGIs below $25k, 66.7% for AGIs $25k-50k, 167.2% for AGIs $50k-75k, 305.1% for AGIs $75k-100k, 539.5% for AGIs $100k-200k, 1589.5% for AGIs over 200k)
Earned income credit: $1,678 (reported on 3.8% of returns)
Here:
$1,678
State:
$2,100
(% of AGI for various income ranges: 27.7% for AGIs below $25k, 36.7% for AGIs $25k-50k)
Percentage of individuals using paid preparers for their 2020 taxes: 91.6%
Here:
92%
State:
92%
(% for various income ranges: 88.8% for AGIs below $25k, 92.5% for AGIs $25k-50k, 93.3% for AGIs $50k-75k, 91.8% for AGIs $75k-100k, 91.4% for AGIs $100k-200k, 93.2% for AGIs over 200k)
Averages for the 2012 tax year for zip code 18902, filed in 2013:
Average Adjusted Gross Income (AGI) in 2012: $144,343 (Individual Income Tax Returns)
Here:
$144,343
State:
$61,346
Salary/wage: $123,243 (reported on 86.0% of returns)
Here:
$123,243
State:
$51,902
(% of AGI for various income ranges: 70.9% for AGIs below $25k, 73.7% for AGIs $25k-50k, 67.8% for AGIs $50k-75k, 69.8% for AGIs $75k-100k, 79.7% for AGIs $100k-200k, 71.9% for AGIs over 200k)
Taxable interest for individuals: $1,949 (reported on 53.8% of returns)
This zip code:
$1,949
Pennsylvania:
$1,588
(% of AGI for various income ranges: 2.7% for AGIs below $25k, 1.4% for AGIs $25k-50k, 1.1% for AGIs $50k-75k, 1.0% for AGIs $75k-100k, 0.7% for AGIs $100k-200k, 0.6% for AGIs over 200k)
Ordinary dividends: $7,244 (reported on 44.3% of returns)
Here:
$7,244
State:
$5,827
(% of AGI for various income ranges: 4.5% for AGIs below $25k, 2.4% for AGIs $25k-50k, 2.9% for AGIs $50k-75k, 3.0% for AGIs $75k-100k, 1.6% for AGIs $100k-200k, 2.3% for AGIs over 200k)
Net capital gain/loss in AGI: +$13,855 (reported on 36.5% of returns)
Here:
+$13,855
State:
+$14,495
(% of AGI for various income ranges: 1.2% for AGIs below $25k, 0.5% for AGIs $25k-50k, 0.7% for AGIs $50k-75k, 1.3% for AGIs $75k-100k, 1.4% for AGIs $100k-200k, 4.8% for AGIs over 200k)
Profit/loss from business: +$30,624 (reported on 17.7% of returns)
Here:
+$30,624
State:
+$16,268
(% of AGI for various income ranges: 9.5% for AGIs below $25k, 6.7% for AGIs $25k-50k, 6.5% for AGIs $50k-75k, 4.5% for AGIs $75k-100k, 4.1% for AGIs $100k-200k, 3.1% for AGIs over 200k)
Taxable individual retirement arrangement distribution: $30,305 (reported on 12.9% of returns)
18902:
$30,305
Pennsylvania:
$14,550
(% of AGI for various income ranges: 4.3% for AGIs below $25k, 3.4% for AGIs $25k-50k, 4.5% for AGIs $50k-75k, 4.1% for AGIs $75k-100k, 3.1% for AGIs $100k-200k, 2.3% for AGIs over 200k)
Self-employment retirement plans: $21,186 (reported on 2.3% of returns)
18902:
$21,186
Pennsylvania:
$20,922
(% of AGI for various income ranges: 0.7% for AGIs $50k-75k, 0.3% for AGIs $100k-200k, 0.4% for AGIs over 200k)
Total itemized deductions: $37,725 (16% of AGI, reported on 57.8% of returns)
Here:
$37,725
State:
$23,538
Here:
16.4% of AGI
State:
18.4% of AGI
(% of AGI for various income ranges: 20.0% for AGIs below $25k, 17.4% for AGIs $25k-50k, 20.2% for AGIs $50k-75k, 20.6% for AGIs $75k-100k, 18.8% for AGIs $100k-200k, 12.8% for AGIs over 200k)
Charity contributions: $6,357 (reported on 51.9% of returns)
Here:
$6,357
State:
$4,025
(% of AGI for various income ranges: 0.9% for AGIs below $25k, 1.3% for AGIs $25k-50k, 1.3% for AGIs $50k-75k, 1.7% for AGIs $75k-100k, 1.6% for AGIs $100k-200k, 2.7% for AGIs over 200k)
Taxes paid: $17,689 (reported on 57.7% of returns)
18902:
$17,689
State:
$9,982
(% of AGI for various income ranges: 5.4% for AGIs below $25k, 6.0% for AGIs $25k-50k, 7.6% for AGIs $50k-75k, 8.6% for AGIs $75k-100k, 8.7% for AGIs $100k-200k, 6.4% for AGIs over 200k)
Earned income credit: $1,683 (reported on 4.3% of returns)
Here:
$1,683
State:
$2,106
(% of AGI for various income ranges: 1.9% for AGIs below $25k, 0.6% for AGIs $25k-50k)
Percentage of individuals using paid preparers for their 2012 taxes: 57.8%
Here:
58%
State:
53%
(% for various income ranges: 49.1% for AGIs below $25k, 52.6% for AGIs $25k-50k, 60.7% for AGIs $50k-75k, 60.5% for AGIs $75k-100k, 59.0% for AGIs $100k-200k, 70.8% for AGIs over 200k)
Likely homosexual households (counted as self-reported same-sex unmarried-partner households)
Lesbian couples: 0.2% of all households
Gay men: 0.3% of all households
Household received Food Stamps/SNAP in the past 12 months: 141 Household did not receive Food Stamps/SNAP in the past 12 months: 7,903
Women who had a birth in the past 12 months: 101 (109 now married, 0 unmarried) Women who did not have a birth in the past 12 months: 3,971 (1,949 now married, 2,008 unmarried)
Housing units in zip code 18902 with a mortgage: 5,057 (845 second mortgage, 796 both second mortgage and home equity loan) Houses without a mortgage: 371
Median monthly owner costs for units with a mortgage: $2,956 Median monthly owner costs for units without a mortgage: $1,041
Residents with income below the poverty level in 2022:
This zip code:
3.1%
Whole state:
11.8%
Residents with income below 50% of the poverty level in 2022:
This zip code:
2.2%
Whole state:
6.1%
Median number of rooms in houses and condos:
Here:
10.0
State:
6.8
Median number of rooms in apartments:
Here:
5.7
State:
4.3
Notable locations in this zip code not listed on our city pages
Notable locations in zip code 18902: Curly Hill Acres (A), Valley View Mobile Home Park (B), Curley Hill Acres (C), Skyron Aero Industrial Park (D), Old Mill Estates (E), Keeble Acres (F), Durham Lea (G), Carvers Run (H), Valley View Village (I), Central Bucks Industrial Aero Park (J), Hunters Run (K), Solebury Farms Estates (L), Honey Hollow (M), Durham Village (N), Red Gate Farm (O), Highland Park (P), Yorkshire Estates (Q), Spring Hill (R), Sunnyside Acres (S), Cranberry Hill (T). Display/hide their locations on the map
Churches in zip code 18902 include: Christ Community Church (A), Lighthouse Baptist Church (B), Convenant Presbyterian Church (C), Buckingham Friends Meeting (D), Pleasant Ridge Church of Danboro (E), Plumstead Friends Meeting (F). Display/hide their locations on the map
In group quarters: 3 (-1 institutionalized population)
Size of family households: 2,723 2-persons, 1,482 3-persons, 1,277 4-persons, 804 5-persons, 101 6-persons, 34 7-or-more-persons
Size of nonfamily households: 1,206 1-person, 350 2-persons, 64 3-persons
4,201 married couples with children.
706 single-parent households (552 men, 154 women).
91.7% of residents of 18902 zip code speak English at home.
2.3% of residents speak Spanish at home (67% very well, 18% well, 12% not well, 4% not at all).
2.9% of residents speak other Indo-European language at home (86% very well, 10% well, 5% not well).
2.3% of residents speak Asian or Pacific Island language at home (56% very well, 25% well, 17% not well, 2% not at all).
0.2% of residents speak other language at home (100% very well).
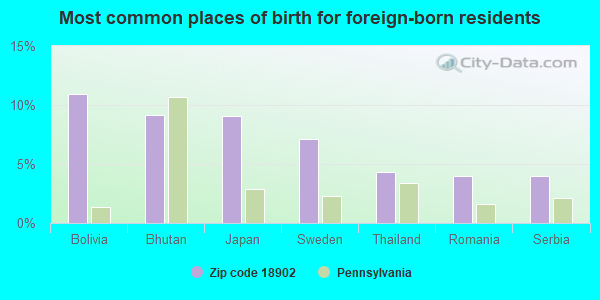
Foreign born population: 1,875 (8.3%) (71.7% of them are naturalized citizens)
This zip code:
8.3%
Whole state:
7.5%
11%Bolivia
9%Bhutan
9%Japan
7%Sweden
4%Thailand
4%Romania
4%Serbia
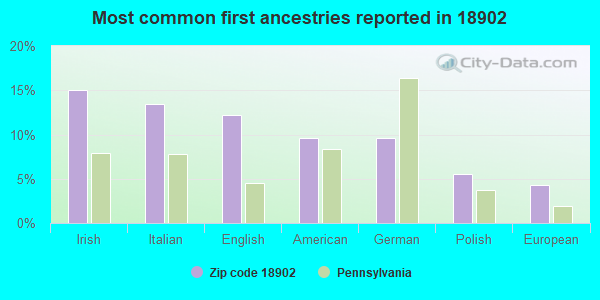
15%Irish
13%Italian
12%English
10%American
10%German
6%Polish
4%European
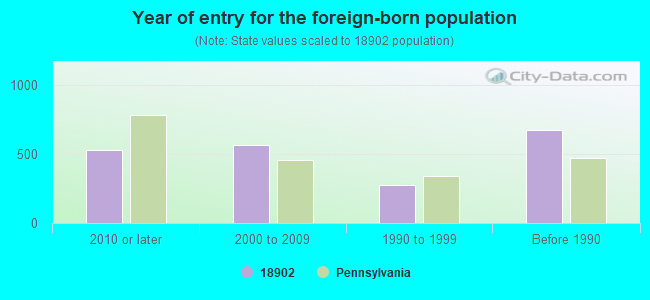
Year of entry for the foreign-born population
5322010 or later
5692000 to 2009
2741990 to 1999
679Before 1990
Housing units lacking complete plumbing facilities: 0.4% Housing units lacking complete kitchen facilities: 0.6%
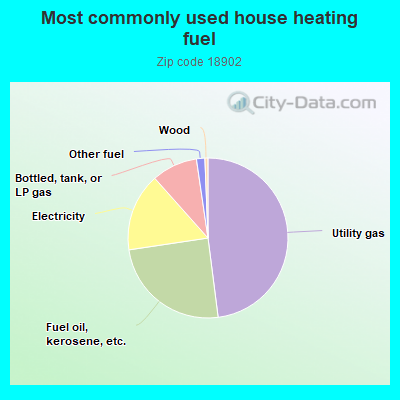
47.7%Utility gas
24.5%Fuel oil, kerosene, etc.
15.7%Electricity
9.2%Bottled, tank, or LP gas
1.7%Other fuel
0.6%Wood
Place of birth for U.S.-born residents:
This state: 12,536
Northeast: 5,184
Midwest: 1,261
South: 1,243
West: 377
95% of the 18902 zip code residents lived in the same house 1 year ago. Out of people who lived in different houses, 36% moved from this county. Out of people who lived in different houses, 25% moved from different county within same state. Out of people who lived in different houses, 43% moved from different state. Out of people who lived in different houses, 1% moved from abroad.
Private vs. public school enrollment:
Students in private schools in grades 1 to 8 (elementary and middle school): 204
Here:
8.0%
Pennsylvania:
15.7%
Students in private schools in grades 9 to 12 (high school): 97
Here:
5.5%
Pennsylvania:
13.4%
Students in private undergraduate colleges: 167
Here:
22.6%
Pennsylvania:
39.8%
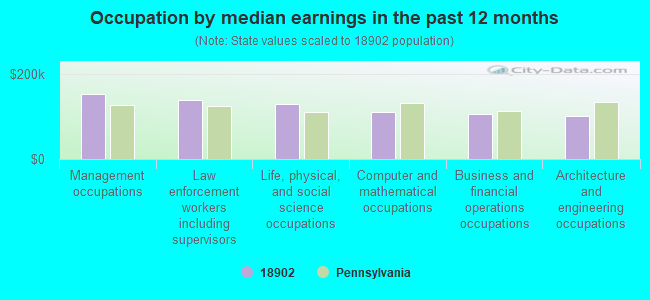
Occupation by median earnings in the past 12 months ($)
153,244Management occupations
137,882Law enforcement workers including supervisors
129,915Life, physical, and social science occupations
111,287Computer and mathematical occupations
105,926Business and financial operations occupations
101,527Architecture and engineering occupations
Top industries in this zip code by the number of employees in 2005:
Administrative and Support and Waste Management and Remediation Services: Landscaping Services (20-49 employees: 1 establishment, 1-4 employees: 3 establishments)
Real Estate and Rental and Leasing: Offices of Real Estate Agents and Brokers (5-9: 1, 1-4: 1)
Arts, Entertainment, and Recreation: Fitness and Recreational Sports Centers (5-9: 1, 1-4: 1)
Construction: New Multifamily Housing Construction (except Operative Builders) (5-9: 1)
Fatal accident statistics in 2014:
Fatal accident count: 2
Vehicles involved in fatal accidents: 4
Fatal accidents caused by drunken drivers: 0
Fatalities: 3
Persons involved in fatal accidents: 4
Pedestrians involved in fatal accidents: 0
Fatal accident statistics in 2013:
Fatal accident count: 1
Vehicles involved in fatal accidents: 1
Fatal accidents caused by drunken drivers: 0
Fatalities: 1
Persons involved in fatal accidents: 1
Pedestrians involved in fatal accidents: 0
2007 - 2018 National Fire Incident Reporting System (NFIRS) incidents
Based on the data from the years 2007 - 2018 the average number of fire incidents per year is 18. The highest number of reported fire incidents - 36 took place in 2012, and the least - 1 in 2008. The data has a growing trend.
When looking into fire subcategories, the most incidents belonged to: Structure Fires (62.4%), and Outside Fires (33.5%).
Fire incident types reported to NFIRS in Zip Code 18902


 Based on the data from the years 2007 - 2018 the average number of fire incidents per year is 18. The highest number of reported fire incidents - 36 took place in 2012, and the least - 1 in 2008. The data has a growing trend.
 When looking into fire subcategories, the most incidents belonged to: Structure Fires (62.4%), and Outside Fires (33.5%).