Estimated zip code population in 2022: 6,501 Zip code population in 2010: 6,195 Zip code population in 2000: 2,891
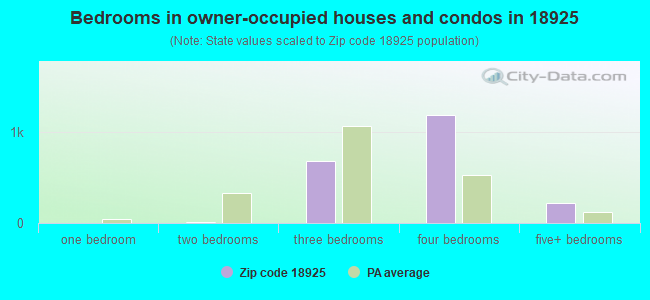
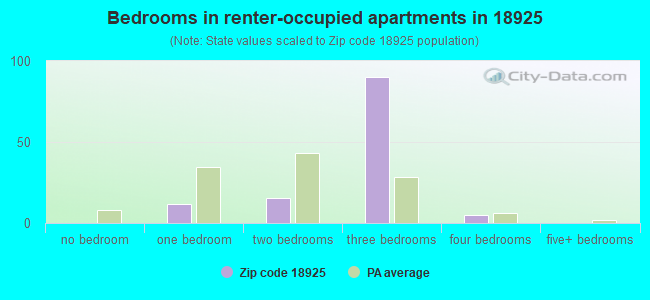
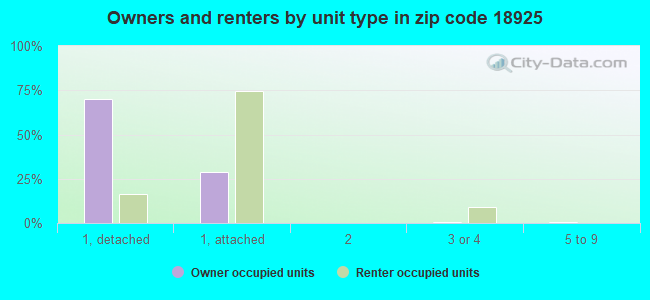
Houses and condos: 2,264 Renter-occupied apartments: 125
% of renters here:
6%
State:
31%
March 2022 cost of living index in zip code 18925: 109.4 (more than average, U.S. average is 100)
Land area: 10.7 sq. mi. Water area: 0.1 sq. mi.
Population density: 605 people per square mile
(low).
OSM Map
General Map
Google Map
MSN Map
OSM Map
General Map
Google Map
MSN Map
OSM Map
General Map
Google Map
MSN Map
OSM Map
General Map
Google Map
MSN Map
Please wait while loading the map...
Real estate property taxes paid for housing units in 2022:
This zip code:
1.1% ($7,629)
Pennsylvania:
1.3% ($3,094)
Median real estate property taxes paid for housing units with mortgages in 2022: $7,917 (1.1%) Median real estate property taxes paid for housing units with no mortgage in 2022: $6,888 (1.2%)
Business Search- 14 Million verified businesses
Males: 3,213
(49.4%)
Females: 3,287
(50.6%)
For population 25 years and over in 18925:
High school or higher: 101.2%
Bachelor's degree or higher: 71.4%
Graduate or professional degree: 34.3%
Unemployed: 1.7%
Mean travel time to work (commute): 34.4 minutes
For population 15 years and over in 18925:
Never married: 26.1%
Now married: 64.8%
Separated: 0.3%
Widowed: 3.3%
Divorced: 5.4%
Zip code 18925 compared to state average:
Median household income significantly above state average.
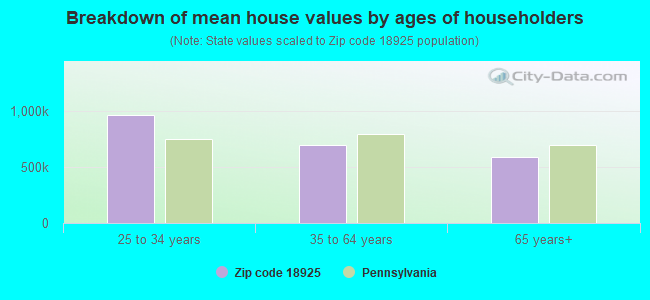
Median house value significantly above state average.
Unemployed percentage below state average.
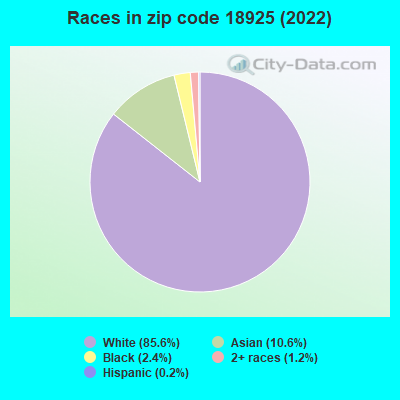
Black race population percentage significantly below state average.
Hispanic race population percentage significantly below state average.
Renting percentage significantly below state average.
Number of rooms per house significantly above state average.
House age significantly below state average.
Percentage of population with a bachelor's degree or higher above state average.
Estimated median house/condo value in 2022: $680,931
18925:
$680,931
Pennsylvania:
$245,500
According to our research of Pennsylvania and other state lists, there were 4 registered sex offenders living in 18925 zip code as of June 03, 2024. The ratio of all residents to sex offenders in zip code 18925 is 1,748 to 1. The ratio of registered sex offenders to all residents in this zip code is much lower than the state average.
Median resident age:
This zip code:
42.2 years
Pennsylvania median age:
40.9 years
Average household size:
This zip code:
2.9 people
Pennsylvania:
2.4 people
Averages for the 2020 tax year for zip code 18925, filed in 2021:
Average Adjusted Gross Income (AGI) in 2020: $163,388 (Individual Income Tax Returns)
Here:
$163,388
State:
$75,707
Salary/wage: $139,694 (reported on 82.5% of returns)
Here:
$139,694
State:
$62,806
(% of AGI for various income ranges: 1142.6% for AGIs below $25k, 3575.0% for AGIs $25k-50k, 6226.9% for AGIs $50k-75k, 9720.8% for AGIs $75k-100k, 18879.3% for AGIs $100k-200k, 97843.6% for AGIs over 200k)
Taxable interest for individuals: $2,331 (reported on 51.8% of returns)
This zip code:
$2,331
Pennsylvania:
$1,633
(% of AGI for various income ranges: 25.9% for AGIs below $25k, 63.0% for AGIs $25k-50k, 90.6% for AGIs $50k-75k, 85.4% for AGIs $75k-100k, 165.9% for AGIs $100k-200k, 1026.8% for AGIs over 200k)
Ordinary dividends: $7,911 (reported on 43.4% of returns)
Here:
$7,911
State:
$7,382
(% of AGI for various income ranges: 79.5% for AGIs below $25k, 145.5% for AGIs $25k-50k, 290.0% for AGIs $50k-75k, 466.2% for AGIs $75k-100k, 510.2% for AGIs $100k-200k, 2735.2% for AGIs over 200k)
Net capital gain/loss in AGI: +$27,694 (reported on 39.5% of returns)
Here:
+$27,694
State:
+$23,522
(% of AGI for various income ranges: 53.6% for AGIs below $25k, 64.5% for AGIs $25k-50k, 313.1% for AGIs $50k-75k, 691.5% for AGIs $75k-100k, 510.7% for AGIs $100k-200k, 11982.0% for AGIs over 200k)
Profit/loss from business: +$45,125 (reported on 19.1% of returns)
Here:
+$45,125
State:
+$16,274
(% of AGI for various income ranges: 172.8% for AGIs below $25k, 306.0% for AGIs $25k-50k, 534.4% for AGIs $50k-75k, 1080.8% for AGIs $75k-100k, 1126.8% for AGIs $100k-200k, 7383.2% for AGIs over 200k)
Taxable individual retirement arrangement distribution: $29,458 (reported on 11.7% of returns)
18925:
$29,458
Pennsylvania:
$18,583
(% of AGI for various income ranges: 78.7% for AGIs below $25k, 226.5% for AGIs $25k-50k, 453.7% for AGIs $50k-75k, 759.2% for AGIs $75k-100k, 726.6% for AGIs $100k-200k, 2061.2% for AGIs over 200k)
Self-employed (Keogh) retirement plans: $30,114 (reported on 2.3% of returns)
18925:
$30,114
Pennsylvania:
$25,407
(% of AGI for various income ranges: 208.1% for AGIs $50k-75k, 710.0% for AGIs over 200k)
Total itemized deductions: $33,271 (reported on 26.5% of returns)
Here:
$33,271
State:
$34,850
(% of AGI for various income ranges: 155.1% for AGIs below $25k, 301.5% for AGIs $25k-50k, 606.2% for AGIs $50k-75k, 1139.2% for AGIs $75k-100k, 1736.1% for AGIs $100k-200k, 6602.0% for AGIs over 200k)
Charity contributions: $7,153 (reported on 23.3% of returns)
Here:
$7,153
State:
$12,392
(% of AGI for various income ranges: 16.9% for AGIs below $25k, 36.2% for AGIs $50k-75k, 90.0% for AGIs $75k-100k, 221.2% for AGIs $100k-200k, 1600.8% for AGIs over 200k)
Taxes paid: $9,268 (reported on 26.5% of returns)
18925:
$9,268
State:
$8,200
(% of AGI for various income ranges: 44.6% for AGIs below $25k, 68.0% for AGIs $25k-50k, 173.1% for AGIs $50k-75k, 392.3% for AGIs $75k-100k, 582.2% for AGIs $100k-200k, 1646.4% for AGIs over 200k)
Earned income credit: $1,844 (reported on 2.9% of returns)
Here:
$1,844
State:
$2,100
(% of AGI for various income ranges: 30.0% for AGIs below $25k, 24.5% for AGIs $25k-50k)
Percentage of individuals using paid preparers for their 2020 taxes: 91.6%
Here:
92%
State:
92%
(% for various income ranges: 86.8% for AGIs below $25k, 93.3% for AGIs $25k-50k, 88.9% for AGIs $50k-75k, 95.7% for AGIs $75k-100k, 91.8% for AGIs $100k-200k, 95.0% for AGIs over 200k)
Averages for the 2012 tax year for zip code 18925, filed in 2013:
Average Adjusted Gross Income (AGI) in 2012: $137,551 (Individual Income Tax Returns)
Here:
$137,551
State:
$61,346
Salary/wage: $119,382 (reported on 84.4% of returns)
Here:
$119,382
State:
$51,902
(% of AGI for various income ranges: 68.9% for AGIs below $25k, 64.7% for AGIs $25k-50k, 66.2% for AGIs $50k-75k, 66.6% for AGIs $75k-100k, 81.1% for AGIs $100k-200k, 71.1% for AGIs over 200k)
Taxable interest for individuals: $1,472 (reported on 56.3% of returns)
This zip code:
$1,472
Pennsylvania:
$1,588
(% of AGI for various income ranges: 2.1% for AGIs below $25k, 1.4% for AGIs $25k-50k, 1.6% for AGIs $50k-75k, 1.4% for AGIs $75k-100k, 0.4% for AGIs $100k-200k, 0.4% for AGIs over 200k)
Ordinary dividends: $6,321 (reported on 44.4% of returns)
Here:
$6,321
State:
$5,827
(% of AGI for various income ranges: 4.3% for AGIs below $25k, 2.5% for AGIs $25k-50k, 3.8% for AGIs $50k-75k, 1.8% for AGIs $75k-100k, 1.6% for AGIs $100k-200k, 2.1% for AGIs over 200k)
Net capital gain/loss in AGI: +$14,464 (reported on 34.8% of returns)
Here:
+$14,464
State:
+$14,495
(% of AGI for various income ranges: 1.2% for AGIs $50k-75k, 1.4% for AGIs $75k-100k, 0.7% for AGIs $100k-200k, 5.9% for AGIs over 200k)
Profit/loss from business: +$34,033 (reported on 19.3% of returns)
Here:
+$34,033
State:
+$16,268
(% of AGI for various income ranges: 10.7% for AGIs below $25k, 10.1% for AGIs $25k-50k, 8.3% for AGIs $50k-75k, 5.6% for AGIs $75k-100k, 4.8% for AGIs $100k-200k, 4.0% for AGIs over 200k)
Taxable individual retirement arrangement distribution: $23,369 (reported on 13.3% of returns)
18925:
$23,369
Pennsylvania:
$14,550
(% of AGI for various income ranges: 5.3% for AGIs below $25k, 6.0% for AGIs $25k-50k, 4.1% for AGIs $50k-75k, 3.8% for AGIs $75k-100k, 2.3% for AGIs $100k-200k, 1.7% for AGIs over 200k)
Self-employment retirement plans: $18,571 (reported on 2.6% of returns)
18925:
$18,571
Pennsylvania:
$20,922
(% of AGI for various income ranges: 1.6% for AGIs $75k-100k, 0.4% for AGIs over 200k)
Total itemized deductions: $33,916 (17% of AGI, reported on 63.0% of returns)
Here:
$33,916
State:
$23,538
Here:
17.0% of AGI
State:
18.4% of AGI
(% of AGI for various income ranges: 21.4% for AGIs below $25k, 23.2% for AGIs $25k-50k, 23.4% for AGIs $50k-75k, 20.1% for AGIs $75k-100k, 19.3% for AGIs $100k-200k, 12.0% for AGIs over 200k)
Charity contributions: $3,406 (reported on 55.9% of returns)
Here:
$3,406
State:
$4,025
(% of AGI for various income ranges: 0.9% for AGIs below $25k, 1.2% for AGIs $25k-50k, 1.8% for AGIs $50k-75k, 1.4% for AGIs $75k-100k, 1.5% for AGIs $100k-200k, 1.3% for AGIs over 200k)
Taxes paid: $16,015 (reported on 63.0% of returns)
18925:
$16,015
State:
$9,982
(% of AGI for various income ranges: 5.5% for AGIs below $25k, 8.1% for AGIs $25k-50k, 8.4% for AGIs $50k-75k, 8.2% for AGIs $75k-100k, 8.8% for AGIs $100k-200k, 6.4% for AGIs over 200k)
Earned income credit: $1,755 (reported on 4.1% of returns)
Here:
$1,755
State:
$2,106
(% of AGI for various income ranges: 2.3% for AGIs below $25k, 0.6% for AGIs $25k-50k)
Percentage of individuals using paid preparers for their 2012 taxes: 59.6%
Here:
60%
State:
53%
(% for various income ranges: 49.2% for AGIs below $25k, 55.2% for AGIs $25k-50k, 65.4% for AGIs $50k-75k, 60.0% for AGIs $75k-100k, 62.2% for AGIs $100k-200k, 68.6% for AGIs over 200k)
Averages for the 2004 tax year for zip code 18925, filed in 2005:
Average Adjusted Gross Income (AGI) in 2004: $99,088 (Individual Income Tax Returns)
Here:
$99,088
State:
$48,049
Salary/wage: $88,940 (reported on 83.7% of returns)
Here:
$88,940
State:
$42,646
(% of AGI for various income ranges: 81.8% for AGIs below $10k, 65.1% for AGIs $10k-25k, 67.1% for AGIs $25k-50k, 72.3% for AGIs $50k-75k, 76.2% for AGIs $75k-100k, 76.0% for AGIs over 100k)
Taxable interest for individuals: $1,731 (reported on 69.2% of returns)
This zip code:
$1,731
Pennsylvania:
$1,657
(% of AGI for various income ranges: 5.8% for AGIs below $10k, 6.9% for AGIs $10k-25k, 2.5% for AGIs $25k-50k, 2.1% for AGIs $50k-75k, 1.7% for AGIs $75k-100k, 0.8% for AGIs over 100k)
Taxable dividends: $2,772 (reported on 50.8% of returns)
Here:
$2,772
State:
$3,566
(% of AGI for various income ranges: 6.9% for AGIs below $10k, 4.7% for AGIs $10k-25k, 3.0% for AGIs $25k-50k, 2.0% for AGIs $50k-75k, 1.7% for AGIs $75k-100k, 1.1% for AGIs over 100k)
Net capital gain/loss: +$9,602 (reported on 42.3% of returns)
Here:
+$9,602
State:
+$9,716
(% of AGI for various income ranges: -6.4% for AGIs below $10k, -0.5% for AGIs $10k-25k, 2.0% for AGIs $25k-50k, -0.3% for AGIs $50k-75k, 1.1% for AGIs $75k-100k, 5.3% for AGIs over 100k)
Profit/loss from business: +$26,506 (reported on 19.7% of returns)
Here:
+$26,506
State:
+$14,267
(% of AGI for various income ranges: 15.1% for AGIs below $10k, 6.8% for AGIs $10k-25k, 9.1% for AGIs $25k-50k, 7.9% for AGIs $50k-75k, 7.7% for AGIs $75k-100k, 4.3% for AGIs over 100k)
IRA payment deduction: $3,538 (reported on 4.4% of returns)
18925:
$3,538
Pennsylvania:
$2,903
(% of AGI for various income ranges: 0.8% for AGIs $25k-50k, 0.5% for AGIs $50k-75k, 0.2% for AGIs $75k-100k, 0.1% for AGIs over 100k)
Self-employed pension: $14,933 (reported on 3.4% of returns)
Here:
$14,933
Pennsylvania:
$14,674
Total itemized deductions: $27,569 (19% of AGI, reported on 61.2% of returns)
Here:
$27,569
State:
$18,804
Here:
19.0% of AGI
State:
19.5% of AGI
(% of AGI for various income ranges: 19.4% for AGIs below $10k, 19.1% for AGIs $10k-25k, 20.4% for AGIs $25k-50k, 22.3% for AGIs $50k-75k, 24.8% for AGIs $75k-100k, 15.2% for AGIs over 100k)
Charity contributions deductions: $3,354 (2% of AGI, reported on 56.9% of returns)
Here:
$3,354
State:
$3,337
Here:
2.2% of AGI
State:
3.3% of AGI
(% of AGI for various income ranges: 1.6% for AGIs $10k-25k, 1.6% for AGIs $25k-50k, 1.9% for AGIs $50k-75k, 2.4% for AGIs $75k-100k, 1.9% for AGIs over 100k)
Total tax: $19,486 (reported on 84.8% of returns)
18925:
$19,486
State:
$8,008
(% of AGI for various income ranges: 4.0% for AGIs below $10k, 5.5% for AGIs $10k-25k, 8.2% for AGIs $25k-50k, 9.8% for AGIs $50k-75k, 9.6% for AGIs $75k-100k, 19.2% for AGIs over 100k)
Earned income credit: $1,213 (reported on 3.5% of returns)
Here:
$1,213
State:
$1,643
Percentage of individuals using paid preparers for their 2004 taxes: 59.3%
Here:
59%
State:
56%
(% for various income ranges: 52.7% for AGIs below $10k, 55.9% for AGIs $10k-25k, 56.9% for AGIs $25k-50k, 61.2% for AGIs $50k-75k, 59.9% for AGIs $75k-100k, 63.6% for AGIs over 100k)
Likely homosexual households (counted as self-reported same-sex unmarried-partner households)
Lesbian couples: 0.0% of all households
Gay men: 1.5% of all households
Household received Food Stamps/SNAP in the past 12 months: 35 Household did not receive Food Stamps/SNAP in the past 12 months: 2,159
Women who had a birth in the past 12 months: 62 (46 now married, 15 unmarried) Women who did not have a birth in the past 12 months: 1,439 (729 now married, 704 unmarried)
Housing units in zip code 18925 with a mortgage: 1,537 (169 second mortgage, 145 both second mortgage and home equity loan) Houses without a mortgage: 19
Median monthly owner costs for units with a mortgage: $3,102 Median monthly owner costs for units without a mortgage: $1,111
Residents with income below the poverty level in 2022:
This zip code:
1.5%
Whole state:
11.8%
Residents with income below 50% of the poverty level in 2022:
This zip code:
0.3%
Whole state:
6.1%
Median number of rooms in houses and condos:
Here:
10.0
State:
6.8
Median number of rooms in apartments:
Here:
6.0
State:
4.3
Notable locations in this zip code not listed on our city pages
Notable locations in zip code 18925: Stanwood Farms (A), Glen Elna Farm (B), Little Buckingham Mountain Estates (C), Bridge Valley Heights (D), Amadon (E), Woodstream West (F), Woodhill (G), Pebble Hill Streams (H), Ridge Valley (I), Fox Croft (J), Eastbrook (K), Blueberry Hill (L), Lingohocken Fire Company Station 95 (M), PECO Energy Electric Substation (N). Display/hide their locations on the map
Churches in zip code 18925 include: Forest Grove Presbyterian Church (A), Furlong Chapel (B), First Baptist Church of Wycombe (C). Display/hide their locations on the map
Size of family households: 509 2-persons, 464 3-persons, 563 4-persons, 122 5-persons, 82 6-persons, 15 7-or-more-persons
Size of nonfamily households: 311 1-person, 112 2-persons
1,560 married couples with children.
68 single-parent households (68 women).
90.2% of residents of 18925 zip code speak English at home.
0.2% of residents speak Spanish at home (100% very well).
5.1% of residents speak other Indo-European language at home (62% very well, 31% well, 7% not well).
3.9% of residents speak Asian or Pacific Island language at home (84% very well, 7% well, 9% not well).
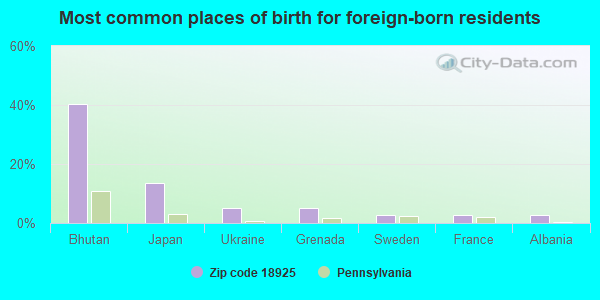
Foreign born population: 594 (9.1%) (83.6% of them are naturalized citizens)
This zip code:
9.1%
Whole state:
7.5%
40%Bhutan
14%Japan
5%Ukraine
5%Grenada
3%Sweden
3%France
3%Albania
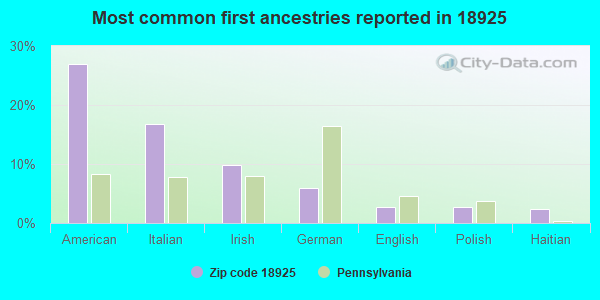
27%American
17%Italian
10%Irish
6%German
3%English
3%Polish
2%Haitian
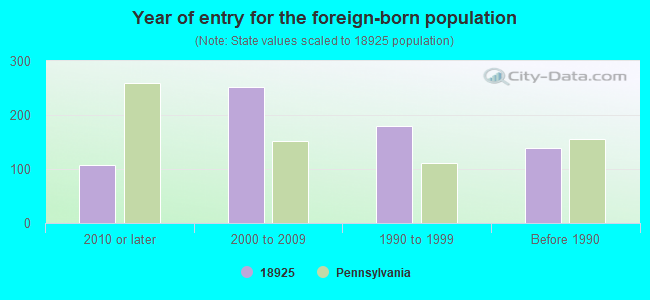
Year of entry for the foreign-born population
1082010 or later
2522000 to 2009
1791990 to 1999
138Before 1990
Public elementary/middle school in in zip code 18925 not listed on the city page:
BRIDGE VALLEY EL SCH(Students: 957, Location: 2280 SUGAR BOTTOM ROAD, Grades: KG-6)
Private elementary/middle school in in this zip code not listed on the city page:
MONTESSORI DEVELOPMENT CENTER (Students: 24, Location: 2415 HERITAGE CENTER DR BLDG 100, Grades: PK-1)
Facilities with environmental interests located in this zip code:
AZZARA SRSTP (1650 MILL ROAD WEST in FURLONG, PA)
STATE MASTER (Pennsylvania database) - PCS-PA0055166, National Pollutant Discharge Elimination System Permit National Pollutant Discharge Elimination System NON-MAJOR (Tracking pollutant discharge elimination systems) - permit Business SIC classification: SEWERAGE SYSTEMS Alternative names: ANDREW C AZZARA, ANDREW C AZZARA SRSTP, AZZARA, ANDREW C.
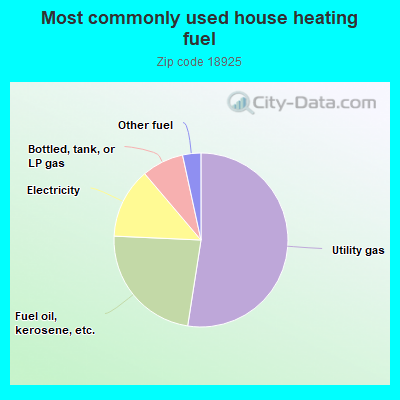
52.5%Utility gas
23.3%Fuel oil, kerosene, etc.
13.1%Electricity
7.8%Bottled, tank, or LP gas
3.4%Other fuel
Population in 1990: 3,789.
Place of birth for U.S.-born residents:
This state: 3,608
Northeast: 1,298
Midwest: 281
South: 311
West: 337
76% of the 18925 zip code residents lived in the same house 5 years ago. Out of people who lived in different houses, 38% lived in this county. Out of people who lived in different counties, 50% lived in Pennsylvania.
95% of the 18925 zip code residents lived in the same house 1 year ago. Out of people who lived in different houses, 62% moved from this county. Out of people who lived in different houses, 6% moved from different county within same state. Out of people who lived in different houses, 37% moved from different state.
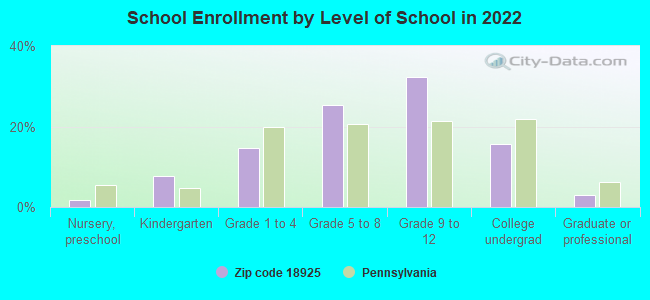
Private vs. public school enrollment:
Students in private schools in grades 1 to 8 (elementary and middle school): 81
Here:
11.0%
Pennsylvania:
15.7%
Students in private schools in grades 9 to 12 (high school): 65
Here:
11.0%
Pennsylvania:
13.4%
Students in private undergraduate colleges: 37
Here:
13.1%
Pennsylvania:
39.8%
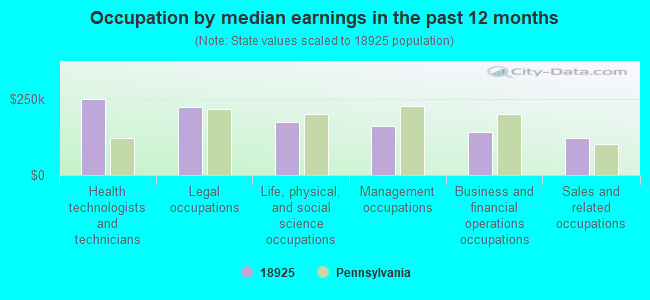
Occupation by median earnings in the past 12 months ($)
248,743Health technologists and technicians
222,038Legal occupations
173,113Life, physical, and social science occupations
159,149Management occupations
141,139Business and financial operations occupations
120,422Sales and related occupations
Companies with federal contracts located in this zip code:
MIRARCHI BROTHERS INC (3873 ROBIN ROAD in FURLONG, PA; small business) : $29,187 in 4 contractsfrom 2003 to 2004
$8,714 with Navy for Construction of Structures and Facilities -- Other Non-Building Facilities. Signed on 2003-05-05. Completion date: 2003-06-04.
$8,357 with Navy for Construction of Structures and Facilities -- Other Residential Buildings. Signed on 2004-04-16. Completion date: 2004-06-01.
$6,922, same as above.Signed on 2004-06-23. Completion date: 2004-06-01.
$5,194 with Navy for Construction of Structures and Facilities -- Ammunition Facilities. Signed on 2003-09-17. Completion date: 2003-10-16.
PLASTIC MEDIA BLASTING INC (30 RODGERS RD in FURLONG, PA; small business)
$19,802 with Army for Bombs. Signed on 2004-05-26. Completion date: 2004-06-30.
Top industries in this zip code by the number of employees in 2005:
Construction: New Housing Operative Builders (100-249 employees: 1 establishment)
Arts, Entertainment, and Recreation: Fitness and Recreational Sports Centers (50-99: 1)
Construction: Commercial and Institutional Building Construction (10-19: 1, 1-4: 4)
Professional, Scientific, and Technical Services: Computer Systems Design Services (10-19: 1, 1-4: 2)
Accommodation and Food Services: Snack and Nonalcoholic Beverage Bars (10-19: 1)
Health Care and Social Assistance: Child Day Care Services (10-19: 1)
People in group quarters in 2010:
121 people in nursing facilities/skilled-nursing facilities
Fatal accident statistics in 2013:
Fatal accident count: 1
Vehicles involved in fatal accidents: 3
Fatal accidents caused by drunken drivers: 0
Fatalities: 1
Persons involved in fatal accidents: 3
Pedestrians involved in fatal accidents: 0
Fatal accident statistics in 2011:
Fatal accident count: 1
Vehicles involved in fatal accidents: 1
Fatal accidents caused by drunken drivers: 0
Fatalities: 1
Persons involved in fatal accidents: 1
Pedestrians involved in fatal accidents: 0
Home Mortgage Disclosure Act Aggregated Statistics For Year 2009 (Based on 6 partial tracts)
A) FHA, FSA/RHS & VA Home Purchase Loans
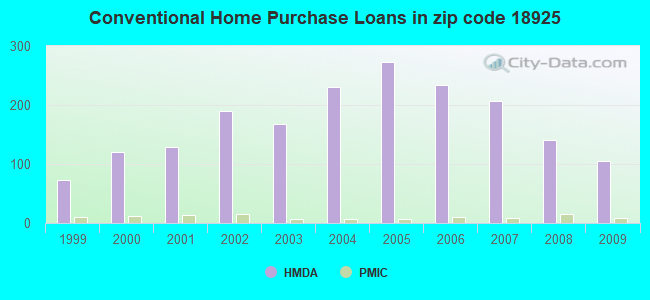
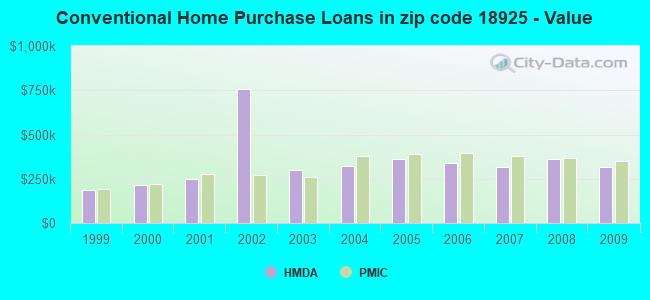
B) Conventional Home Purchase Loans
C) Refinancings
D) Home Improvement Loans
F) Non-occupant Loans on < 5 Family Dwellings (A B C & D)
G) Loans On Manufactured Home Dwelling (A B C & D)
Number
Average Value
Number
Average Value
Number
Average Value
Number
Average Value
Number
Average Value
Number
Average Value
LOANS ORIGINATED
12
$344,056
105
$318,661
390
$312,212
18
$140,310
6
$227,867
2
$85,785
APPLICATIONS APPROVED, NOT ACCEPTED
0
$0
20
$414,770
31
$302,105
2
$101,305
2
$55,850
0
$0
APPLICATIONS DENIED
2
$327,150
10
$243,763
89
$322,459
8
$72,524
1
$381,050
2
$76,850
APPLICATIONS WITHDRAWN
2
$247,620
14
$368,274
62
$326,214
3
$238,593
1
$710,580
0
$0
FILES CLOSED FOR INCOMPLETENESS
0
$0
3
$423,273
17
$410,325
5
$113,590
0
$0
0
$0
Aggregated Statistics For Year 2008 (Based on 6 partial tracts)
A) FHA, FSA/RHS & VA Home Purchase Loans
B) Conventional Home Purchase Loans
C) Refinancings
D) Home Improvement Loans
E) Loans on Dwellings For 5+ Families
F) Non-occupant Loans on < 5 Family Dwellings (A B C & D)
G) Loans On Manufactured Home Dwelling (A B C & D)
Number
Average Value
Number
Average Value
Number
Average Value
Number
Average Value
Number
Average Value
Number
Average Value
Number
Average Value
LOANS ORIGINATED
3
$365,420
140
$360,233
162
$284,213
39
$115,104
1
$571,900
7
$392,701
7
$66,600
APPLICATIONS APPROVED, NOT ACCEPTED
0
$0
30
$332,686
28
$216,824
5
$36,996
0
$0
2
$267,920
2
$66,575
APPLICATIONS DENIED
2
$336,890
22
$331,578
47
$381,924
8
$107,712
0
$0
2
$91,155
3
$70,000
APPLICATIONS WITHDRAWN
0
$0
11
$347,575
35
$304,034
4
$75,368
0
$0
2
$319,480
0
$0
FILES CLOSED FOR INCOMPLETENESS
0
$0
2
$471,200
6
$581,935
1
$190,100
0
$0
0
$0
0
$0
Aggregated Statistics For Year 2007 (Based on 6 partial tracts)
B) Conventional Home Purchase Loans
C) Refinancings
D) Home Improvement Loans
E) Loans on Dwellings For 5+ Families
F) Non-occupant Loans on < 5 Family Dwellings (A B C & D)
G) Loans On Manufactured Home Dwelling (A B C & D)
Number
Average Value
Number
Average Value
Number
Average Value
Number
Average Value
Number
Average Value
Number
Average Value
LOANS ORIGINATED
206
$314,924
147
$316,814
50
$74,085
0
$0
9
$409,660
13
$80,620
APPLICATIONS APPROVED, NOT ACCEPTED
36
$261,782
32
$302,263
10
$76,787
0
$0
1
$266,130
3
$107,827
APPLICATIONS DENIED
10
$288,602
62
$446,056
21
$126,697
0
$0
1
$56,300
1
$55,780
APPLICATIONS WITHDRAWN
19
$341,351
36
$375,629
4
$148,675
1
$446,800
0
$0
0
$0
FILES CLOSED FOR INCOMPLETENESS
3
$545,137
11
$344,579
0
$0
0
$0
1
$302,040
0
$0
Aggregated Statistics For Year 2006 (Based on 6 partial tracts)
B) Conventional Home Purchase Loans
C) Refinancings
D) Home Improvement Loans
F) Non-occupant Loans on < 5 Family Dwellings (A B C & D)
G) Loans On Manufactured Home Dwelling (A B C & D)
Number
Average Value
Number
Average Value
Number
Average Value
Number
Average Value
Number
Average Value
LOANS ORIGINATED
234
$341,314
184
$282,464
64
$85,781
12
$357,418
11
$98,296
APPLICATIONS APPROVED, NOT ACCEPTED
35
$386,201
43
$291,678
12
$77,302
2
$623,370
3
$23,233
APPLICATIONS DENIED
29
$325,345
66
$448,390
19
$67,277
8
$384,316
4
$73,275
APPLICATIONS WITHDRAWN
29
$357,658
41
$395,710
5
$410,058
3
$429,980
0
$0
FILES CLOSED FOR INCOMPLETENESS
11
$413,399
15
$328,905
2
$81,070
0
$0
0
$0
Aggregated Statistics For Year 2005 (Based on 6 partial tracts)
B) Conventional Home Purchase Loans
C) Refinancings
D) Home Improvement Loans
F) Non-occupant Loans on < 5 Family Dwellings (A B C & D)
G) Loans On Manufactured Home Dwelling (A B C & D)
Number
Average Value
Number
Average Value
Number
Average Value
Number
Average Value
Number
Average Value
LOANS ORIGINATED
273
$361,545
217
$303,312
61
$73,755
13
$382,040
7
$86,131
APPLICATIONS APPROVED, NOT ACCEPTED
25
$382,890
38
$298,572
9
$99,939
3
$608,230
3
$58,680
APPLICATIONS DENIED
23
$332,863
62
$362,086
24
$86,992
6
$346,385
2
$263,430
APPLICATIONS WITHDRAWN
26
$350,194
38
$256,236
6
$156,423
3
$181,727
1
$134,040
FILES CLOSED FOR INCOMPLETENESS
4
$311,630
18
$418,208
1
$227,740
1
$225,190
0
$0
Aggregated Statistics For Year 2004 (Based on 6 partial tracts)
B) Conventional Home Purchase Loans
C) Refinancings
D) Home Improvement Loans
F) Non-occupant Loans on < 5 Family Dwellings (A B C & D)
G) Loans On Manufactured Home Dwelling (A B C & D)
Number
Average Value
Number
Average Value
Number
Average Value
Number
Average Value
Number
Average Value
LOANS ORIGINATED
230
$319,347
226
$252,208
59
$94,946
9
$167,493
10
$72,024
APPLICATIONS APPROVED, NOT ACCEPTED
45
$355,494
36
$265,889
10
$103,013
0
$0
1
$17,870
APPLICATIONS DENIED
20
$273,222
63
$262,181
16
$74,156
5
$103,064
4
$62,738
APPLICATIONS WITHDRAWN
22
$334,163
65
$281,934
8
$82,235
0
$0
0
$0
FILES CLOSED FOR INCOMPLETENESS
9
$350,469
35
$329,970
2
$77,495
1
$438,760
0
$0
Aggregated Statistics For Year 2003 (Based on 6 partial tracts)
B) Conventional Home Purchase Loans
C) Refinancings
D) Home Improvement Loans
E) Loans on Dwellings For 5+ Families
F) Non-occupant Loans on < 5 Family Dwellings (A B C & D)
Number
Average Value
Number
Average Value
Number
Average Value
Number
Average Value
Number
Average Value
LOANS ORIGINATED
168
$296,677
657
$230,361
64
$72,288
0
$0
9
$170,903
APPLICATIONS APPROVED, NOT ACCEPTED
23
$338,969
90
$210,481
13
$108,501
0
$0
2
$159,590
APPLICATIONS DENIED
13
$300,597
99
$271,460
11
$64,425
1
$17,870
1
$198,890
APPLICATIONS WITHDRAWN
18
$284,578
75
$255,756
3
$54,270
0
$0
1
$204,590
FILES CLOSED FOR INCOMPLETENESS
6
$281,728
27
$259,517
2
$90,655
0
$0
0
$0
Aggregated Statistics For Year 2002 (Based on 6 partial tracts)
A) FHA, FSA/RHS & VA Home Purchase Loans
B) Conventional Home Purchase Loans
C) Refinancings
D) Home Improvement Loans
F) Non-occupant Loans on < 5 Family Dwellings (A B C & D)
Number
Average Value
Number
Average Value
Number
Average Value
Number
Average Value
Number
Average Value
LOANS ORIGINATED
1
$117,960
190
$754,838
378
$236,031
61
$66,631
7
$344,764
APPLICATIONS APPROVED, NOT ACCEPTED
0
$0
25
$267,520
60
$221,105
13
$50,641
1
$83,180
APPLICATIONS DENIED
0
$0
15
$232,254
61
$199,462
6
$76,713
0
$0
APPLICATIONS WITHDRAWN
0
$0
21
$271,720
62
$326,898
3
$27,953
1
$13,870
FILES CLOSED FOR INCOMPLETENESS
0
$0
4
$213,180
22
$259,806
3
$106,227
0
$0
Aggregated Statistics For Year 2001 (Based on 6 partial tracts)
B) Conventional Home Purchase Loans
C) Refinancings
D) Home Improvement Loans
F) Non-occupant Loans on < 5 Family Dwellings (A B C & D)
Number
Average Value
Number
Average Value
Number
Average Value
Number
Average Value
LOANS ORIGINATED
128
$249,365
226
$199,287
54
$47,521
9
$166,439
APPLICATIONS APPROVED, NOT ACCEPTED
12
$234,957
32
$149,548
5
$35,094
0
$0
APPLICATIONS DENIED
11
$225,175
57
$189,344
11
$26,165
2
$162,190
APPLICATIONS WITHDRAWN
13
$204,129
44
$194,396
5
$31,122
0
$0
FILES CLOSED FOR INCOMPLETENESS
6
$260,748
10
$240,983
1
$19,150
0
$0
Aggregated Statistics For Year 2000 (Based on 6 partial tracts)
B) Conventional Home Purchase Loans
C) Refinancings
D) Home Improvement Loans
F) Non-occupant Loans on < 5 Family Dwellings (A B C & D)
Number
Average Value
Number
Average Value
Number
Average Value
Number
Average Value
LOANS ORIGINATED
121
$211,957
50
$170,020
47
$33,431
4
$150,240
APPLICATIONS APPROVED, NOT ACCEPTED
17
$206,389
12
$120,829
8
$25,541
0
$0
APPLICATIONS DENIED
11
$192,178
42
$191,421
16
$75,842
0
$0
APPLICATIONS WITHDRAWN
8
$248,376
24
$145,947
7
$68,381
0
$0
FILES CLOSED FOR INCOMPLETENESS
2
$216,745
9
$231,351
1
$38,500
0
$0
Aggregated Statistics For Year 1999 (Based on 3 partial tracts)
A) FHA, FSA/RHS & VA Home Purchase Loans
B) Conventional Home Purchase Loans
C) Refinancings
D) Home Improvement Loans
F) Non-occupant Loans on < 5 Family Dwellings (A B C & D)

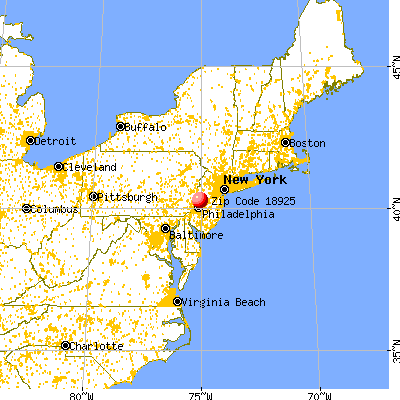


 Nearest zip codes: 18912, 18929, 18980, 18974, 18902, 18938.
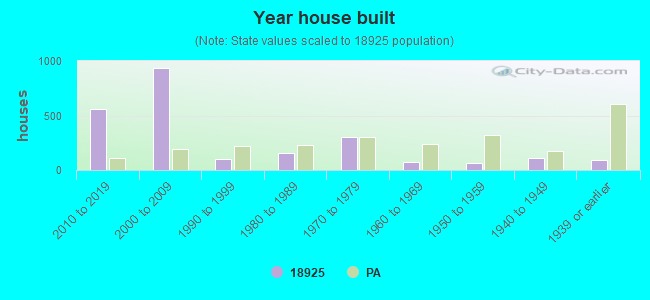


 (Students: 957, Location: 2280 SUGAR BOTTOM ROAD, Grades: KG-6)