Estimated zip code population in 2022: 4,166 Zip code population in 2010: 5,142 Zip code population in 2000: 3,680
Houses and condos: 1,892 Renter-occupied apartments: 189
% of renters here:
11%
State:
33%
March 2022 cost of living index in zip code 20106: 88.6 (less than average, U.S. average is 100)
Land area: 60.2 sq. mi. Water area: 0.3 sq. mi.
Population density: 69 people per square mile
(very low).
OSM Map
General Map
Google Map
MSN Map
OSM Map
General Map
Google Map
MSN Map
OSM Map
General Map
Google Map
MSN Map
OSM Map
General Map
Google Map
MSN Map
Please wait while loading the map...
Real estate property taxes paid for housing units in 2022:
This zip code:
0.5% ($2,582)
Virginia:
0.7% ($2,617)
Median real estate property taxes paid for housing units with mortgages in 2022: $2,634 (0.6%) Median real estate property taxes paid for housing units with no mortgage in 2022: $2,579 (0.5%)
Business Search- 14 Million verified businesses
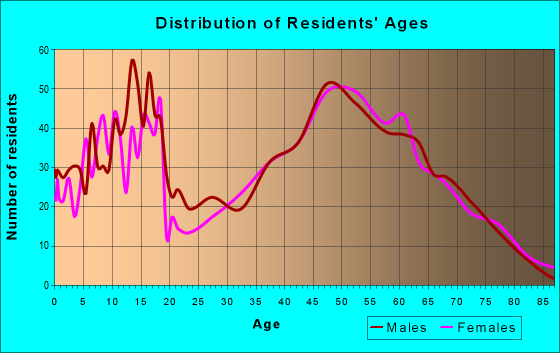
Males: 2,018
(48.4%)
Females: 2,147
(51.6%)
For population 25 years and over in 20106:
High school or higher: 90.4%
Bachelor's degree or higher: 23.9%
Graduate or professional degree: 6.2%
Unemployed: 5.0%
Mean travel time to work (commute): 42.5 minutes
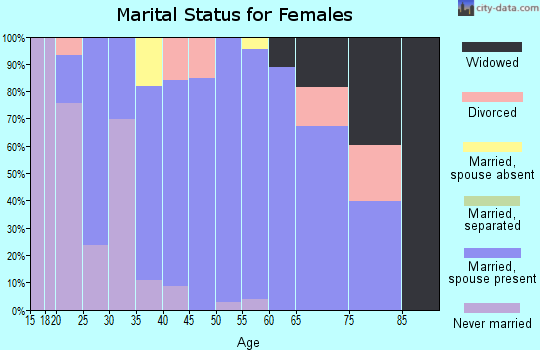
For population 15 years and over in 20106:
Never married: 28.3%
Now married: 54.3%
Separated: 0.2%
Widowed: 6.6%
Divorced: 10.6%
Zip code 20106 compared to state average:
Black race population percentage significantly below state average.
Median age significantly above state average.
Foreign-born population percentage below state average.
Renting percentage significantly below state average.
Length of stay since moving in significantly above state average.
Number of college students significantly below state average.
Percentage of population with a bachelor's degree or higher below state average.
Estimated median house/condo value in 2022: $482,685
20106:
$482,685
Virginia:
$365,700
According to our research of Virginia and other state lists, there were 13 registered sex offenders living in 20106 zip code as of May 28, 2024. The ratio of all residents to sex offenders in zip code 20106 is 416 to 1. The ratio of registered sex offenders to all residents in this zip code is lower than the state average.
Median resident age:
This zip code:
51.6 years
Virginia median age:
39.0 years
Average household size:
This zip code:
2.5 people
Virginia:
2.5 people
Averages for the 2020 tax year for zip code 20106, filed in 2021:
Average Adjusted Gross Income (AGI) in 2020: $87,443 (Individual Income Tax Returns)
Here:
$87,443
State:
$86,446
Salary/wage: $77,489 (reported on 78.5% of returns)
Here:
$77,489
State:
$71,185
(% of AGI for various income ranges: 1170.2% for AGIs below $25k, 3642.5% for AGIs $25k-50k, 6010.0% for AGIs $50k-75k, 8310.6% for AGIs $75k-100k, 18141.8% for AGIs $100k-200k, 75172.0% for AGIs over 200k)
Taxable interest for individuals: $1,310 (reported on 36.0% of returns)
This zip code:
$1,310
Virginia:
$1,805
(% of AGI for various income ranges: 22.4% for AGIs below $25k, 33.8% for AGIs $25k-50k, 41.8% for AGIs $50k-75k, 64.7% for AGIs $75k-100k, 120.8% for AGIs $100k-200k, 610.0% for AGIs over 200k)
Ordinary dividends: $8,058 (reported on 24.3% of returns)
Here:
$8,058
State:
$8,327
(% of AGI for various income ranges: 37.6% for AGIs below $25k, 61.9% for AGIs $25k-50k, 112.3% for AGIs $50k-75k, 191.2% for AGIs $75k-100k, 252.4% for AGIs $100k-200k, 5904.0% for AGIs over 200k)
Net capital gain/loss in AGI: +$13,826 (reported on 21.5% of returns)
Here:
+$13,826
State:
+$24,644
(% of AGI for various income ranges: 13.2% for AGIs below $25k, 60.0% for AGIs $25k-50k, 86.8% for AGIs $50k-75k, 422.4% for AGIs $75k-100k, 664.2% for AGIs $100k-200k, 7298.0% for AGIs over 200k)
Profit/loss from business: +$15,466 (reported on 19.0% of returns)
Here:
+$15,466
State:
+$12,836
(% of AGI for various income ranges: 185.9% for AGIs below $25k, 267.5% for AGIs $25k-50k, 378.2% for AGIs $50k-75k, 394.7% for AGIs $75k-100k, 537.9% for AGIs $100k-200k, 4208.0% for AGIs over 200k)
Taxable individual retirement arrangement distribution: $18,285 (reported on 10.9% of returns)
20106:
$18,285
Virginia:
$21,535
(% of AGI for various income ranges: 49.0% for AGIs below $25k, 165.0% for AGIs $25k-50k, 180.9% for AGIs $50k-75k, 654.1% for AGIs $75k-100k, 525.0% for AGIs $100k-200k, 1406.0% for AGIs over 200k)
Self-employed (Keogh) retirement plans: $27,750 (reported on 0.8% of returns)
20106:
$27,750
Virginia:
$31,172
(% of AGI for various income ranges: 173.4% for AGIs $25k-50k)
Total itemized deductions: $29,719 (reported on 19.0% of returns)
Here:
$29,719
State:
$33,287
(% of AGI for various income ranges: 409.1% for AGIs $25k-50k, 502.7% for AGIs $50k-75k, 1054.1% for AGIs $75k-100k, 1761.8% for AGIs $100k-200k, 6132.0% for AGIs over 200k)
Charity contributions: $6,125 (reported on 14.6% of returns)
Here:
$6,125
State:
$10,381
(% of AGI for various income ranges: 12.7% for AGIs below $25k, 44.1% for AGIs $50k-75k, 162.9% for AGIs $75k-100k, 276.6% for AGIs $100k-200k, 1456.0% for AGIs over 200k)
Taxes paid: $8,434 (reported on 19.0% of returns)
20106:
$8,434
State:
$8,284
(% of AGI for various income ranges: 77.5% for AGIs $25k-50k, 134.1% for AGIs $50k-75k, 275.9% for AGIs $75k-100k, 542.4% for AGIs $100k-200k, 1782.0% for AGIs over 200k)
Earned income credit: $2,143 (reported on 8.5% of returns)
Here:
$2,143
State:
$2,214
(% of AGI for various income ranges: 65.9% for AGIs below $25k, 56.2% for AGIs $25k-50k)
Percentage of individuals using paid preparers for their 2020 taxes: 90.7%
Here:
91%
State:
92%
(% for various income ranges: 88.5% for AGIs below $25k, 88.9% for AGIs $25k-50k, 93.5% for AGIs $50k-75k, 92.3% for AGIs $75k-100k, 91.0% for AGIs $100k-200k, 94.1% for AGIs over 200k)
Averages for the 2012 tax year for zip code 20106, filed in 2013:
Average Adjusted Gross Income (AGI) in 2012: $72,394 (Individual Income Tax Returns)
Here:
$72,394
State:
$71,192
Salary/wage: $65,117 (reported on 80.2% of returns)
Here:
$65,117
State:
$59,229
(% of AGI for various income ranges: 71.9% for AGIs below $25k, 72.3% for AGIs $25k-50k, 65.5% for AGIs $50k-75k, 73.4% for AGIs $75k-100k, 76.0% for AGIs $100k-200k, 65.9% for AGIs over 200k)
Taxable interest for individuals: $1,213 (reported on 40.1% of returns)
This zip code:
$1,213
Virginia:
$1,600
(% of AGI for various income ranges: 1.5% for AGIs below $25k, 0.9% for AGIs $25k-50k, 1.1% for AGIs $50k-75k, 1.0% for AGIs $75k-100k, 0.5% for AGIs $100k-200k, 0.3% for AGIs over 200k)
Ordinary dividends: $3,526 (reported on 25.7% of returns)
Here:
$3,526
State:
$6,959
(% of AGI for various income ranges: 2.2% for AGIs below $25k, 1.2% for AGIs $25k-50k, 1.2% for AGIs $50k-75k, 1.0% for AGIs $75k-100k, 1.3% for AGIs $100k-200k, 1.2% for AGIs over 200k)
Net capital gain/loss in AGI: +$4,817 (reported on 18.5% of returns)
Here:
+$4,817
State:
+$16,672
(% of AGI for various income ranges: 0.2% for AGIs $25k-50k, 0.2% for AGIs $75k-100k, 1.2% for AGIs $100k-200k, 4.5% for AGIs over 200k)
Profit/loss from business: +$16,740 (reported on 18.9% of returns)
Here:
+$16,740
State:
+$14,116
(% of AGI for various income ranges: 9.3% for AGIs below $25k, 8.2% for AGIs $25k-50k, 4.6% for AGIs $50k-75k, 2.4% for AGIs $75k-100k, 5.3% for AGIs $100k-200k)
Taxable individual retirement arrangement distribution: $14,924 (reported on 13.1% of returns)
20106:
$14,924
Virginia:
$16,667
(% of AGI for various income ranges: 2.5% for AGIs below $25k, 2.6% for AGIs $25k-50k, 3.5% for AGIs $50k-75k, 2.9% for AGIs $75k-100k, 3.4% for AGIs $100k-200k)
Total itemized deductions: $24,364 (22% of AGI, reported on 50.0% of returns)
Here:
$24,364
State:
$26,596
Here:
22.0% of AGI
State:
20.1% of AGI
(% of AGI for various income ranges: 12.8% for AGIs below $25k, 15.6% for AGIs $25k-50k, 18.4% for AGIs $50k-75k, 18.0% for AGIs $75k-100k, 18.1% for AGIs $100k-200k, 13.1% for AGIs over 200k)
Charity contributions: $3,212 (reported on 40.1% of returns)
Here:
$3,212
State:
$4,443
(% of AGI for various income ranges: 1.0% for AGIs below $25k, 1.3% for AGIs $25k-50k, 1.6% for AGIs $50k-75k, 1.9% for AGIs $75k-100k, 2.1% for AGIs $100k-200k, 1.4% for AGIs over 200k)
Taxes paid: $8,268 (reported on 50.0% of returns)
20106:
$8,268
State:
$9,951
(% of AGI for various income ranges: 2.3% for AGIs below $25k, 3.3% for AGIs $25k-50k, 4.7% for AGIs $50k-75k, 5.8% for AGIs $75k-100k, 6.6% for AGIs $100k-200k, 6.4% for AGIs over 200k)
Earned income credit: $2,026 (reported on 10.4% of returns)
Here:
$2,026
State:
$2,211
(% of AGI for various income ranges: 4.3% for AGIs below $25k, 0.9% for AGIs $25k-50k)
Percentage of individuals using paid preparers for their 2012 taxes: 48.6%
Here:
49%
State:
46%
(% for various income ranges: 43.1% for AGIs below $25k, 48.7% for AGIs $25k-50k, 53.1% for AGIs $50k-75k, 50.0% for AGIs $75k-100k, 50.0% for AGIs $100k-200k, 62.5% for AGIs over 200k)
Averages for the 2004 tax year for zip code 20106, filed in 2005:
Average Adjusted Gross Income (AGI) in 2004: $61,515 (Individual Income Tax Returns)
Here:
$61,515
State:
$56,704
Salary/wage: $56,654 (reported on 85.7% of returns)
Here:
$56,654
State:
$48,441
(% of AGI for various income ranges: 116.0% for AGIs below $10k, 80.1% for AGIs $10k-25k, 75.7% for AGIs $25k-50k, 75.5% for AGIs $50k-75k, 82.9% for AGIs $75k-100k, 78.4% for AGIs over 100k)
Taxable interest for individuals: $991 (reported on 52.1% of returns)
This zip code:
$991
Virginia:
$1,688
(% of AGI for various income ranges: 5.5% for AGIs below $10k, 1.5% for AGIs $10k-25k, 1.5% for AGIs $25k-50k, 0.8% for AGIs $50k-75k, 0.8% for AGIs $75k-100k, 0.6% for AGIs over 100k)
Taxable dividends: $1,709 (reported on 26.8% of returns)
Here:
$1,709
State:
$4,028
(% of AGI for various income ranges: 5.1% for AGIs below $10k, 1.4% for AGIs $10k-25k, 0.7% for AGIs $25k-50k, 0.6% for AGIs $50k-75k, 0.7% for AGIs $75k-100k, 0.7% for AGIs over 100k)
Net capital gain/loss: +$8,935 (reported on 19.7% of returns)
Here:
+$8,935
State:
+$14,375
(% of AGI for various income ranges: -2.2% for AGIs below $10k, -0.5% for AGIs $10k-25k, 0.4% for AGIs $25k-50k, 1.3% for AGIs $50k-75k, 0.9% for AGIs $75k-100k, 5.4% for AGIs over 100k)
Profit/loss from business: +$14,558 (reported on 17.4% of returns)
Here:
+$14,558
State:
+$13,342
(% of AGI for various income ranges: -10.3% for AGIs below $10k, 9.2% for AGIs $10k-25k, 8.3% for AGIs $25k-50k, 4.4% for AGIs $50k-75k, 1.4% for AGIs $75k-100k, 3.9% for AGIs over 100k)
IRA payment deduction: $3,263 (reported on 3.8% of returns)
20106:
$3,263
Virginia:
$2,943
(% of AGI for various income ranges: 2.4% for AGIs below $10k, 0.4% for AGIs $25k-50k, 0.3% for AGIs $50k-75k, 0.2% for AGIs $75k-100k, 0.1% for AGIs over 100k)
Self-employed pension: $10,467 (reported on 0.7% of returns)
Here:
$10,467
Virginia:
$17,430
Total itemized deductions: $20,899 (23% of AGI, reported on 54.4% of returns)
Here:
$20,899
State:
$21,492
Here:
23.2% of AGI
State:
21.0% of AGI
(% of AGI for various income ranges: 15.2% for AGIs below $10k, 17.0% for AGIs $10k-25k, 17.8% for AGIs $25k-50k, 20.2% for AGIs $50k-75k, 21.0% for AGIs $75k-100k, 17.0% for AGIs over 100k)
Charity contributions deductions: $2,725 (3% of AGI, reported on 46.9% of returns)
Here:
$2,725
State:
$3,794
Here:
2.9% of AGI
State:
3.5% of AGI
(% of AGI for various income ranges: 1.7% for AGIs below $10k, 1.4% for AGIs $10k-25k, 1.7% for AGIs $25k-50k, 2.0% for AGIs $50k-75k, 2.2% for AGIs $75k-100k, 2.2% for AGIs over 100k)
Total tax: $8,476 (reported on 83.9% of returns)
20106:
$8,476
State:
$9,537
(% of AGI for various income ranges: 3.7% for AGIs below $10k, 5.2% for AGIs $10k-25k, 7.7% for AGIs $25k-50k, 8.6% for AGIs $50k-75k, 9.4% for AGIs $75k-100k, 15.5% for AGIs over 100k)
Earned income credit: $1,419 (reported on 7.7% of returns)
Here:
$1,419
State:
$1,734
Percentage of individuals using paid preparers for their 2004 taxes: 52.1%
Here:
52%
State:
52%
(% for various income ranges: 44.0% for AGIs below $10k, 49.4% for AGIs $10k-25k, 53.1% for AGIs $25k-50k, 55.9% for AGIs $50k-75k, 55.4% for AGIs $75k-100k, 53.4% for AGIs over 100k)
Household received Food Stamps/SNAP in the past 12 months: 137 Household did not receive Food Stamps/SNAP in the past 12 months: 1,515
Women who had a birth in the past 12 months: 31 (18 now married, 12 unmarried) Women who did not have a birth in the past 12 months: 817 (266 now married, 554 unmarried)
Housing units in zip code 20106 with a mortgage: 819 (74 second mortgage, 73 both second mortgage and home equity loan) Houses without a mortgage: 25
Median monthly owner costs for units with a mortgage: $1,978 Median monthly owner costs for units without a mortgage: $553
Residents with income below the poverty level in 2022:
This zip code:
9.4%
Whole state:
10.6%
Residents with income below 50% of the poverty level in 2022:
This zip code:
3.6%
Whole state:
5.2%
Median number of rooms in houses and condos:
Here:
6.6
State:
7.0
Median number of rooms in apartments:
Here:
4.8
State:
4.3
Notable locations in this zip code not listed on our city pages
Churches in zip code 20106 include: Crest Hill Baptist Church (A), Battle Run Church (B), Bethel Church (C), Forest Grove Church (D), Amissville Church (E), Mount Moriah Church (F). Display/hide their locations on the map
491 married couples with children.
114 single-parent households (48 men, 66 women).
91.4% of residents of 20106 zip code speak English at home.
6.2% of residents speak Spanish at home (90% very well, 10% not well).
1.0% of residents speak other Indo-European language at home (100% very well).
0.1% of residents speak Asian or Pacific Island language at home (100% well).
1.4% of residents speak other language at home (100% very well).
Foreign born population: 328 (7.9%) (25.8% of them are naturalized citizens)
This zip code:
7.9%
Whole state:
12.7%
48%Honduras
18%Uruguay
7%Colombia
5%Sweden
5%United Kingdom, excluding England and Scotland
4%France
4%Guyana
23%German
18%American
12%English
10%Irish
3%Italian
3%Welsh
3%Greek
Year of entry for the foreign-born population
2322010 or later
272000 to 2009
01990 to 1999
177Before 1990
Facilities with environmental interests located in this zip code:
CLEVENGERS CORNER Q STOP (RT 211 & US RT 229 in AMISSVILLE, VA)
Conditionally Exempt Small Quantity Generators, less than 100 kg/month of hazardous waste (Resource Conservation and Recovery Act (tracking hazardous waste)) - notification Organizations: QUARLES PETROLEUM INC (CONTACT/OWNER)
Housing units lacking complete plumbing facilities: 1.2% Housing units lacking complete kitchen facilities: 1.2%
45.8%Electricity
30.7%Bottled, tank, or LP gas
14.3%Fuel oil, kerosene, etc.
4.7%Wood
4.5%Utility gas
Place of birth for U.S.-born residents:
This state: 1,704
Northeast: 481
Midwest: 275
South: 1,059
West: 229
54% of the 20106 zip code residents lived in the same house 5 years ago. Out of people who lived in different houses, 17% lived in this county. Out of people who lived in different counties, 50% lived in Virginia.
87% of the 20106 zip code residents lived in the same house 1 year ago. Out of people who lived in different houses, 12% moved from this county. Out of people who lived in different houses, 72% moved from different county within same state. Out of people who lived in different houses, 12% moved from different state. Out of people who lived in different houses, 6% moved from abroad.
Private vs. public school enrollment:
Students in private schools in grades 1 to 8 (elementary and middle school): 55
Here:
15.6%
Virginia:
13.2%
Students in private schools in grades 9 to 12 (high school): 18
Here:
12.8%
Virginia:
10.2%
Students in private undergraduate colleges:
Here:
0.0%
Virginia:
18.7%
Occupation by median earnings in the past 12 months ($)
116,416Computer and mathematical occupations
71,684Business and financial operations occupations
70,721Education, training, and library occupations
60,675Health diagnosing and treating practitioners and other technical occupations
59,074Production occupations
57,770Management occupations
Companies with federal contracts located in this zip code:
IN-DEF SERVICES INTERNATIONAL (14847 LEE HIGHWAY in AMISSVILLE, VA; small business) : $131,549 in 3 contractsfrom 2001 to 2005
$76,830 with Navy for Specialized Shipping and Storage Containers. Signed on 2001-03-30. Completion date: 2001-04-30.
$34,384 with Navy for Sewage Treatment Equipment. Signed on 2003-09-30. Completion date: 2003-10-31.
$20,335 with Navy for Plumbing Fixtures and Accessories. Signed on 2005-08-31. Completion date: 2005-11-16.
GLOBAL NETWORX (50 LOST ACRES LANE in AMISSVILLE, VA; small business)
$97,718 with Navy for Miscellaneous Electrical and Electronic Components. Signed on 2001-09-05. Completion date: 2001-10-31.
JOSHUA SHOCKEY (2149 HERITAGE WOODS LANE in AMISSVILLE, VA; small business) : $9,624 in 2 contractsfrom 2002 to 2003
$9,503 with Army for Engineering and Technical Services. Signed on 2002-07-16. Completion date: 2003-07-17.
$121, same as above.Signed on 2003-07-30. Completion date: 2003-07-30.
Top industries in this zip code by the number of employees in 2005:
Construction: New Single-Family Housing Construction (except Operative Builders) (5-9 employees: 1 establishment, 1-4 employees: 10 establishments)
Information: Cellular and Other Wireless Telecommunications (10-19: 1)
Educational Services: Professional and Management Development Training (10-19: 1)
Construction: Plumbing, Heating, and Air-Conditioning Contractors (5-9: 1, 1-4: 3)
Construction: Residential Remodelers (1-4: 5)
Other Services (except Public Administration): Religious Organizations (1-4: 5)
Fatal accident statistics in 2011:
Fatal accident count: 1
Vehicles involved in fatal accidents: 2
Fatal accidents caused by drunken drivers: 0
Fatalities: 1
Persons involved in fatal accidents: 2
Pedestrians involved in fatal accidents: 0
Fatal accident statistics in 2010:
Fatal accident count: 2
Vehicles involved in fatal accidents: 2
Fatal accidents caused by drunken drivers: 1
Fatalities: 2
Persons involved in fatal accidents: 2
Pedestrians involved in fatal accidents: 0
Home Mortgage Disclosure Act Aggregated Statistics For Year 2003 (Based on 2 partial tracts)
A) FHA, FSA/RHS & VA Home Purchase Loans
B) Conventional Home Purchase Loans
C) Refinancings
D) Home Improvement Loans
F) Non-occupant Loans on < 5 Family Dwellings (A B C & D)
Number
Average Value
Number
Average Value
Number
Average Value
Number
Average Value
Number
Average Value
LOANS ORIGINATED
7
$194,329
57
$200,170
264
$172,871
11
$59,070
7
$163,724
APPLICATIONS APPROVED, NOT ACCEPTED
0
$0
6
$154,127
34
$151,381
4
$34,830
0
$0
APPLICATIONS DENIED
0
$0
7
$155,811
52
$149,093
9
$33,591
1
$45,870
APPLICATIONS WITHDRAWN
1
$137,370
5
$218,234
36
$164,544
2
$43,310
1
$356,240
FILES CLOSED FOR INCOMPLETENESS
0
$0
1
$200,570
8
$186,264
0
$0
0
$0
Detailed HMDA statistics for the following Tracts:9901.00
Private Mortgage Insurance Companies Aggregated Statistics For Year 2003 (Based on 2 partial tracts)
A) Conventional Home Purchase Loans
B) Refinancings
Number
Average Value
Number
Average Value
LOANS ORIGINATED
7
$216,149
11
$209,885
APPLICATIONS APPROVED, NOT ACCEPTED
1
$337,700
4
$187,820
APPLICATIONS DENIED
0
$0
0
$0
APPLICATIONS WITHDRAWN
0
$0
1
$205,940
FILES CLOSED FOR INCOMPLETENESS
0
$0
0
$0
Detailed PMIC statistics for the following Tracts:9901.00
2002 - 2018 National Fire Incident Reporting System (NFIRS) incidents
Based on the data from the years 2002 - 2018 the average number of fire incidents per year is 31. The highest number of fires - 45 took place in 2006, and the least - 6 in 2003. The data has an increasing trend.
When looking into fire subcategories, the most incidents belonged to: Structure Fires (46.3%), and Outside Fires (39.2%).
Fire incident types reported to NFIRS in Zip Code 20106


 Nearest zip codes: 22737, 22716, 22639, 22724, 20115, 20186.


 Based on the data from the years 2002 - 2018 the average number of fire incidents per year is 31. The highest number of fires - 45 took place in 2006, and the least - 6 in 2003. The data has an increasing trend.
 When looking into fire subcategories, the most incidents belonged to: Structure Fires (46.3%), and Outside Fires (39.2%).