Estimated zip code population in 2022: 15,601 Zip code population in 2010: 14,557 Zip code population in 2000: 11,138
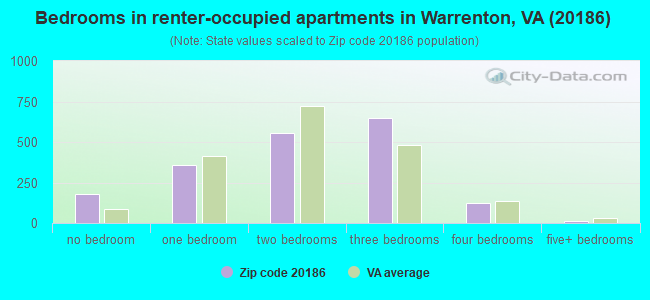
Houses and condos: 6,237 Renter-occupied apartments: 1,863
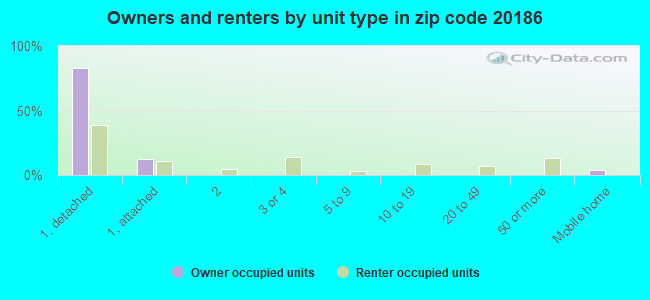
% of renters here:
31%
State:
33%
March 2022 cost of living index in zip code 20186: 162.6 (very high, U.S. average is 100)
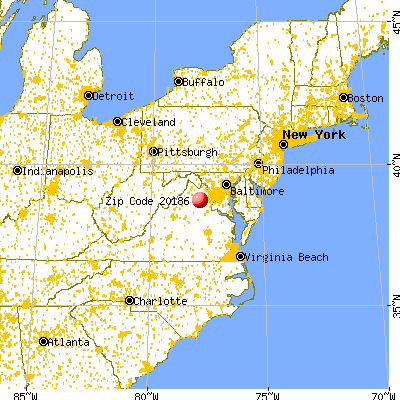
Land area: 64.4 sq. mi. Water area: 0.4 sq. mi.
Population density: 242 people per square mile
(very low).
OSM Map
General Map
Google Map
MSN Map
OSM Map
General Map
Google Map
MSN Map
OSM Map
General Map
Google Map
MSN Map
OSM Map
General Map
Google Map
MSN Map
Please wait while loading the map...
Real estate property taxes paid for housing units in 2022:
This zip code:
0.7% ($3,525)
Virginia:
0.7% ($2,617)
Median real estate property taxes paid for housing units with mortgages in 2022: $3,457 (0.7%) Median real estate property taxes paid for housing units with no mortgage in 2022: $3,758 (0.7%)
Estimated median house/condo value in 2022: $499,582
20186:
$499,582
Virginia:
$365,700
According to our research of Virginia and other state lists, there were 35 registered sex offenders living in 20186 zip code as of May 28, 2024. The ratio of all residents to sex offenders in zip code 20186 is 419 to 1. The ratio of registered sex offenders to all residents in this zip code is lower than the state average.
Median resident age:
This zip code:
40.3 years
Virginia median age:
39.0 years
Average household size:
This zip code:
2.6 people
Virginia:
2.5 people
Averages for the 2020 tax year for zip code 20186, filed in 2021:
Average Adjusted Gross Income (AGI) in 2020: $105,512 (Individual Income Tax Returns)
Here:
$105,512
State:
$86,446
Salary/wage: $79,524 (reported on 80.8% of returns)
Here:
$79,524
State:
$71,185
(% of AGI for various income ranges: 1182.4% for AGIs below $25k, 3752.4% for AGIs $25k-50k, 6460.1% for AGIs $50k-75k, 9678.5% for AGIs $75k-100k, 18402.0% for AGIs $100k-200k, 83217.4% for AGIs over 200k)
Taxable interest for individuals: $2,216 (reported on 37.0% of returns)
This zip code:
$2,216
Virginia:
$1,805
(% of AGI for various income ranges: 14.1% for AGIs below $25k, 33.2% for AGIs $25k-50k, 61.9% for AGIs $50k-75k, 92.1% for AGIs $75k-100k, 158.4% for AGIs $100k-200k, 1686.8% for AGIs over 200k)
Ordinary dividends: $9,714 (reported on 26.4% of returns)
Here:
$9,714
State:
$8,327
(% of AGI for various income ranges: 37.0% for AGIs below $25k, 71.2% for AGIs $25k-50k, 140.1% for AGIs $50k-75k, 227.7% for AGIs $75k-100k, 488.9% for AGIs $100k-200k, 5872.6% for AGIs over 200k)
Net capital gain/loss in AGI: +$49,715 (reported on 23.7% of returns)
Here:
+$49,715
State:
+$24,644
(% of AGI for various income ranges: 17.6% for AGIs below $25k, 39.1% for AGIs $25k-50k, 108.7% for AGIs $50k-75k, 205.0% for AGIs $75k-100k, 621.0% for AGIs $100k-200k, 41909.5% for AGIs over 200k)
Profit/loss from business: +$20,489 (reported on 17.2% of returns)
Here:
+$20,489
State:
+$12,836
(% of AGI for various income ranges: 106.0% for AGIs below $25k, 243.3% for AGIs $25k-50k, 317.2% for AGIs $50k-75k, 372.9% for AGIs $75k-100k, 502.1% for AGIs $100k-200k, 7173.2% for AGIs over 200k)
Taxable individual retirement arrangement distribution: $24,438 (reported on 9.8% of returns)
20186:
$24,438
Virginia:
$21,535
(% of AGI for various income ranges: 53.8% for AGIs below $25k, 89.6% for AGIs $25k-50k, 232.2% for AGIs $50k-75k, 355.0% for AGIs $75k-100k, 690.4% for AGIs $100k-200k, 3296.3% for AGIs over 200k)
Self-employed (Keogh) retirement plans: $33,786 (reported on 0.9% of returns)
20186:
$33,786
Virginia:
$31,172
(% of AGI for various income ranges: 14.7% for AGIs below $25k, 1143.2% for AGIs over 200k)
Total itemized deductions: $31,885 (reported on 22.1% of returns)
Here:
$31,885
State:
$33,287
(% of AGI for various income ranges: 74.1% for AGIs below $25k, 229.3% for AGIs $25k-50k, 728.3% for AGIs $50k-75k, 1096.0% for AGIs $75k-100k, 2040.2% for AGIs $100k-200k, 10178.9% for AGIs over 200k)
Charity contributions: $9,306 (reported on 17.0% of returns)
Here:
$9,306
State:
$10,381
(% of AGI for various income ranges: 4.9% for AGIs below $25k, 28.9% for AGIs $25k-50k, 71.0% for AGIs $50k-75k, 145.4% for AGIs $75k-100k, 369.3% for AGIs $100k-200k, 3528.4% for AGIs over 200k)
Taxes paid: $8,498 (reported on 22.1% of returns)
20186:
$8,498
State:
$8,284
(% of AGI for various income ranges: 12.2% for AGIs below $25k, 50.8% for AGIs $25k-50k, 201.2% for AGIs $50k-75k, 331.0% for AGIs $75k-100k, 641.2% for AGIs $100k-200k, 2195.3% for AGIs over 200k)
Earned income credit: $1,782 (reported on 8.7% of returns)
Here:
$1,782
State:
$2,214
(% of AGI for various income ranges: 55.6% for AGIs below $25k, 44.2% for AGIs $25k-50k)
Percentage of individuals using paid preparers for their 2020 taxes: 91.0%
Here:
91%
State:
92%
(% for various income ranges: 89.5% for AGIs below $25k, 91.7% for AGIs $25k-50k, 91.1% for AGIs $50k-75k, 89.6% for AGIs $75k-100k, 91.2% for AGIs $100k-200k, 94.5% for AGIs over 200k)
Averages for the 2012 tax year for zip code 20186, filed in 2013:
Average Adjusted Gross Income (AGI) in 2012: $79,756 (Individual Income Tax Returns)
Here:
$79,756
State:
$71,192
Salary/wage: $65,763 (reported on 84.2% of returns)
Here:
$65,763
State:
$59,229
(% of AGI for various income ranges: 77.0% for AGIs below $25k, 78.7% for AGIs $25k-50k, 73.2% for AGIs $50k-75k, 75.9% for AGIs $75k-100k, 79.1% for AGIs $100k-200k, 50.6% for AGIs over 200k)
Taxable interest for individuals: $2,229 (reported on 39.0% of returns)
This zip code:
$2,229
Virginia:
$1,600
(% of AGI for various income ranges: 1.4% for AGIs below $25k, 0.9% for AGIs $25k-50k, 1.0% for AGIs $50k-75k, 0.8% for AGIs $75k-100k, 0.7% for AGIs $100k-200k, 1.8% for AGIs over 200k)
Ordinary dividends: $7,706 (reported on 25.6% of returns)
Here:
$7,706
State:
$6,959
(% of AGI for various income ranges: 2.3% for AGIs below $25k, 1.3% for AGIs $25k-50k, 1.6% for AGIs $50k-75k, 1.3% for AGIs $75k-100k, 1.7% for AGIs $100k-200k, 4.4% for AGIs over 200k)
Net capital gain/loss in AGI: +$16,054 (reported on 19.6% of returns)
Here:
+$16,054
State:
+$16,672
(% of AGI for various income ranges: 0.4% for AGIs $25k-50k, 0.1% for AGIs $50k-75k, 0.6% for AGIs $75k-100k, 1.0% for AGIs $100k-200k, 11.6% for AGIs over 200k)
Profit/loss from business: +$18,274 (reported on 15.1% of returns)
Here:
+$18,274
State:
+$14,116
(% of AGI for various income ranges: 6.6% for AGIs below $25k, 4.9% for AGIs $25k-50k, 1.9% for AGIs $50k-75k, 2.1% for AGIs $75k-100k, 2.5% for AGIs $100k-200k, 4.7% for AGIs over 200k)
Taxable individual retirement arrangement distribution: $16,364 (reported on 10.7% of returns)
20186:
$16,364
Virginia:
$16,667
(% of AGI for various income ranges: 2.3% for AGIs below $25k, 1.3% for AGIs $25k-50k, 2.2% for AGIs $50k-75k, 2.5% for AGIs $75k-100k, 2.4% for AGIs $100k-200k, 2.1% for AGIs over 200k)
Self-employment retirement plans: $16,317 (reported on 0.9% of returns)
20186:
$16,317
Virginia:
$25,373
Total itemized deductions: $27,924 (21% of AGI, reported on 47.4% of returns)
Here:
$27,924
State:
$26,596
Here:
21.1% of AGI
State:
20.1% of AGI
(% of AGI for various income ranges: 12.1% for AGIs below $25k, 11.8% for AGIs $25k-50k, 16.4% for AGIs $50k-75k, 19.2% for AGIs $75k-100k, 18.9% for AGIs $100k-200k, 15.1% for AGIs over 200k)
Charity contributions: $4,651 (reported on 38.5% of returns)
Here:
$4,651
State:
$4,443
(% of AGI for various income ranges: 0.7% for AGIs below $25k, 1.0% for AGIs $25k-50k, 1.6% for AGIs $50k-75k, 1.8% for AGIs $75k-100k, 2.3% for AGIs $100k-200k, 3.2% for AGIs over 200k)
Taxes paid: $10,187 (reported on 47.1% of returns)
20186:
$10,187
State:
$9,951
(% of AGI for various income ranges: 2.0% for AGIs below $25k, 2.8% for AGIs $25k-50k, 4.6% for AGIs $50k-75k, 6.0% for AGIs $75k-100k, 7.1% for AGIs $100k-200k, 6.8% for AGIs over 200k)
Earned income credit: $1,967 (reported on 9.8% of returns)
Here:
$1,967
State:
$2,211
(% of AGI for various income ranges: 4.2% for AGIs below $25k, 0.7% for AGIs $25k-50k)
Percentage of individuals using paid preparers for their 2012 taxes: 45.3%
Here:
45%
State:
46%
(% for various income ranges: 39.8% for AGIs below $25k, 41.8% for AGIs $25k-50k, 50.5% for AGIs $50k-75k, 50.0% for AGIs $75k-100k, 45.3% for AGIs $100k-200k, 62.8% for AGIs over 200k)
Averages for the 2004 tax year for zip code 20186, filed in 2005:
Average Adjusted Gross Income (AGI) in 2004: $72,518 (Individual Income Tax Returns)
Here:
$72,518
State:
$56,704
Salary/wage: $59,874 (reported on 84.7% of returns)
Here:
$59,874
State:
$48,441
(% of AGI for various income ranges: 143.5% for AGIs below $10k, 75.9% for AGIs $10k-25k, 79.5% for AGIs $25k-50k, 77.0% for AGIs $50k-75k, 79.4% for AGIs $75k-100k, 63.3% for AGIs over 100k)
Taxable interest for individuals: $2,152 (reported on 50.8% of returns)
This zip code:
$2,152
Virginia:
$1,688
(% of AGI for various income ranges: 10.2% for AGIs below $10k, 2.6% for AGIs $10k-25k, 1.2% for AGIs $25k-50k, 1.1% for AGIs $50k-75k, 1.5% for AGIs $75k-100k, 1.5% for AGIs over 100k)
Taxable dividends: $4,327 (reported on 31.2% of returns)
Here:
$4,327
State:
$4,028
(% of AGI for various income ranges: 7.2% for AGIs below $10k, 3.0% for AGIs $10k-25k, 1.1% for AGIs $25k-50k, 1.5% for AGIs $50k-75k, 1.3% for AGIs $75k-100k, 2.1% for AGIs over 100k)
Net capital gain/loss: +$29,531 (reported on 25.1% of returns)
Here:
+$29,531
State:
+$14,375
(% of AGI for various income ranges: -3.4% for AGIs below $10k, 0.8% for AGIs $10k-25k, 0.7% for AGIs $25k-50k, 0.8% for AGIs $50k-75k, 1.1% for AGIs $75k-100k, 16.8% for AGIs over 100k)
Profit/loss from business: +$21,685 (reported on 15.3% of returns)
Here:
+$21,685
State:
+$13,342
(% of AGI for various income ranges: 1.8% for AGIs below $10k, 6.3% for AGIs $10k-25k, 3.1% for AGIs $25k-50k, 3.0% for AGIs $50k-75k, 3.1% for AGIs $75k-100k, 5.5% for AGIs over 100k)
IRA payment deduction: $3,065 (reported on 3.6% of returns)
20186:
$3,065
Virginia:
$2,943
(% of AGI for various income ranges: 0.4% for AGIs $10k-25k, 0.3% for AGIs $25k-50k, 0.2% for AGIs $50k-75k, 0.1% for AGIs $75k-100k, 0.1% for AGIs over 100k)
Self-employed pension: $17,370 (reported on 1.5% of returns)
Here:
$17,370
Virginia:
$17,430
Total itemized deductions: $24,168 (21% of AGI, reported on 51.6% of returns)
Here:
$24,168
State:
$21,492
Here:
21.0% of AGI
State:
21.0% of AGI
(% of AGI for various income ranges: 24.2% for AGIs below $10k, 14.4% for AGIs $10k-25k, 14.6% for AGIs $25k-50k, 19.9% for AGIs $50k-75k, 20.4% for AGIs $75k-100k, 16.5% for AGIs over 100k)
Charity contributions deductions: $3,843 (3% of AGI, reported on 44.6% of returns)
Here:
$3,843
State:
$3,794
Here:
3.2% of AGI
State:
3.5% of AGI
(% of AGI for various income ranges: 1.5% for AGIs below $10k, 1.2% for AGIs $10k-25k, 1.4% for AGIs $25k-50k, 2.1% for AGIs $50k-75k, 2.2% for AGIs $75k-100k, 2.7% for AGIs over 100k)
Total tax: $12,002 (reported on 83.0% of returns)
20186:
$12,002
State:
$9,537
(% of AGI for various income ranges: 4.0% for AGIs below $10k, 4.8% for AGIs $10k-25k, 7.9% for AGIs $25k-50k, 9.2% for AGIs $50k-75k, 10.2% for AGIs $75k-100k, 17.3% for AGIs over 100k)
Earned income credit: $1,672 (reported on 8.0% of returns)
Here:
$1,672
State:
$1,734
Percentage of individuals using paid preparers for their 2004 taxes: 51.5%
Here:
51%
State:
52%
(% for various income ranges: 42.3% for AGIs below $10k, 55.3% for AGIs $10k-25k, 51.0% for AGIs $25k-50k, 51.9% for AGIs $50k-75k, 48.1% for AGIs $75k-100k, 57.0% for AGIs over 100k)
Likely homosexual households (counted as self-reported same-sex unmarried-partner households)
Lesbian couples: 0.3% of all households
Gay men: 0.0% of all households
Household received Food Stamps/SNAP in the past 12 months: 358 Household did not receive Food Stamps/SNAP in the past 12 months: 5,582
Women who had a birth in the past 12 months: 162 (167 now married, 0 unmarried) Women who did not have a birth in the past 12 months: 3,072 (1,350 now married, 1,721 unmarried)
Housing units in zip code 20186 with a mortgage: 3,066 (388 second mortgage, 330 both second mortgage and home equity loan) Houses without a mortgage: 25
Median monthly owner costs for units with a mortgage: $2,231 Median monthly owner costs for units without a mortgage: $737
Residents with income below the poverty level in 2022:
This zip code:
5.5%
Whole state:
10.6%
Residents with income below 50% of the poverty level in 2022:
This zip code:
2.6%
Whole state:
5.2%
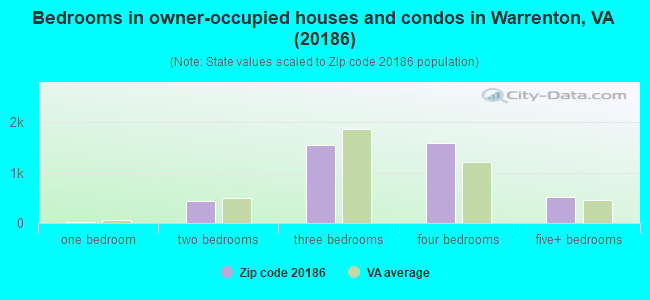
Median number of rooms in houses and condos:
Here:
7.9
State:
7.0
Median number of rooms in apartments:
Here:
4.6
State:
4.3
Notable locations in this zip code not listed on our city pages
Notable locations in zip code 20186: South Wales Golf Course (A), Fauquier Springs Country Club (B), Warrenton Industrial Park (C), Oakwood Farm (D), North Wales Estate (E), Harts Crossroads (F), Atherton Farms (G), Fauquier White Sulphur Springs (H), Fauquier County Sheriff's Department Detention Center (I), Warrenton Police Department (J), Warrenton Volunteer Fire Department and Emergency Medical Services Station 1 (K), Fauquier County Department of Fire and Emergency Services (L), Old Gaol Museum (M), Fauquier County Courthouse (N), Warrenton Volunteer Fire Company 1 (O), Warrenton Volunteer Rescue Squad (P), Virginia State Police Division 2 Area 12 Office (Q), The Warrenton Library (R), Warrenton General District Court (S), Fauquier County Sheriff's Office (T). Display/hide their locations on the map
Shopping Centers: Waterloo Station Shopping Center (1), Warrenton Village Shopping Center (2), Warrenton Shopping Center (3), Oak Springs Plaza Shopping Center (4), Huntsman Towne Village Shopping Center (5). Display/hide their locations on the map
Churches in zip code 20186 include: First Baptist Church (A), Living Faith Presbyterian Church (B), Mount Zion Baptist Church (C), Warrenton Assembly of God Church (D), The Springs Church (E), Enon Church (F), Litchfield Presbyterian Church (G), Our Saviour Church (H). Display/hide their locations on the map
2,609 married couples with children.
522 single-parent households (81 men, 441 women).
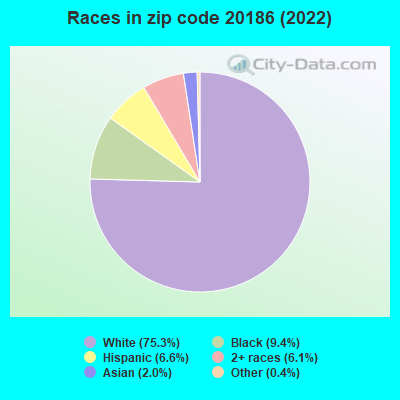
91.2% of residents of 20186 zip code speak English at home.
4.9% of residents speak Spanish at home (64% very well, 9% well, 5% not well, 22% not at all).
2.3% of residents speak other Indo-European language at home (55% very well, 17% well, 6% not well, 21% not at all).
1.2% of residents speak Asian or Pacific Island language at home (62% very well, 12% well, 23% not well, 3% not at all).
0.4% of residents speak other language at home (25% very well, 75% well).
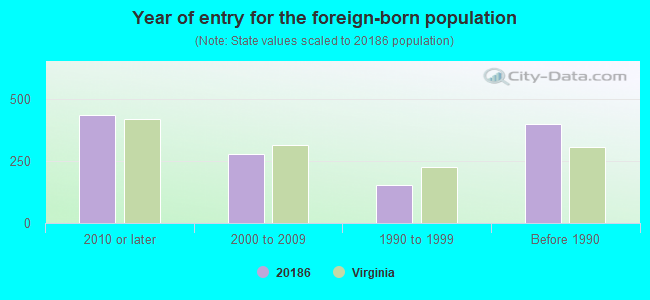
Foreign born population: 939 (6.0%) (65.8% of them are naturalized citizens)
Facilities with environmental interests located in this zip code:
ACCLAIM CLEANERS (494 BROADVIEW AVE in WARRENTON, VA)
AIR MINOR (AIRS/AFS) STATE MASTER (Virginia pollutants databases) - CEDS-41018, AIR PROGRAM Business SIC classification: DRYCLEANING PLANTS, EXCEPT RUG CLEANING Business NAICS classification: DRYCLEANING AND LAUNDRY SERVICES (EXCEPT COIN-OPERATED).
BOXWOOD SCHOOL INCORPORATED (507 WINCHESTER STREET in WARRENTON, VA)
(Integrated Compliance Information System) - ICIS-03-1989-0455, FORMAL ENFORCEMENT ACTION COMPLIANCE ACTIVITY (Tracking inspections of insecticide, fungicide, and rodenticide, and toxic substances) Business SIC classification: ELEMENTARY AND SECONDARY SCHOOLS; CHILD DAY CARE SERVICES
C. M. BRADLEY ELEM. (674 HASTINGS LN in WARRENTON, VA)
(National Center for Education Statistics) - STATE ID-0300730 Organizations: FAUQUIER COUNTY PUBLIC SCHOOLS (SCHOOL DISTRICT)
7-ELEVEN #18638 (10041 JAMES MADISON HIGHWAY in WARRENTON, VA)
(Resource Conservation and Recovery Act (tracking hazardous waste)) Organizations: OPERNAME (CONTACT/OPERATOR)
, 7-ELEVEN INC (CONTACT/OPERATOR)
, SOUTHLAND CORPORATION THE (CONTACT/OWNER)
CARRIAGE HOUSE CLEANERS (64 WEST LEE STREET in WARRENTON, VA)
Small Quantity Generators, between 100 kg and 1000 kg of hazardous waste/month (Resource Conservation and Recovery Act (tracking hazardous waste)) - notification Organizations: OPERNAME (CONTACT/OPERATOR)
, SOUTHLAND CORPORATION THE (CONTACT/OWNER)
BLALOCK CYCLE COMPANY (170 LEE HIGHWAY in WARRENTON, VA)
Conditionally Exempt Small Quantity Generators, less than 100 kg/month of hazardous waste (Resource Conservation and Recovery Act (tracking hazardous waste)) - notification Organizations: OPERNAME (CONTACT/OPERATOR)
, BILL BLALOCK (CONTACT/OWNER)
BLUE RIDGE ORTHOPAEDIC ASSOCIATES (550 HOSPITAL DRIVE in WARRENTON, VA)
Small Quantity Generators, between 100 kg and 1000 kg of hazardous waste/month (Resource Conservation and Recovery Act (tracking hazardous waste)) - notification Organizations: OPERNAME (CONTACT/OPERATOR)
, COUK, DAVID E MD (CONTACT/OWNER)
BRANDON WOODWORKS (62 FRANKLIN STREET in WARRENTON, VA)
Small Quantity Generators, between 100 kg and 1000 kg of hazardous waste/month (Resource Conservation and Recovery Act (tracking hazardous waste)) - notification Organizations: OPERNAME (CONTACT/OPERATOR)
, BRANDON, JON (CONTACT/OWNER)
CARTER MACHINERY COMPANY INCORPORATED (721 INDUSTRIAL ROAD in WARRENTON, VA)
Small Quantity Generators, between 100 kg and 1000 kg of hazardous waste/month (Resource Conservation and Recovery Act (tracking hazardous waste)) - notification Organizations: OPERNAME (CONTACT/OPERATOR)
, CARTER MACHINERY CO INC (CONTACT/OWNER)
Alternative names: CARTER MACHINERY CO INC - WARRENTON
CECILS SERVICE & EQUIPMENT (338 BROADVIEW AVENUE in WARRENTON, VA)
Small Quantity Generators, between 100 kg and 1000 kg of hazardous waste/month (Resource Conservation and Recovery Act (tracking hazardous waste)) - notification Organizations: OPERNAME (CONTACT/OPERATOR)
, CAMPBELL, CECIL (CONTACT/OWNER)
CHICKS SERVICES INCORPORATED (338 BROADVIEW AVENUE in WARRENTON, VA)
Small Quantity Generators, between 100 kg and 1000 kg of hazardous waste/month (Resource Conservation and Recovery Act (tracking hazardous waste)) - notification Organizations: OPERNAME (CONTACT/OPERATOR)
, EDWARDS, DALE VP (CONTACT/OWNER)
Housing units lacking complete plumbing facilities: 0.5% Housing units lacking complete kitchen facilities: 2.2%
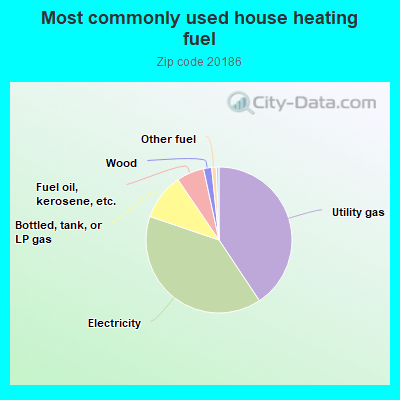
40.7%Utility gas
39.6%Electricity
10.3%Bottled, tank, or LP gas
6.1%Fuel oil, kerosene, etc.
1.8%Wood
1.0%Other fuel
Place of birth for U.S.-born residents:
This state: 7,802
Northeast: 2,007
Midwest: 1,102
South: 2,727
West: 689
50% of the 20186 zip code residents lived in the same house 5 years ago. Out of people who lived in different houses, 46% lived in this county. Out of people who lived in different counties, 50% lived in Virginia.
91% of the 20186 zip code residents lived in the same house 1 year ago. Out of people who lived in different houses, 36% moved from this county. Out of people who lived in different houses, 42% moved from different county within same state. Out of people who lived in different houses, 20% moved from different state. Out of people who lived in different houses, 2% moved from abroad.
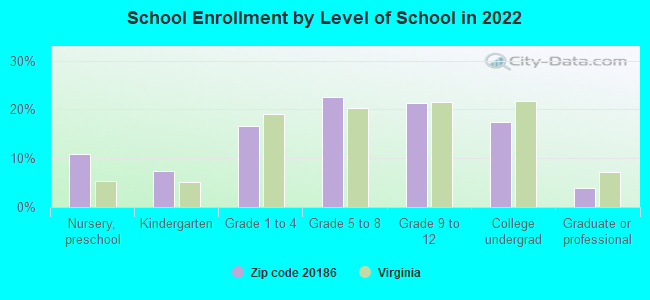
Private vs. public school enrollment:
Students in private schools in grades 1 to 8 (elementary and middle school): 182
Here:
13.7%
Virginia:
13.2%
Students in private schools in grades 9 to 12 (high school): 43
Here:
6.0%
Virginia:
10.2%
Students in private undergraduate colleges: 110
Here:
18.8%
Virginia:
18.7%
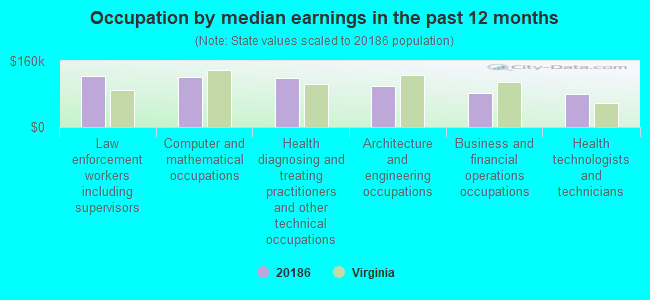
Occupation by median earnings in the past 12 months ($)
123,915Law enforcement workers including supervisors
121,633Computer and mathematical occupations
118,955Health diagnosing and treating practitioners and other technical occupations
99,609Architecture and engineering occupations
81,255Business and financial operations occupations
80,482Health technologists and technicians
Companies with biggest federal contracts located in this zip code (WARRENTON, VA):
WINDMILL INTERNATIONAL, LTD (194 CULPEPER ST; small business) : $1,725,707 in 4 contractsfrom 2004 to 2005
$877,654 with Army for Trucks and Truck Tractors, Wheeled. Signed on 2005-09-30. Completion date: 2006-06-08.
$698,026 with Army for Tractors, Wheeled. Signed on 2004-08-06. Completion date: 2006-06-08.
$150,027, same as above.Signed on 2004-06-17. Completion date: 2006-06-08.
$0, same as above.Signed on 2004-06-17. Completion date: 2006-06-08.
SCHIEBEL TECHNOLOGY, INC (70 MAIN ST; small business) : $586,172 in 18 contractsfrom 2000 to 2006
Contracts for Hazard-Detecting Instruments and Apparatus, Other Research and Development -- Advanced Development (R&D), Land Mines, Screws by Army, Navy, Defense Logistics Agency Signed by year:2000: $114,125; 2001: $0; 2002: $0; 2003: $0; 2004: $12,132; 2005: $333,905; 2006: $126,010.
Biggest contracts:
$148,344 with Army for Hazard-Detecting Instruments and Apparatus. Signed on 2005-02-28. Completion date: 2005-05-30.
$121,634, same as above.Signed on 2006-05-02. Completion date: 2007-01-30.
$114,125 with Army for Other Research and Development -- Advanced Development (R&D). Signed on 2000-07-26. Completion date: 2000-09-30.
$47,408 with Navy for Hazard-Detecting Instruments and Apparatus. Signed on 2005-06-29. Completion date: 2005-09-09.
DESIGN INTEGRATED TECHNOLOGY I (100 E FRANKLIN ST; small business) : $309,099 in 6 contractsfrom 2001 to 2006
Contracts for Chemical Analysis Instruments, Laboratory Equipment and Supplies, Hardware, Weapon System by Navy, Army Signed by year:2000: $0; 2001: $35,474; 2002: $0; 2003: $56,855; 2004: $7,767; 2005: $0; 2006: $209,003.
Biggest contracts:
$209,003 with Navy for Chemical Analysis Instruments. Signed on 2006-06-27. Completion date: 2006-11-27.
$56,855 with Army for Chemical Analysis Instruments. Signed on 2003-09-16. Completion date: 2003-12-15.
$35,474 with Army for Laboratory Equipment and Supplies. Signed on 2001-06-15. Completion date: 2001-11-15.
$7,767, same as above.Signed on 2004-09-13. Completion date: 2004-11-05.
THE WASHINGTON SOURCE, INC (3 HOTEL STREET; small business) : $255,494 in 2 contractsfrom 2001 to 2005
$249,518 with Navy for Office Furniture. Signed on 2001-07-25. Completion date: 2001-09-30.
$5,976 with Navy for ADP Supplies. Signed on 2005-03-07. Completion date: 2005-03-25.
INTEGRATED CONTAINER ENGINEERI (7268 WAVERLY DRIVE; small business) : $187,032 in 7 contractsfrom 2001 to 2006
Contracts for Specialized Shipping and Storage Containers, Miscellaneous Electrical and Electronic Components, Miscellaneous Ship and Marine Equipment by Federal Bureau of Investigation, Bureau of Prisoners/Federal Prison System, Army, Navy, and others Signed by year:2000: $0; 2001: $29,332; 2002: $80,718; 2003: $0; 2004: $30,782; 2005: $0; 2006: $46,200.
Biggest contracts:
$73,000 with Federal Bureau of Investigation for Specialized Shipping and Storage Containers. Signed on 2002-09-15. Completion date: 2002-10-15.
$46,200 with Bureau of Prisoners/Federal Prison System for Miscellaneous Electrical and Electronic Components. Signed on 2006-08-08. Completion date: 2006-09-08.
$25,000 with Federal Bureau of Investigation for Specialized Shipping and Storage Containers. Taking place in MD. Signed on 2001-09-15. Completion date: 2001-09-15.
$22,952 with Army for Specialized Shipping and Storage Containers. Taking place in KS. Signed on 2004-09-21. Completion date: 2004-10-17.
WARD TECHNOLOGY GROUP (294 FORBES CT; small business) : $97,886 in 2 contractsfrom 2005 to 2006
$59,356 with Army for Other ADP and Telecommunications Services (includes data storage on tapes, compact disks, etc.). Signed on 2006-03-10. Completion date: 2007-02-28.
$38,530 with Army for Program Management/Support Services. Signed on 2005-07-07. Completion date: 2006-02-28.
IMAGING ACCEPTANCE CORPORATION (100 MAIN ST; small business)
$97,600 with Navy for Other Administrative Support Services. Signed on 2006-03-29. Completion date: 2006-09-29.
SUMMERLAND DESIGNS (8457 TURNBULL ROAD; small business) : $25,300 in 9 contractsfrom 2004 to 2006
Contracts for Jewelry, Collectors. and/or Historical Items, Badges and Insignia, Miscellaneous Items by Army, U.S. Army Corps of Engineers - civil program financing only Signed by year:2000: $0; 2001: $0; 2002: $0; 2003: $0; 2004: $5,797; 2005: $18,868; 2006: $635.
Biggest contracts:
$10,292 with Army for Jewelry. Taking place in DC. Signed on 2005-04-06. Completion date: 2005-04-01.
$3,863 with Army for Collectors. and/or Historical Items. Signed on 2004-11-08. Completion date: 2004-11-15.
$2,809 with Army for Badges and Insignia. Taking place in TX. Signed on 2005-04-04. Completion date: 2005-05-29.
$2,137 with Army for Jewelry. Signed on 2005-11-09. Completion date: 2005-12-09.
TEST DYNAMICS INC (400 BELLE AIR LN; small business) : $17,040 in 2 contractsfrom 2004 to 2006
$9,160 with Air Force for Scales and Balances. Signed on 2006-03-24. Completion date: 2006-04-24.
$7,880 with Bureau of Reclamation for Miscellaneous Electrical and Electronic Components. Taking place in CO. Signed on 2004-10-08. Completion date: 2004-10-25.
KITTRONICS INC (689 WARRENTON CENTER; small business)
$2,986 with Air Force for Miscellaneous Communication Equipment. Signed on 2005-09-29. Completion date: 2005-10-31.
Top industries in this zip code by the number of employees in 2005:
Health Care and Social Assistance: General Medical and Surgical Hospitals (500-999 employees: 1 establishment)
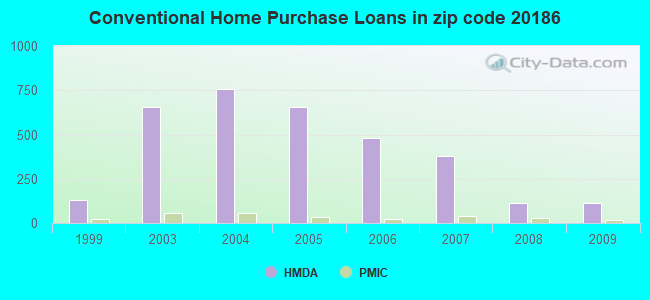
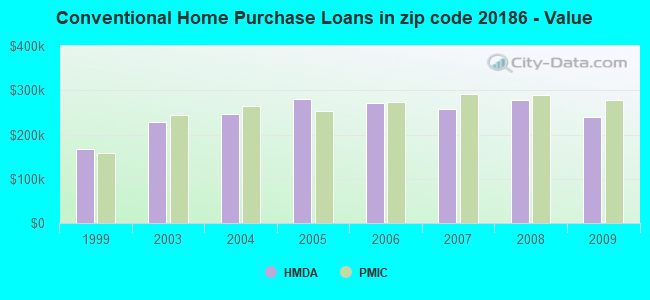
Detailed PMIC statistics for the following Tracts:9902.02
, 9903.02
2002 - 2018 National Fire Incident Reporting System (NFIRS) incidents
According to the data from the years 2002 - 2018 the average number of fire incidents per year is 108. The highest number of reported fires - 159 took place in 2006, and the least - 12 in 2004. The data has a dropping trend.
When looking into fire subcategories, the most incidents belonged to: Structure Fires (41.5%), and Outside Fires (38.6%).
Fire incident types reported to NFIRS in Zip Code 20186


 Nearest zip codes: 22724, 20187, 20115, 20106, 20139, 22712.


 According to the data from the years 2002 - 2018 the average number of fire incidents per year is 108. The highest number of reported fires - 159 took place in 2006, and the least - 12 in 2004. The data has a dropping trend.
 When looking into fire subcategories, the most incidents belonged to: Structure Fires (41.5%), and Outside Fires (38.6%).