Estimated zip code population in 2022: 3,829 Zip code population in 2010: 3,946 Zip code population in 2000: 3,615
Houses and condos: 1,489 Renter-occupied apartments: 212
% of renters here:
16%
State:
33%
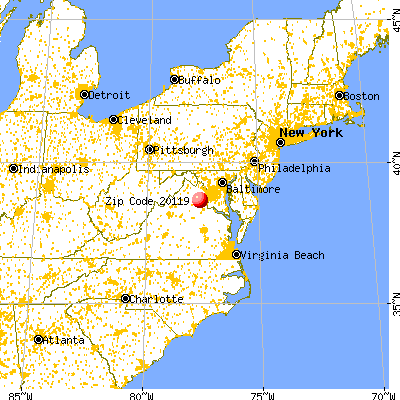
March 2022 cost of living index in zip code 20119: 131.3 (high, U.S. average is 100)
Land area: 63.9 sq. mi. Water area: 0.4 sq. mi.
Population density: 60 people per square mile
(very low).
OSM Map
General Map
Google Map
MSN Map
OSM Map
General Map
Google Map
MSN Map
OSM Map
General Map
Google Map
MSN Map
OSM Map
General Map
Google Map
MSN Map
Please wait while loading the map...
Real estate property taxes paid for housing units in 2022:
This zip code:
0.7% ($3,967)
Virginia:
0.7% ($2,617)
Median real estate property taxes paid for housing units with mortgages in 2022: $4,169 (0.7%) Median real estate property taxes paid for housing units with no mortgage in 2022: $3,755 (0.5%)
Business Search- 14 Million verified businesses
Males: 1,979
(51.7%)
Females: 1,850
(48.3%)
For population 25 years and over in 20119:
High school or higher: 94.2%
Bachelor's degree or higher: 37.6%
Graduate or professional degree: 18.4%
Unemployed: 1.9%
Mean travel time to work (commute): 39.2 minutes
For population 15 years and over in 20119:
Never married: 27.4%
Now married: 50.8%
Separated: 1.0%
Widowed: 6.2%
Divorced: 14.7%
Zip code 20119 compared to state average:
Median household income above state average.
Median house value above state average.
Unemployed percentage below state average.
Black race population percentage significantly below state average.
Median age above state average.
Foreign-born population percentage below state average.
Renting percentage below state average.
Length of stay since moving in significantly above state average.
Estimated median house/condo value in 2022: $599,348
20119:
$599,348
Virginia:
$365,700
According to our research of Virginia and other state lists, there were 8 registered sex offenders living in 20119 zip code as of May 28, 2024. The ratio of all residents to sex offenders in zip code 20119 is 556 to 1. The ratio of registered sex offenders to all residents in this zip code is lower than the state average.
Median resident age:
This zip code:
43.3 years
Virginia median age:
39.0 years
Average household size:
This zip code:
2.9 people
Virginia:
2.5 people
Averages for the 2020 tax year for zip code 20119, filed in 2021:
Average Adjusted Gross Income (AGI) in 2020: $87,121 (Individual Income Tax Returns)
Here:
$87,121
State:
$86,446
Salary/wage: $73,667 (reported on 79.8% of returns)
Here:
$73,667
State:
$71,185
(% of AGI for various income ranges: 1272.8% for AGIs below $25k, 3855.2% for AGIs $25k-50k, 6418.1% for AGIs $50k-75k, 9790.9% for AGIs $75k-100k, 19168.4% for AGIs $100k-200k, 53198.3% for AGIs over 200k)
Taxable interest for individuals: $1,529 (reported on 34.5% of returns)
This zip code:
$1,529
Virginia:
$1,805
(% of AGI for various income ranges: 26.2% for AGIs below $25k, 26.9% for AGIs $25k-50k, 48.6% for AGIs $50k-75k, 46.4% for AGIs $75k-100k, 134.0% for AGIs $100k-200k, 700.0% for AGIs over 200k)
Ordinary dividends: $5,038 (reported on 22.2% of returns)
Here:
$5,038
State:
$8,327
(% of AGI for various income ranges: 29.7% for AGIs below $25k, 51.4% for AGIs $25k-50k, 103.8% for AGIs $50k-75k, 105.5% for AGIs $75k-100k, 282.8% for AGIs $100k-200k, 1636.7% for AGIs over 200k)
Net capital gain/loss in AGI: +$34,568 (reported on 19.7% of returns)
Here:
+$34,568
State:
+$24,644
(% of AGI for various income ranges: 14.4% for AGIs below $25k, 21.0% for AGIs $25k-50k, 166.7% for AGIs $50k-75k, 163.6% for AGIs $75k-100k, 804.4% for AGIs $100k-200k, 18631.7% for AGIs over 200k)
Profit/loss from business: +$13,413 (reported on 19.2% of returns)
Here:
+$13,413
State:
+$12,836
(% of AGI for various income ranges: 260.3% for AGIs below $25k, 363.8% for AGIs $25k-50k, 323.8% for AGIs $50k-75k, 311.8% for AGIs $75k-100k, 514.8% for AGIs $100k-200k, 1721.7% for AGIs over 200k)
Taxable individual retirement arrangement distribution: $19,682 (reported on 8.4% of returns)
20119:
$19,682
Virginia:
$21,535
(% of AGI for various income ranges: 44.4% for AGIs below $25k, 93.4% for AGIs $25k-50k, 183.3% for AGIs $50k-75k, 356.4% for AGIs $75k-100k, 494.8% for AGIs $100k-200k, 1531.7% for AGIs over 200k)
Total itemized deductions: $30,041 (reported on 19.2% of returns)
Here:
$30,041
State:
$33,287
(% of AGI for various income ranges: 121.6% for AGIs below $25k, 187.9% for AGIs $25k-50k, 619.5% for AGIs $50k-75k, 1254.5% for AGIs $75k-100k, 1953.2% for AGIs $100k-200k, 5363.3% for AGIs over 200k)
Charity contributions: $7,468 (reported on 15.3% of returns)
Here:
$7,468
State:
$10,381
(% of AGI for various income ranges: 36.6% for AGIs below $25k, 68.6% for AGIs $50k-75k, 210.9% for AGIs $75k-100k, 338.0% for AGIs $100k-200k, 1628.3% for AGIs over 200k)
Taxes paid: $8,438 (reported on 19.2% of returns)
20119:
$8,438
State:
$8,284
(% of AGI for various income ranges: 31.2% for AGIs below $25k, 47.9% for AGIs $25k-50k, 167.1% for AGIs $50k-75k, 358.2% for AGIs $75k-100k, 586.4% for AGIs $100k-200k, 1401.7% for AGIs over 200k)
Earned income credit: $2,088 (reported on 8.4% of returns)
Here:
$2,088
State:
$2,214
(% of AGI for various income ranges: 70.6% for AGIs below $25k, 44.5% for AGIs $25k-50k)
Percentage of individuals using paid preparers for their 2020 taxes: 90.1%
Here:
90%
State:
92%
(% for various income ranges: 86.8% for AGIs below $25k, 90.2% for AGIs $25k-50k, 93.3% for AGIs $50k-75k, 88.2% for AGIs $75k-100k, 91.3% for AGIs $100k-200k, 93.8% for AGIs over 200k)
Averages for the 2012 tax year for zip code 20119, filed in 2013:
Average Adjusted Gross Income (AGI) in 2012: $69,648 (Individual Income Tax Returns)
Here:
$69,648
State:
$71,192
Salary/wage: $61,619 (reported on 83.0% of returns)
Here:
$61,619
State:
$59,229
(% of AGI for various income ranges: 77.2% for AGIs below $25k, 78.1% for AGIs $25k-50k, 74.6% for AGIs $50k-75k, 73.3% for AGIs $75k-100k, 81.0% for AGIs $100k-200k, 56.3% for AGIs over 200k)
Taxable interest for individuals: $1,603 (reported on 38.5% of returns)
This zip code:
$1,603
Virginia:
$1,600
(% of AGI for various income ranges: 0.9% for AGIs below $25k, 0.8% for AGIs $25k-50k, 0.9% for AGIs $50k-75k, 0.6% for AGIs $75k-100k, 0.7% for AGIs $100k-200k, 1.4% for AGIs over 200k)
Ordinary dividends: $3,746 (reported on 22.5% of returns)
Here:
$3,746
State:
$6,959
(% of AGI for various income ranges: 0.5% for AGIs below $25k, 1.3% for AGIs $25k-50k, 0.5% for AGIs $50k-75k, 0.8% for AGIs $75k-100k, 0.9% for AGIs $100k-200k, 2.6% for AGIs over 200k)
Net capital gain/loss in AGI: +$4,739 (reported on 15.4% of returns)
Here:
+$4,739
State:
+$16,672
(% of AGI for various income ranges: 0.4% for AGIs $50k-75k, 0.2% for AGIs $75k-100k, 1.1% for AGIs $100k-200k, 2.8% for AGIs over 200k)
Profit/loss from business: +$11,142 (reported on 18.1% of returns)
Here:
+$11,142
State:
+$14,116
(% of AGI for various income ranges: 8.1% for AGIs below $25k, 3.2% for AGIs $25k-50k, 3.5% for AGIs $50k-75k, 2.7% for AGIs $75k-100k, 3.7% for AGIs $100k-200k)
Taxable individual retirement arrangement distribution: $15,412 (reported on 8.8% of returns)
20119:
$15,412
Virginia:
$16,667
(% of AGI for various income ranges: 2.4% for AGIs below $25k, 1.7% for AGIs $25k-50k, 1.9% for AGIs $50k-75k, 2.1% for AGIs $75k-100k, 3.1% for AGIs $100k-200k)
Total itemized deductions: $26,071 (23% of AGI, reported on 45.6% of returns)
Here:
$26,071
State:
$26,596
Here:
23.2% of AGI
State:
20.1% of AGI
(% of AGI for various income ranges: 14.1% for AGIs below $25k, 14.5% for AGIs $25k-50k, 15.1% for AGIs $50k-75k, 17.6% for AGIs $75k-100k, 19.0% for AGIs $100k-200k, 16.8% for AGIs over 200k)
Charity contributions: $4,776 (reported on 34.6% of returns)
Here:
$4,776
State:
$4,443
(% of AGI for various income ranges: 0.4% for AGIs below $25k, 1.8% for AGIs $25k-50k, 1.8% for AGIs $50k-75k, 2.4% for AGIs $75k-100k, 2.1% for AGIs $100k-200k, 4.1% for AGIs over 200k)
Taxes paid: $9,265 (reported on 45.1% of returns)
20119:
$9,265
State:
$9,951
(% of AGI for various income ranges: 2.8% for AGIs below $25k, 3.0% for AGIs $25k-50k, 4.7% for AGIs $50k-75k, 5.9% for AGIs $75k-100k, 7.1% for AGIs $100k-200k, 7.5% for AGIs over 200k)
Earned income credit: $2,032 (reported on 12.1% of returns)
Here:
$2,032
State:
$2,211
(% of AGI for various income ranges: 5.3% for AGIs below $25k, 0.7% for AGIs $25k-50k)
Percentage of individuals using paid preparers for their 2012 taxes: 48.4%
Here:
48%
State:
46%
(% for various income ranges: 45.5% for AGIs below $25k, 46.2% for AGIs $25k-50k, 51.9% for AGIs $50k-75k, 50.0% for AGIs $75k-100k, 48.5% for AGIs $100k-200k, 62.5% for AGIs over 200k)
Averages for the 2004 tax year for zip code 20119, filed in 2005:
Average Adjusted Gross Income (AGI) in 2004: $74,597 (Individual Income Tax Returns)
Here:
$74,597
State:
$56,704
Salary/wage: $53,305 (reported on 85.0% of returns)
Here:
$53,305
State:
$48,441
(% of AGI for various income ranges: 72.8% for AGIs $10k-25k, 80.3% for AGIs $25k-50k, 75.0% for AGIs $50k-75k, 81.7% for AGIs $75k-100k, 46.3% for AGIs over 100k)
Taxable interest for individuals: $2,280 (reported on 48.2% of returns)
This zip code:
$2,280
Virginia:
$1,688
(% of AGI for various income ranges: 2.6% for AGIs $10k-25k, 1.5% for AGIs $25k-50k, 2.1% for AGIs $50k-75k, 1.0% for AGIs $75k-100k, 1.3% for AGIs over 100k)
Taxable dividends: $2,619 (reported on 22.6% of returns)
Here:
$2,619
State:
$4,028
(% of AGI for various income ranges: 1.1% for AGIs $10k-25k, 0.8% for AGIs $25k-50k, 0.5% for AGIs $50k-75k, 0.6% for AGIs $75k-100k, 0.9% for AGIs over 100k)
Net capital gain/loss: +$13,389 (reported on 18.7% of returns)
Here:
+$13,389
State:
+$14,375
(% of AGI for various income ranges: 1.3% for AGIs $10k-25k, 0.0% for AGIs $25k-50k, 0.8% for AGIs $50k-75k, 0.0% for AGIs $75k-100k, 5.3% for AGIs over 100k)
Profit/loss from business: +$15,802 (reported on 17.9% of returns)
Here:
+$15,802
State:
+$13,342
(% of AGI for various income ranges: 8.0% for AGIs $10k-25k, 2.8% for AGIs $25k-50k, 9.0% for AGIs $50k-75k, 3.2% for AGIs $75k-100k, 2.8% for AGIs over 100k)
IRA payment deduction: $3,375 (reported on 3.9% of returns)
20119:
$3,375
Virginia:
$2,943
(% of AGI for various income ranges: 1.1% for AGIs $10k-25k, 0.4% for AGIs $50k-75k, 0.2% for AGIs $75k-100k, 0.1% for AGIs over 100k)
Self-employed pension: $10,833 (reported on 0.7% of returns)
Here:
$10,833
Virginia:
$17,430
Total itemized deductions: $23,892 (19% of AGI, reported on 47.5% of returns)
Here:
$23,892
State:
$21,492
Here:
18.8% of AGI
State:
21.0% of AGI
(% of AGI for various income ranges: 12.6% for AGIs $10k-25k, 17.6% for AGIs $25k-50k, 18.9% for AGIs $50k-75k, 19.1% for AGIs $75k-100k, 13.3% for AGIs over 100k)
Charity contributions deductions: $3,199 (3% of AGI, reported on 39.9% of returns)
Here:
$3,199
State:
$3,794
Here:
3.1% of AGI
State:
3.5% of AGI
(% of AGI for various income ranges: 1.2% for AGIs $10k-25k, 2.1% for AGIs $25k-50k, 1.9% for AGIs $50k-75k, 2.0% for AGIs $75k-100k, 1.6% for AGIs over 100k)
Total tax: $12,244 (reported on 82.4% of returns)
20119:
$12,244
State:
$9,537
(% of AGI for various income ranges: 5.6% for AGIs $10k-25k, 7.5% for AGIs $25k-50k, 9.6% for AGIs $50k-75k, 10.0% for AGIs $75k-100k, 16.7% for AGIs over 100k)
Earned income credit: $1,445 (reported on 7.8% of returns)
Here:
$1,445
State:
$1,734
Percentage of individuals using paid preparers for their 2004 taxes: 51.8%
Here:
52%
State:
52%
(% for various income ranges: 42.9% for AGIs below $10k, 51.3% for AGIs $10k-25k, 52.8% for AGIs $25k-50k, 58.7% for AGIs $50k-75k, 56.4% for AGIs $75k-100k, 50.7% for AGIs over 100k)
Household received Food Stamps/SNAP in the past 12 months: 21 Household did not receive Food Stamps/SNAP in the past 12 months: 1,296
Women who had a birth in the past 12 months: 24 (24 now married, 0 unmarried) Women who did not have a birth in the past 12 months: 814 (271 now married, 546 unmarried)
Housing units in zip code 20119 with a mortgage: 776 (97 second mortgage, 74 both second mortgage and home equity loan) Houses without a mortgage: 6
Median monthly owner costs for units with a mortgage: $2,740 Median monthly owner costs for units without a mortgage: $645
Residents with income below the poverty level in 2022:
This zip code:
7.4%
Whole state:
10.6%
Residents with income below 50% of the poverty level in 2022:
This zip code:
1.3%
Whole state:
5.2%
Median number of rooms in houses and condos:
Here:
8.2
State:
7.0
Median number of rooms in apartments:
Here:
7.1
State:
4.3
Notable locations in this zip code not listed on our city pages
Notable locations in zip code 20119: Camp Goettge (A), Cedar Run Volunteer Rescue Squad 12 (B), Cedar Run Volunteer Rescue Squad (C), Catlett Volunteer Fire and Rescue Company (D). Display/hide their locations on the map
Churches in zip code 20119 include: Cross Road Church (A), Calverton Methodist Episcopal Church (B), Catlett Assembly of God Church (C), Catlett Nazarene Church (D), Auburn Church (E), Saint Stephens Church (F), Calvary Church (G), Zoar Church (H), Faith Christian Fellowship (I). Display/hide their locations on the map
Streams, rivers, and creeks: Walnut Branch (A), Owl Run (B), Negro Run (C), Licking Run (D), Furrs Run (E), Elk Run (F), Anderson Branch (G), Windright Run (H). Display/hide their locations on the map
In group quarters: 5 (-1 institutionalized population)
Size of family households: 409 2-persons, 153 3-persons, 262 4-persons, 71 5-persons, 32 6-persons, 35 7-or-more-persons
Size of nonfamily households: 278 1-person, 91 2-persons
265 married couples with children.
247 single-parent households (187 men, 60 women).
88.5% of residents of 20119 zip code speak English at home.
5.8% of residents speak Spanish at home (54% very well, 27% well, 8% not well, 10% not at all).
3.1% of residents speak other Indo-European language at home (90% very well, 10% well).
2.0% of residents speak Asian or Pacific Island language at home (63% very well, 37% not well).
Foreign born population: 274 (7.2%) (40.6% of them are naturalized citizens)
This zip code:
7.2%
Whole state:
12.7%
16%Malaysia
13%Honduras
10%Japan
9%El Salvador
8%Guyana
5%Argentina
4%Sweden
13%English
11%Irish
10%German
9%Scottish
8%American
8%Scandinavian
5%Greek
Year of entry for the foreign-born population
412010 or later
812000 to 2009
1051990 to 1999
176Before 1990
Facilities with environmental interests located in this zip code:
DOMINION TRANSMISSION INCORPORATED - QUANTICO (2092 LAWS FORD ROAD in CATLETT, VA)
STATE MASTER (Virginia pollutants databases) - CEDS-41021, AIR PROGRAM Large Quantity Generators, more that 1000 kg of hazardous waste/month (Resource Conservation and Recovery Act (tracking hazardous waste)) - notification Business SIC classification: NATURAL GAS TRANSMISSION Business NAICS classification: PIPELINE TRANSPORTATION OF NATURAL GAS. Organizations: DOMINION TRANSMISSION, INC. (CONTACT/OPERATOR)
Alternative names: CNG TRANSMISSION QUANTICO M & R, DOMINION TRANSMISSION INC QUANTICO M&R, DOMINION TRANSMISSION INC QUANTICO M&R
DOMINION - QUANTICO COMPRESSOR STATION (2092 LAWS FORD RD in CATLETT, VA)
AIR MINOR (AIRS/AFS) Business SIC classification: NATURAL GAS TRANSMISSION Alternative names: DOMINION TRANSMISSION INC-QUANTICO COMPR
EARL A TAPP INCORPORATED (4002 CATLETT ROAD in CATLETT, VA)
AIR MINOR (AIRS/AFS) Business SIC classification: READY-MIXED CONCRETE
46.8%Electricity
24.7%Bottled, tank, or LP gas
13.7%Fuel oil, kerosene, etc.
11.9%Wood
2.1%Utility gas
1.2%No fuel used
Place of birth for U.S.-born residents:
This state: 1,574
Northeast: 735
Midwest: 315
South: 542
West: 245
65% of the 20119 zip code residents lived in the same house 5 years ago. Out of people who lived in different houses, 30% lived in this county. Out of people who lived in different counties, 50% lived in Virginia.
97% of the 20119 zip code residents lived in the same house 1 year ago. Out of people who lived in different houses, 121% moved from different county within same state.
Private vs. public school enrollment:
Students in private schools in grades 1 to 8 (elementary and middle school): 55
Here:
17.1%
Virginia:
13.2%
Students in private schools in grades 9 to 12 (high school): 16
Here:
9.0%
Virginia:
10.2%
Students in private undergraduate colleges:
Here:
0.0%
Virginia:
18.7%
Occupation by median earnings in the past 12 months ($)
134,722Business and financial operations occupations
102,119Management occupations
90,002Sales and related occupations
73,257Computer and mathematical occupations
70,975Education, training, and library occupations
65,125Arts, design, entertainment, sports, and media occupations
Top industries in this zip code by the number of employees in 2005:
2002 - 2018 National Fire Incident Reporting System (NFIRS) incidents
According to the data from the years 2002 - 2018 the average number of fires per year is 26. The highest number of fires - 44 took place in 2010, and the least - 2 in 2002. The data has an increasing trend.
When looking into fire subcategories, the most reports belonged to: Outside Fires (41.0%), and Structure Fires (36.6%).
Fire incident types reported to NFIRS in Zip Code 20119


 Nearest zip codes: 22728, 20139, 20181, 22720, 22712, 20136.


 According to the data from the years 2002 - 2018 the average number of fires per year is 26. The highest number of fires - 44 took place in 2010, and the least - 2 in 2002. The data has an increasing trend.
 When looking into fire subcategories, the most reports belonged to: Outside Fires (41.0%), and Structure Fires (36.6%).