Estimated zip code population in 2022: 1,284 Zip code population in 2010: 1,059 Zip code population in 2000: 965
Houses and condos: 421 Renter-occupied apartments: 51
% of renters here:
13%
State:
33%
March 2022 cost of living index in zip code 22720: 123.9 (high, U.S. average is 100)
Land area: 20.7 sq. mi. Water area: 0.1 sq. mi.
Population density: 62 people per square mile
(very low).
OSM Map
General Map
Google Map
MSN Map
OSM Map
General Map
Google Map
MSN Map
OSM Map
General Map
Google Map
MSN Map
OSM Map
General Map
Google Map
MSN Map
Please wait while loading the map...
Real estate property taxes paid for housing units in 2022:
This zip code:
0.7% ($3,650)
Virginia:
0.7% ($2,617)
Median real estate property taxes paid for housing units with mortgages in 2022: $3,602 (0.6%) Median real estate property taxes paid for housing units with no mortgage in 2022: $3,791 (0.8%)
Business Search- 14 Million verified businesses
Males: 652
(50.8%)
Females: 632
(49.2%)
For population 25 years and over in 22720:
High school or higher: 94.1%
Bachelor's degree or higher: 25.4%
Graduate or professional degree: 14.1%
Mean travel time to work (commute): 37.1 minutes
For population 15 years and over in 22720:
Never married: 23.6%
Now married: 70.5%
Separated: 0.7%
Widowed: 1.1%
Divorced: 4.1%
Zip code 22720 compared to state average:
Median household income above state average.
Unemployed percentage significantly below state average.
Black race population percentage significantly below state average.
Hispanic race population percentage below state average.
Foreign-born population percentage significantly below state average.
Renting percentage significantly below state average.
Length of stay since moving in significantly above state average.
Number of rooms per house above state average.
House age below state average.
Percentage of population with a bachelor's degree or higher below state average.
Estimated median house/condo value in 2022: $533,052
22720:
$533,052
Virginia:
$365,700
According to our research of Virginia and other state lists, there were 3 registered sex offenders living in 22720 zip code as of June 07, 2024. The ratio of all residents to sex offenders in zip code 22720 is 363 to 1. The ratio of registered sex offenders to all residents in this zip code is near the state average.
Median resident age:
This zip code:
40.6 years
Virginia median age:
39.0 years
Average household size:
This zip code:
3.3 people
Virginia:
2.5 people
Averages for the 2020 tax year for zip code 22720, filed in 2021:
Average Adjusted Gross Income (AGI) in 2020: $88,626 (Individual Income Tax Returns)
Here:
$88,626
State:
$86,446
Salary/wage: $78,318 (reported on 82.6% of returns)
Here:
$78,318
State:
$71,185
(% of AGI for various income ranges: 1355.0% for AGIs below $25k, 3368.8% for AGIs $25k-50k, 7277.5% for AGIs $50k-75k, 7390.0% for AGIs $75k-100k, 16465.6% for AGIs $100k-200k)
Taxable interest for individuals: $583 (reported on 39.1% of returns)
This zip code:
$583
Virginia:
$1,805
(% of AGI for various income ranges: 16.2% for AGIs $25k-50k, 17.5% for AGIs $50k-75k, 30.0% for AGIs $75k-100k, 53.3% for AGIs $100k-200k)
Ordinary dividends: $5,082 (reported on 23.9% of returns)
Here:
$5,082
State:
$8,327
(% of AGI for various income ranges: 60.0% for AGIs below $25k, 260.0% for AGIs $50k-75k, 465.6% for AGIs $100k-200k)
Net capital gain/loss in AGI: +$8,750 (reported on 21.7% of returns)
Here:
+$8,750
State:
+$24,644
(% of AGI for various income ranges: 30.0% for AGIs below $25k, 197.5% for AGIs $50k-75k, 864.4% for AGIs $100k-200k)
Profit/loss from business: +$3,425 (reported on 17.4% of returns)
Here:
+$3,425
State:
+$12,836
(% of AGI for various income ranges: 225.0% for AGIs $25k-50k, 104.4% for AGIs $100k-200k)
Taxable individual retirement arrangement distribution: $14,700 (reported on 8.7% of returns)
22720:
$14,700
Virginia:
$21,535
(% of AGI for various income ranges: 1470.0% for AGIs $75k-100k)
Total itemized deductions: $24,827 (reported on 23.9% of returns)
Here:
$24,827
State:
$33,287
(% of AGI for various income ranges: 1910.0% for AGIs $50k-75k, 2185.6% for AGIs $100k-200k)
Charity contributions: $4,200 (reported on 15.2% of returns)
Here:
$4,200
State:
$10,381
(% of AGI for various income ranges: 75.0% for AGIs $25k-50k, 260.0% for AGIs $100k-200k)
Taxes paid: $7,991 (reported on 23.9% of returns)
22720:
$7,991
State:
$8,284
(% of AGI for various income ranges: 605.0% for AGIs $50k-75k, 707.8% for AGIs $100k-200k)
Earned income credit: $2,000 (reported on 6.5% of returns)
Here:
$2,000
State:
$2,214
(% of AGI for various income ranges: 100.0% for AGIs below $25k)
Percentage of individuals using paid preparers for their 2020 taxes: 91.3%
Here:
91%
State:
92%
(% for various income ranges: 88.9% for AGIs below $25k, 90.0% for AGIs $25k-50k, 83.3% for AGIs $50k-75k, 100.0% for AGIs $75k-100k, 92.3% for AGIs $100k-200k, 100.0% for AGIs over 200k)
Averages for the 2012 tax year for zip code 22720, filed in 2013:
Average Adjusted Gross Income (AGI) in 2012: $65,211 (Individual Income Tax Returns)
Here:
$65,211
State:
$71,192
Salary/wage: $58,736 (reported on 81.8% of returns)
Here:
$58,736
State:
$59,229
(% of AGI for various income ranges: 80.4% for AGIs below $25k, 75.0% for AGIs $25k-50k, 82.6% for AGIs $50k-75k, 73.1% for AGIs $75k-100k, 71.0% for AGIs $100k-200k)
Taxable interest for individuals: $588 (reported on 38.6% of returns)
This zip code:
$588
Virginia:
$1,600
(% of AGI for various income ranges: 2.1% for AGIs below $25k, 0.2% for AGIs $50k-75k, 0.5% for AGIs $75k-100k, 0.2% for AGIs $100k-200k)
Ordinary dividends: $1,100 (reported on 20.5% of returns)
Here:
$1,100
State:
$6,959
(% of AGI for various income ranges: 2.0% for AGIs below $25k, 0.7% for AGIs $50k-75k, 0.2% for AGIs $100k-200k)
Net capital gain/loss in AGI: +$650 (reported on 13.6% of returns)
Here:
+$650
State:
+$16,672
Profit/loss from business: +$5,157 (reported on 15.9% of returns)
Here:
+$5,157
State:
+$14,116
Taxable individual retirement arrangement distribution: $11,767 (reported on 6.8% of returns)
22720:
$11,767
Virginia:
$16,667
Total itemized deductions: $23,200 (22% of AGI, reported on 43.2% of returns)
Here:
$23,200
State:
$26,596
Here:
21.7% of AGI
State:
20.1% of AGI
(% of AGI for various income ranges: 27.0% for AGIs $25k-50k, 15.8% for AGIs $50k-75k, 14.5% for AGIs $75k-100k, 15.1% for AGIs $100k-200k)
Charity contributions: $2,143 (reported on 31.8% of returns)
Here:
$2,143
State:
$4,443
(% of AGI for various income ranges: 1.7% for AGIs below $25k, 1.1% for AGIs $50k-75k, 0.9% for AGIs $75k-100k, 1.2% for AGIs $100k-200k)
Taxes paid: $8,389 (reported on 43.2% of returns)
22720:
$8,389
State:
$9,951
(% of AGI for various income ranges: 9.3% for AGIs below $25k, 5.5% for AGIs $50k-75k, 4.9% for AGIs $75k-100k, 6.3% for AGIs $100k-200k)
Earned income credit: $1,980 (reported on 11.4% of returns)
Here:
$1,980
State:
$2,211
(% of AGI for various income ranges: 5.7% for AGIs below $25k)
Percentage of individuals using paid preparers for their 2012 taxes: 40.9%
Here:
41%
State:
46%
(% for various income ranges: 35.7% for AGIs below $25k, 25.0% for AGIs $25k-50k, 50.0% for AGIs $50k-75k, 60.0% for AGIs $75k-100k, 45.5% for AGIs $100k-200k)
Averages for the 2004 tax year for zip code 22720, filed in 2005:
Average Adjusted Gross Income (AGI) in 2004: $65,998 (Individual Income Tax Returns)
Here:
$65,998
State:
$56,704
Salary/wage: $52,467 (reported on 83.6% of returns)
Here:
$52,467
State:
$48,441
(% of AGI for various income ranges: 150.0% for AGIs below $10k, 87.4% for AGIs $10k-25k, 71.6% for AGIs $25k-50k, 69.2% for AGIs $50k-75k, 86.5% for AGIs $75k-100k, 56.0% for AGIs over 100k)
Taxable interest for individuals: $1,720 (reported on 51.9% of returns)
This zip code:
$1,720
Virginia:
$1,688
(% of AGI for various income ranges: 1.6% for AGIs $10k-25k, 4.6% for AGIs $25k-50k, 1.6% for AGIs $50k-75k, 1.1% for AGIs $75k-100k, 0.6% for AGIs over 100k)
Taxable dividends: $1,398 (reported on 24.5% of returns)
Here:
$1,398
State:
$4,028
(% of AGI for various income ranges: 0.4% for AGIs $10k-25k, 0.5% for AGIs $25k-50k, 0.5% for AGIs $50k-75k, 0.1% for AGIs $75k-100k, 0.6% for AGIs over 100k)
Net capital gain/loss: +$7,013 (reported on 18.8% of returns)
Here:
+$7,013
State:
+$14,375
(% of AGI for various income ranges: -0.9% for AGIs $10k-25k, 0.9% for AGIs $25k-50k, 0.7% for AGIs $50k-75k, 3.5% for AGIs over 100k)
Profit/loss from business: +$16,155 (reported on 16.9% of returns)
Here:
+$16,155
State:
+$13,342
(% of AGI for various income ranges: 7.1% for AGIs $10k-25k, 2.2% for AGIs $25k-50k, -0.5% for AGIs $50k-75k, 7.0% for AGIs over 100k)
Total itemized deductions: $19,923 (20% of AGI, reported on 52.6% of returns)
Here:
$19,923
State:
$21,492
Here:
19.6% of AGI
State:
21.0% of AGI
(% of AGI for various income ranges: 15.3% for AGIs $10k-25k, 20.8% for AGIs $25k-50k, 23.0% for AGIs $50k-75k, 19.7% for AGIs $75k-100k, 11.7% for AGIs over 100k)
Charity contributions deductions: $2,372 (2% of AGI, reported on 44.8% of returns)
Here:
$2,372
State:
$3,794
Here:
2.2% of AGI
State:
3.5% of AGI
(% of AGI for various income ranges: 2.4% for AGIs below $10k, 1.3% for AGIs $25k-50k, 2.0% for AGIs $50k-75k, 2.3% for AGIs $75k-100k, 1.5% for AGIs over 100k)
Total tax: $10,248 (reported on 80.7% of returns)
22720:
$10,248
State:
$9,537
(% of AGI for various income ranges: 6.2% for AGIs below $10k, 4.7% for AGIs $10k-25k, 7.2% for AGIs $25k-50k, 8.1% for AGIs $50k-75k, 10.4% for AGIs $75k-100k, 16.6% for AGIs over 100k)
Earned income credit: $1,474 (reported on 9.0% of returns)
Here:
$1,474
State:
$1,734
Percentage of individuals using paid preparers for their 2004 taxes: 58.3%
Here:
58%
State:
52%
(% for various income ranges: 37.3% for AGIs below $10k, 62.7% for AGIs $10k-25k, 58.5% for AGIs $25k-50k, 70.3% for AGIs $50k-75k, 54.5% for AGIs $75k-100k, 60.8% for AGIs over 100k)
Household received Food Stamps/SNAP in the past 12 months: 0 Household did not receive Food Stamps/SNAP in the past 12 months: 386
Women who did not have a birth in the past 12 months: 213 (125 now married, 86 unmarried)
Housing units in zip code 22720 with a mortgage: 235 (18 second mortgage, 18 both second mortgage and home equity loan) Median monthly owner costs for units with a mortgage: $2,319 Median monthly owner costs for units without a mortgage: $583
Residents with income below the poverty level in 2022:
This zip code:
1.6%
Whole state:
10.6%
Residents with income below 50% of the poverty level in 2022:
This zip code:
0.7%
Whole state:
5.2%
Median number of rooms in houses and condos:
Here:
7.2
State:
7.0
Median number of rooms in apartments:
Here:
6.8
State:
4.3
Notable locations in this zip code not listed on our city pages
Notable locations in zip code 22720: Thompsons Mill (A), Oders Corner (B), Goldvein Volunteer Fire and Rescue Company 8 (C). Display/hide their locations on the map
Churches in zip code 22720 include: Goldvein Baptist Church (A), Grove Baptist Church (B), Clevers Oak Church (C), Grace Church (D), Grove Churches (E). Display/hide their locations on the map
Size of family households: 90 2-persons, 99 3-persons, 67 4-persons, 63 5-persons, 5 6-persons
Size of nonfamily households: 37 1-person, 22 2-persons
337 married couples with children.
11 single-parent households (11 women).
94.3% of residents of 22720 zip code speak English at home.
4.6% of residents speak Spanish at home (37% very well, 63% well).
Foreign born population: 41 (3.3%) (0.0% of them are naturalized citizens)
:
3.3%
Whole state:
12.7%
80%Costa Rica
16%Australia
19%American
16%English
10%German
9%Irish
9%Scottish
2%European
2%Russian
Year of entry for the foreign-born population
02010 or later
212000 to 2009
201990 to 1999
10Before 1990
57.7%Electricity
22.0%Wood
19.1%Bottled, tank, or LP gas
1.3%Other fuel
Population in 1990: 1,154.
Place of birth for U.S.-born residents:
This state: 649
Northeast: 131
Midwest: 50
South: 334
West: 61
65% of the 22720 zip code residents lived in the same house 5 years ago. Out of people who lived in different houses, 11% lived in this county. Out of people who lived in different counties, 50% lived in Virginia.
81% of the 22720 zip code residents lived in the same house 1 year ago. Out of people who lived in different houses, 10% moved from this county. Out of people who lived in different houses, 43% moved from different county within same state. Out of people who lived in different houses, 49% moved from different state.
Private vs. public school enrollment:
Students in private schools in grades 1 to 8 (elementary and middle school): 125
Here:
49.1%
Virginia:
13.2%
Students in private schools in grades 9 to 12 (high school):
Here:
0.0%
Virginia:
10.2%
Students in private undergraduate colleges:
Here:
0.0%
Virginia:
18.7%
Occupation by median earnings in the past 12 months ($)
159,980Business and financial operations occupations
146,267Architecture and engineering occupations
101,068Health diagnosing and treating practitioners and other technical occupations
85,378Transportation occupations
73,543Construction and extraction occupations
52,411Management occupations
Top industries in this zip code by the number of employees in 2005:
Health Care and Social Assistance: Residential Mental Health and Substance Abuse Facilities (20-49 employees: 1 establishment)
Other Services (except Public Administration): Pet Care (except Veterinary) Services (10-19: 1)
Other Services (except Public Administration): Religious Organizations (5-9: 1)
Construction: Electrical Contractors (1-4: 1)
Real Estate and Rental and Leasing: Offices of Real Estate Agents and Brokers (1-4: 1)
Construction: Site Preparation Contractors (1-4: 1)
Other Services (except Public Administration): Computer and Office Machine Repair and Maintenance (1-4: 1)
Construction: Masonry Contractors (1-4: 1)
People in group quarters in 2000:
26 people in homes or halfway houses for drug/alcohol abuse
Home Mortgage Disclosure Act Aggregated Statistics For Year 2009 (Based on 2 partial tracts)
A) FHA, FSA/RHS & VA Home Purchase Loans
B) Conventional Home Purchase Loans
C) Refinancings
D) Home Improvement Loans
F) Non-occupant Loans on < 5 Family Dwellings (A B C & D)
Number
Average Value
Number
Average Value
Number
Average Value
Number
Average Value
Number
Average Value
LOANS ORIGINATED
12
$231,394
6
$219,898
50
$274,520
3
$80,180
3
$380,157
APPLICATIONS APPROVED, NOT ACCEPTED
1
$294,030
0
$0
3
$215,207
0
$0
0
$0
APPLICATIONS DENIED
2
$200,190
2
$165,160
22
$332,620
3
$115,737
1
$74,450
APPLICATIONS WITHDRAWN
1
$182,360
1
$167,350
13
$289,148
0
$0
1
$157,650
FILES CLOSED FOR INCOMPLETENESS
0
$0
0
$0
4
$394,598
0
$0
0
$0
Aggregated Statistics For Year 2008 (Based on 2 partial tracts)
A) FHA, FSA/RHS & VA Home Purchase Loans
B) Conventional Home Purchase Loans
C) Refinancings
D) Home Improvement Loans
F) Non-occupant Loans on < 5 Family Dwellings (A B C & D)
G) Loans On Manufactured Home Dwelling (A B C & D)
Number
Average Value
Number
Average Value
Number
Average Value
Number
Average Value
Number
Average Value
Number
Average Value
LOANS ORIGINATED
5
$202,382
5
$270,446
33
$263,577
7
$118,640
2
$224,435
0
$0
APPLICATIONS APPROVED, NOT ACCEPTED
0
$0
0
$0
3
$239,083
1
$100,720
0
$0
0
$0
APPLICATIONS DENIED
0
$0
2
$240,230
36
$302,208
5
$144,638
1
$155,460
1
$41,600
APPLICATIONS WITHDRAWN
1
$179,230
2
$273,855
14
$319,681
2
$97,595
1
$208,950
0
$0
FILES CLOSED FOR INCOMPLETENESS
0
$0
1
$109,790
3
$380,363
0
$0
1
$281,830
0
$0
Aggregated Statistics For Year 2007 (Based on 2 partial tracts)
B) Conventional Home Purchase Loans
C) Refinancings
D) Home Improvement Loans
F) Non-occupant Loans on < 5 Family Dwellings (A B C & D)
G) Loans On Manufactured Home Dwelling (A B C & D)
Number
Average Value
Number
Average Value
Number
Average Value
Number
Average Value
Number
Average Value
LOANS ORIGINATED
21
$306,470
57
$280,911
12
$109,715
4
$258,295
1
$122,620
APPLICATIONS APPROVED, NOT ACCEPTED
2
$150,455
11
$223,795
2
$118,865
1
$324,690
0
$0
APPLICATIONS DENIED
5
$271,510
47
$328,174
8
$120,311
1
$383,810
2
$37,535
APPLICATIONS WITHDRAWN
3
$247,633
19
$293,209
0
$0
1
$274,950
0
$0
FILES CLOSED FOR INCOMPLETENESS
0
$0
8
$340,561
0
$0
0
$0
0
$0
Aggregated Statistics For Year 2006 (Based on 2 partial tracts)
A) FHA, FSA/RHS & VA Home Purchase Loans
B) Conventional Home Purchase Loans
C) Refinancings
D) Home Improvement Loans
F) Non-occupant Loans on < 5 Family Dwellings (A B C & D)
G) Loans On Manufactured Home Dwelling (A B C & D)
Number
Average Value
Number
Average Value
Number
Average Value
Number
Average Value
Number
Average Value
Number
Average Value
LOANS ORIGINATED
1
$391,310
33
$272,856
87
$269,792
18
$84,074
7
$232,769
0
$0
APPLICATIONS APPROVED, NOT ACCEPTED
0
$0
4
$297,395
11
$230,818
2
$57,240
2
$164,845
0
$0
APPLICATIONS DENIED
0
$0
8
$384,196
37
$320,527
7
$68,549
3
$152,230
1
$30,340
APPLICATIONS WITHDRAWN
0
$0
4
$272,840
26
$274,819
2
$168,755
2
$108,070
0
$0
FILES CLOSED FOR INCOMPLETENESS
1
$143,260
1
$413,830
5
$283,210
1
$68,820
1
$179,550
0
$0
Aggregated Statistics For Year 2005 (Based on 2 partial tracts)
B) Conventional Home Purchase Loans
C) Refinancings
D) Home Improvement Loans
F) Non-occupant Loans on < 5 Family Dwellings (A B C & D)
Number
Average Value
Number
Average Value
Number
Average Value
Number
Average Value
LOANS ORIGINATED
42
$297,197
97
$232,849
14
$137,297
3
$259,937
APPLICATIONS APPROVED, NOT ACCEPTED
5
$224,904
11
$247,681
4
$101,738
1
$257,120
APPLICATIONS DENIED
4
$362,145
35
$233,385
7
$91,606
1
$132,310
APPLICATIONS WITHDRAWN
4
$264,002
26
$224,350
4
$173,760
1
$211,450
FILES CLOSED FOR INCOMPLETENESS
2
$316,710
7
$244,386
0
$0
0
$0
Aggregated Statistics For Year 2004 (Based on 2 partial tracts)
A) FHA, FSA/RHS & VA Home Purchase Loans
B) Conventional Home Purchase Loans
C) Refinancings
D) Home Improvement Loans
F) Non-occupant Loans on < 5 Family Dwellings (A B C & D)
G) Loans On Manufactured Home Dwelling (A B C & D)
Number
Average Value
Number
Average Value
Number
Average Value
Number
Average Value
Number
Average Value
Number
Average Value
LOANS ORIGINATED
3
$185,593
53
$237,533
96
$203,652
13
$77,334
5
$177,920
1
$18,140
APPLICATIONS APPROVED, NOT ACCEPTED
0
$0
3
$339,807
12
$201,808
2
$36,600
0
$0
0
$0
APPLICATIONS DENIED
0
$0
7
$232,366
40
$180,759
12
$57,268
1
$138,260
0
$0
APPLICATIONS WITHDRAWN
0
$0
4
$284,725
32
$189,889
4
$82,422
1
$121,990
0
$0
FILES CLOSED FOR INCOMPLETENESS
0
$0
2
$217,550
7
$194,339
0
$0
0
$0
1
$84,460
Aggregated Statistics For Year 2003 (Based on 2 partial tracts)
A) FHA, FSA/RHS & VA Home Purchase Loans
B) Conventional Home Purchase Loans
C) Refinancings
D) Home Improvement Loans
F) Non-occupant Loans on < 5 Family Dwellings (A B C & D)
Number
Average Value
Number
Average Value
Number
Average Value
Number
Average Value
Number
Average Value
LOANS ORIGINATED
6
$188,932
35
$188,163
169
$174,383
9
$50,778
5
$163,156
APPLICATIONS APPROVED, NOT ACCEPTED
0
$0
4
$197,845
21
$159,811
3
$27,840
1
$103,540
APPLICATIONS DENIED
0
$0
4
$256,340
38
$163,520
7
$24,309
3
$160,153
APPLICATIONS WITHDRAWN
2
$162,345
3
$198,733
24
$161,770
2
$25,805
1
$171,730
FILES CLOSED FOR INCOMPLETENESS
0
$0
0
$0
9
$169,086
0
$0
0
$0
Aggregated Statistics For Year 1999 (Based on 1 partial tract)
A) FHA, FSA/RHS & VA Home Purchase Loans
B) Conventional Home Purchase Loans
C) Refinancings
D) Home Improvement Loans
F) Non-occupant Loans on < 5 Family Dwellings (A B C & D)
Detailed PMIC statistics for the following Tracts:9907.01
2002 - 2018 National Fire Incident Reporting System (NFIRS) incidents
According to the data from the years 2002 - 2018 the average number of fire incidents per year is 6. The highest number of reported fires - 18 took place in 2012, and the least - 1 in 2007. The data has a rising trend.
When looking into fire subcategories, the most reports belonged to: Structure Fires (51.4%), and Outside Fires (33.3%).
Fire incident types reported to NFIRS in Zip Code 22720

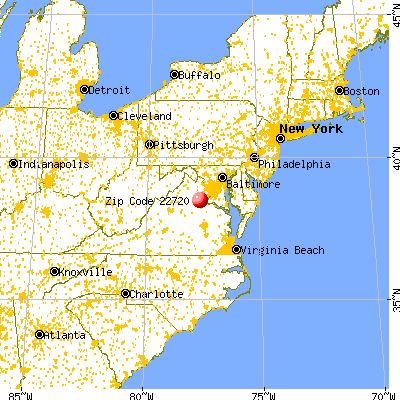


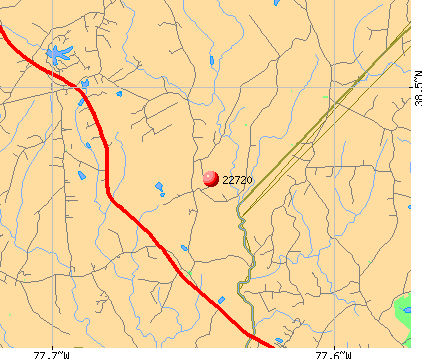 Nearest zip codes: 22742, 22736, 22406, 22728, 22556, 20119.


 According to the data from the years 2002 - 2018 the average number of fire incidents per year is 6. The highest number of reported fires - 18 took place in 2012, and the least - 1 in 2007. The data has a rising trend.
 When looking into fire subcategories, the most reports belonged to: Structure Fires (51.4%), and Outside Fires (33.3%).