Estimated zip code population in 2022: 2,186 Zip code population in 2010: 2,492 Zip code population in 2000: 2,112
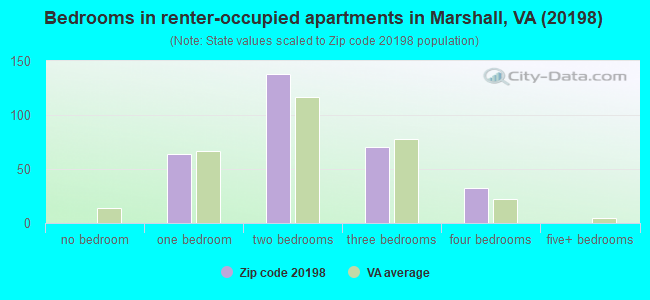
Houses and condos: 1,066 Renter-occupied apartments: 306
% of renters here:
35%
State:
33%
March 2022 cost of living index in zip code 20198: 142.2 (very high, U.S. average is 100)
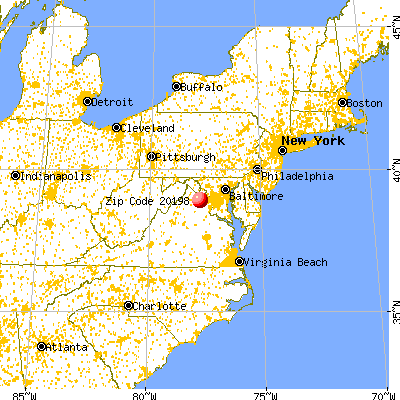
Land area: 72.8 sq. mi. Water area: 0.3 sq. mi.
Population density: 30 people per square mile
(very low).
OSM Map
General Map
Google Map
MSN Map
OSM Map
General Map
Google Map
MSN Map
OSM Map
General Map
Google Map
MSN Map
OSM Map
General Map
Google Map
MSN Map
Please wait while loading the map...
Real estate property taxes paid for housing units in 2022:
This zip code:
1.0% ($10,016)
Virginia:
0.7% ($2,617)
Median real estate property taxes paid for housing units with mortgages in 2022: $8,275 (1.0%) Median real estate property taxes paid for housing units with no mortgage in 2022: $10,355 (0.6%)
Business Search- 14 Million verified businesses
Males: 987
(45.1%)
Females: 1,199
(54.9%)
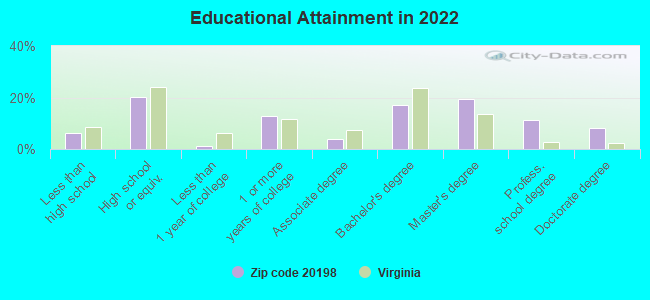
For population 25 years and over in 20198:
High school or higher: 93.3%
Bachelor's degree or higher: 55.6%
Graduate or professional degree: 38.7%
Unemployed: 0.9%
Mean travel time to work (commute): 23.6 minutes
For population 15 years and over in 20198:
Never married: 32.8%
Now married: 57.1%
Separated: 0.0%
Widowed: 4.5%
Divorced: 5.6%
Zip code 20198 compared to state average:
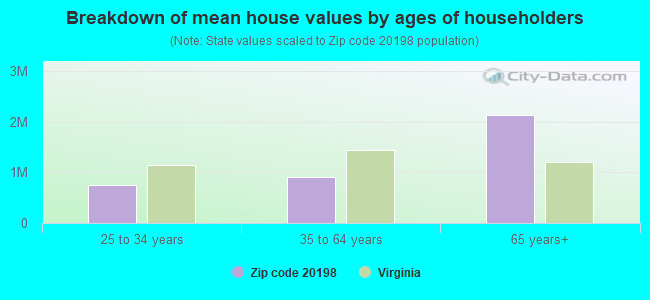
Median house value significantly above state average.
Unemployed percentage significantly below state average.
Black race population percentage significantly below state average.
Median age above state average.
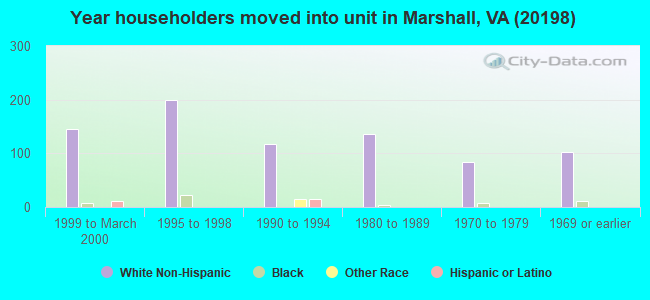
Length of stay since moving in significantly above state average.
Estimated median house/condo value in 2022: $1,021,980
20198:
$1,021,980
Virginia:
$365,700
According to our research of Virginia and other state lists, there were 3 registered sex offenders living in 20198 zip code as of May 28, 2024. The ratio of all residents to sex offenders in zip code 20198 is 793 to 1. The ratio of registered sex offenders to all residents in this zip code is lower than the state average.
Median resident age:
This zip code:
43.5 years
Virginia median age:
39.0 years
Average household size:
This zip code:
2.5 people
Virginia:
2.5 people
Averages for the 2020 tax year for zip code 20198, filed in 2021:
Average Adjusted Gross Income (AGI) in 2020: $247,276 (Individual Income Tax Returns)
Here:
$247,276
State:
$86,446
Salary/wage: $147,019 (reported on 72.2% of returns)
Here:
$147,019
State:
$71,185
(% of AGI for various income ranges: 1242.7% for AGIs below $25k, 3635.7% for AGIs $25k-50k, 7308.8% for AGIs $50k-75k, 9210.0% for AGIs $75k-100k, 18414.4% for AGIs $100k-200k, 161392.0% for AGIs over 200k)
Taxable interest for individuals: $10,144 (reported on 41.7% of returns)
This zip code:
$10,144
Virginia:
$1,805
(% of AGI for various income ranges: 17.3% for AGIs below $25k, 34.3% for AGIs $25k-50k, 62.5% for AGIs $50k-75k, 78.0% for AGIs $75k-100k, 353.3% for AGIs $100k-200k, 8168.0% for AGIs over 200k)
Ordinary dividends: $64,874 (reported on 36.1% of returns)
Here:
$64,874
State:
$8,327
(% of AGI for various income ranges: 84.0% for AGIs below $25k, 317.9% for AGIs $25k-50k, 321.2% for AGIs $50k-75k, 146.0% for AGIs $75k-100k, 1526.7% for AGIs $100k-200k, 46052.0% for AGIs over 200k)
Net capital gain/loss in AGI: +$239,114 (reported on 33.3% of returns)
Here:
+$239,114
State:
+$24,644
(% of AGI for various income ranges: 58.0% for AGIs below $25k, 167.9% for AGIs $25k-50k, 160.0% for AGIs $50k-75k, 120.0% for AGIs $75k-100k, 1400.0% for AGIs $100k-200k, 168622.0% for AGIs over 200k)
Profit/loss from business: +$23,441 (reported on 29.6% of returns)
Here:
+$23,441
State:
+$12,836
(% of AGI for various income ranges: 323.3% for AGIs below $25k, 374.3% for AGIs $25k-50k, 711.2% for AGIs $50k-75k, 2155.6% for AGIs $100k-200k, 7966.0% for AGIs over 200k)
Taxable individual retirement arrangement distribution: $20,090 (reported on 9.3% of returns)
20198:
$20,090
Virginia:
$21,535
(% of AGI for various income ranges: 292.9% for AGIs $25k-50k, 1216.0% for AGIs $75k-100k, 1982.0% for AGIs over 200k)
Self-employed (Keogh) retirement plans: $53,300 (reported on 2.8% of returns)
20198:
$53,300
Virginia:
$31,172
(% of AGI for various income ranges: 3198.0% for AGIs over 200k)
Total itemized deductions: $63,427 (reported on 24.1% of returns)
Here:
$63,427
State:
$33,287
(% of AGI for various income ranges: 716.4% for AGIs $25k-50k, 1033.8% for AGIs $50k-75k, 2330.0% for AGIs $100k-200k, 25128.0% for AGIs over 200k)
Charity contributions: $30,850 (reported on 18.5% of returns)
Here:
$30,850
State:
$10,381
(% of AGI for various income ranges: 107.5% for AGIs $50k-75k, 520.0% for AGIs $100k-200k, 11232.0% for AGIs over 200k)
Taxes paid: $8,700 (reported on 24.1% of returns)
20198:
$8,700
State:
$8,284
(% of AGI for various income ranges: 112.1% for AGIs $25k-50k, 298.8% for AGIs $50k-75k, 685.6% for AGIs $100k-200k, 2498.0% for AGIs over 200k)
Earned income credit: $1,689 (reported on 8.3% of returns)
Here:
$1,689
State:
$2,214
(% of AGI for various income ranges: 53.3% for AGIs below $25k, 51.4% for AGIs $25k-50k)
Percentage of individuals using paid preparers for their 2020 taxes: 89.8%
Here:
90%
State:
92%
(% for various income ranges: 88.9% for AGIs below $25k, 90.5% for AGIs $25k-50k, 92.3% for AGIs $50k-75k, 87.5% for AGIs $75k-100k, 89.5% for AGIs $100k-200k, 90.0% for AGIs over 200k)
Averages for the 2012 tax year for zip code 20198, filed in 2013:
Average Adjusted Gross Income (AGI) in 2012: $142,576 (Individual Income Tax Returns)
Here:
$142,576
State:
$71,192
Salary/wage: $71,275 (reported on 76.0% of returns)
Here:
$71,275
State:
$59,229
(% of AGI for various income ranges: 73.9% for AGIs below $25k, 76.1% for AGIs $25k-50k, 74.4% for AGIs $50k-75k, 68.4% for AGIs $75k-100k, 67.1% for AGIs $100k-200k, 20.7% for AGIs over 200k)
Taxable interest for individuals: $7,269 (reported on 42.0% of returns)
This zip code:
$7,269
Virginia:
$1,600
(% of AGI for various income ranges: 3.1% for AGIs below $25k, 0.5% for AGIs $25k-50k, 0.7% for AGIs $50k-75k, 1.2% for AGIs $75k-100k, 1.4% for AGIs $100k-200k, 2.6% for AGIs over 200k)
Ordinary dividends: $66,618 (reported on 33.0% of returns)
Here:
$66,618
State:
$6,959
(% of AGI for various income ranges: 6.8% for AGIs below $25k, 2.4% for AGIs $25k-50k, 5.5% for AGIs $50k-75k, 3.4% for AGIs $75k-100k, 4.1% for AGIs $100k-200k, 21.4% for AGIs over 200k)
Net capital gain/loss in AGI: +$92,884 (reported on 25.0% of returns)
Here:
+$92,884
State:
+$16,672
(% of AGI for various income ranges: 25.2% for AGIs below $25k, 1.5% for AGIs $25k-50k, 0.7% for AGIs $50k-75k, 3.0% for AGIs $75k-100k, 3.4% for AGIs $100k-200k, 23.7% for AGIs over 200k)
Profit/loss from business: +$28,030 (reported on 23.0% of returns)
Here:
+$28,030
State:
+$14,116
(% of AGI for various income ranges: 10.0% for AGIs below $25k, 6.7% for AGIs $25k-50k, 10.3% for AGIs $50k-75k, 4.9% for AGIs $100k-200k, 3.9% for AGIs over 200k)
Taxable individual retirement arrangement distribution: $23,017 (reported on 12.0% of returns)
20198:
$23,017
Virginia:
$16,667
(% of AGI for various income ranges: 3.9% for AGIs below $25k, 3.5% for AGIs $50k-75k, 4.0% for AGIs $100k-200k, 1.5% for AGIs over 200k)
Self-employment retirement plans: $30,100 (reported on 2.0% of returns)
20198:
$30,100
Virginia:
$25,373
(% of AGI for various income ranges: 8.0% for AGIs $50k-75k)
Total itemized deductions: $67,849 (24% of AGI, reported on 43.0% of returns)
Here:
$67,849
State:
$26,596
Here:
23.8% of AGI
State:
20.1% of AGI
(% of AGI for various income ranges: 19.9% for AGIs below $25k, 9.1% for AGIs $25k-50k, 16.0% for AGIs $50k-75k, 15.6% for AGIs $75k-100k, 18.4% for AGIs $100k-200k, 22.6% for AGIs over 200k)
Charity contributions: $14,118 (reported on 33.0% of returns)
Here:
$14,118
State:
$4,443
(% of AGI for various income ranges: 0.6% for AGIs below $25k, 0.7% for AGIs $25k-50k, 1.0% for AGIs $50k-75k, 2.5% for AGIs $75k-100k, 1.9% for AGIs $100k-200k, 4.2% for AGIs over 200k)
Taxes paid: $18,821 (reported on 42.0% of returns)
20198:
$18,821
State:
$9,951
(% of AGI for various income ranges: 4.8% for AGIs below $25k, 2.4% for AGIs $25k-50k, 4.5% for AGIs $50k-75k, 5.7% for AGIs $75k-100k, 7.5% for AGIs $100k-200k, 5.4% for AGIs over 200k)
Earned income credit: $2,190 (reported on 10.0% of returns)
Here:
$2,190
State:
$2,211
(% of AGI for various income ranges: 4.1% for AGIs below $25k, 0.8% for AGIs $25k-50k)
Percentage of individuals using paid preparers for their 2012 taxes: 59.0%
Here:
59%
State:
46%
(% for various income ranges: 54.8% for AGIs below $25k, 55.0% for AGIs $25k-50k, 61.5% for AGIs $50k-75k, 55.6% for AGIs $75k-100k, 58.8% for AGIs $100k-200k, 80.0% for AGIs over 200k)
Averages for the 2004 tax year for zip code 20198, filed in 2005:
Average Adjusted Gross Income (AGI) in 2004: $224,858 (Individual Income Tax Returns)
Here:
$224,858
State:
$56,704
Salary/wage: $90,850 (reported on 78.0% of returns)
Here:
$90,850
State:
$48,441
(% of AGI for various income ranges: 227.2% for AGIs below $10k, 77.3% for AGIs $10k-25k, 77.9% for AGIs $25k-50k, 77.3% for AGIs $50k-75k, 72.3% for AGIs $75k-100k, 24.8% for AGIs over 100k)
Taxable interest for individuals: $8,796 (reported on 52.1% of returns)
This zip code:
$8,796
Virginia:
$1,688
(% of AGI for various income ranges: 14.4% for AGIs below $10k, 1.2% for AGIs $10k-25k, 2.0% for AGIs $25k-50k, 1.2% for AGIs $50k-75k, 3.1% for AGIs $75k-100k, 2.0% for AGIs over 100k)
Taxable dividends: $40,552 (reported on 36.1% of returns)
Here:
$40,552
State:
$4,028
(% of AGI for various income ranges: 44.0% for AGIs below $10k, 5.5% for AGIs $10k-25k, 1.7% for AGIs $25k-50k, 3.0% for AGIs $50k-75k, 2.3% for AGIs $75k-100k, 7.0% for AGIs over 100k)
Net capital gain/loss: +$126,456 (reported on 29.7% of returns)
Here:
+$126,456
State:
+$14,375
(% of AGI for various income ranges: -14.8% for AGIs below $10k, -1.2% for AGIs $10k-25k, 1.2% for AGIs $25k-50k, 2.0% for AGIs $50k-75k, 4.5% for AGIs $75k-100k, 18.9% for AGIs over 100k)
Profit/loss from business: +$593 (reported on 21.5% of returns)
Here:
+$593
State:
+$13,342
(% of AGI for various income ranges: 7.6% for AGIs below $10k, 10.0% for AGIs $10k-25k, 5.7% for AGIs $25k-50k, 7.5% for AGIs $50k-75k, 7.7% for AGIs $75k-100k, -1.0% for AGIs over 100k)
IRA payment deduction: $2,968 (reported on 3.5% of returns)
20198:
$2,968
Virginia:
$2,943
Self-employed pension: $17,400 (reported on 2.3% of returns)
Here:
$17,400
Virginia:
$17,430
Total itemized deductions: $59,768 (16% of AGI, reported on 39.3% of returns)
Here:
$59,768
State:
$21,492
Here:
16.3% of AGI
State:
21.0% of AGI
(% of AGI for various income ranges: 67.2% for AGIs below $10k, 11.1% for AGIs $10k-25k, 7.6% for AGIs $25k-50k, 12.3% for AGIs $50k-75k, 16.0% for AGIs $75k-100k, 10.2% for AGIs over 100k)
Charity contributions deductions: $22,360 (5% of AGI, reported on 34.5% of returns)
Here:
$22,360
State:
$3,794
Here:
5.5% of AGI
State:
3.5% of AGI
(% of AGI for various income ranges: 5.2% for AGIs below $10k, 0.8% for AGIs $10k-25k, 0.8% for AGIs $25k-50k, 2.2% for AGIs $50k-75k, 2.1% for AGIs $75k-100k, 3.7% for AGIs over 100k)
Total tax: $48,416 (reported on 83.0% of returns)
20198:
$48,416
State:
$9,537
(% of AGI for various income ranges: 6.8% for AGIs below $10k, 5.3% for AGIs $10k-25k, 8.6% for AGIs $25k-50k, 10.2% for AGIs $50k-75k, 11.6% for AGIs $75k-100k, 19.1% for AGIs over 100k)
Earned income credit: $1,606 (reported on 7.5% of returns)
Here:
$1,606
State:
$1,734
Percentage of individuals using paid preparers for their 2004 taxes: 61.8%
Here:
62%
State:
52%
(% for various income ranges: 59.6% for AGIs below $10k, 65.3% for AGIs $10k-25k, 55.3% for AGIs $25k-50k, 56.5% for AGIs $50k-75k, 59.0% for AGIs $75k-100k, 73.7% for AGIs over 100k)
Household received Food Stamps/SNAP in the past 12 months: 65 Household did not receive Food Stamps/SNAP in the past 12 months: 798
Women who had a birth in the past 12 months: 22 (22 now married, 0 unmarried) Women who did not have a birth in the past 12 months: 519 (243 now married, 275 unmarried)
Housing units in zip code 20198 with a mortgage: 333 (39 second mortgage, 28 both second mortgage and home equity loan) Median monthly owner costs for units with a mortgage: $2,795 Median monthly owner costs for units without a mortgage: $1,392
Residents with income below the poverty level in 2022:
This zip code:
11.0%
Whole state:
10.6%
Residents with income below 50% of the poverty level in 2022:
This zip code:
8.1%
Whole state:
5.2%
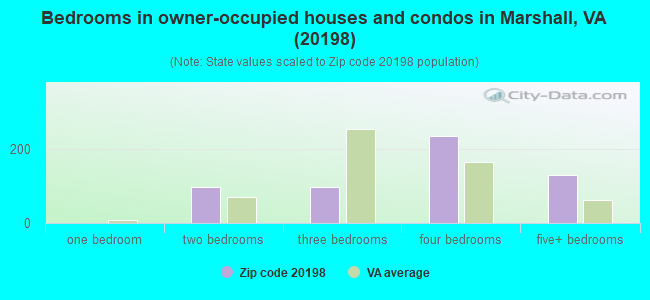
Median number of rooms in houses and condos:
Here:
8.1
State:
7.0
Median number of rooms in apartments:
Here:
4.9
State:
4.3
Notable locations in this zip code not listed on our city pages
Notable locations in zip code 20198: Walkers Corner (A), Picketts Corner (B), Avenel (C), Western View (D), The Plains Volunteer Fire and Rescue Company 4 (E). Display/hide their locations on the map
Churches in zip code 20198 include: Belvoir Assembly of God Church (A), Church of Our Savoir (B), First Baptist Church (C), Grace Episcopal Church (D), Saint Marks United Methodist Church (E), The Plains Baptist Church (F), Little Zion Church (G), Long Branch Church (H). Display/hide their locations on the map
Reservoirs: Ardarra Farm Lake (A), Sherwood Lake (B), Hickory Tree Farm Lake (C), Willow Lake (D), Belvoir Farm Lake (E), Fox Pond (F), Kinloch Farm Pond (G). Display/hide their locations on the map
Size of family households: 225 2-persons, 136 3-persons, 129 4-persons, 17 5-persons, 80 6-persons
Size of nonfamily households: 226 1-person, 57 2-persons
391 married couples with children.
121 single-parent households (57 men, 64 women).
87.8% of residents of 20198 zip code speak English at home.
10.7% of residents speak Spanish at home (85% very well, 12% well, 3% not well).
0.1% of residents speak other Indo-European language at home (100% very well).
0.1% of residents speak Asian or Pacific Island language at home (100% very well).
1.8% of residents speak other language at home (100% very well).
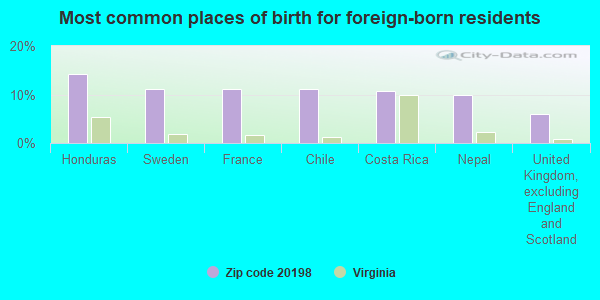
Foreign born population: 225 (10.3%) (31.1% of them are naturalized citizens)
This zip code:
10.3%
Whole state:
12.7%
14%Honduras
11%Sweden
11%France
11%Chile
11%Costa Rica
10%Nepal
6%United Kingdom, excluding England and Scotland
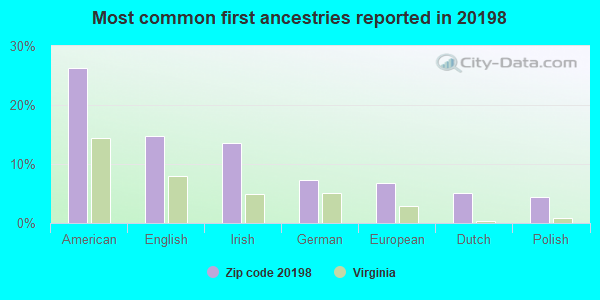
26%American
15%English
14%Irish
7%German
7%European
5%Dutch
4%Polish
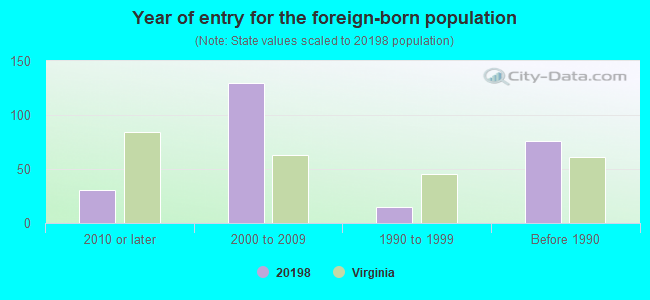
Year of entry for the foreign-born population
312010 or later
1302000 to 2009
151990 to 1999
76Before 1990
Facilities with environmental interests located in this zip code:
CHARLES G TURNER OIL COMPANY (6315 HOPEWELL ROAD in THE PLAINS, VA)
AIR MINOR (AIRS/AFS) STATE MASTER (Virginia pollutants databases) - CEDS-40490, AIR PROGRAM Business SIC and NAICS classification: PETROLEUM BULK STATIONS AND TERMINALS
CHESAPEAKE & POTOMAC TELEPHONE CO (STATE HWY 245 in THE PLAINS, VA)
(Resource Conservation and Recovery Act (tracking hazardous waste)) Organizations: OPERNAME (CONTACT/OPERATOR)
, CHESAPEAKE & POTOMAC TELEPHONE COMPANY (CONTACT/OWNER)
Housing units lacking complete plumbing facilities: 4.6% Housing units lacking complete kitchen facilities: 10.5%
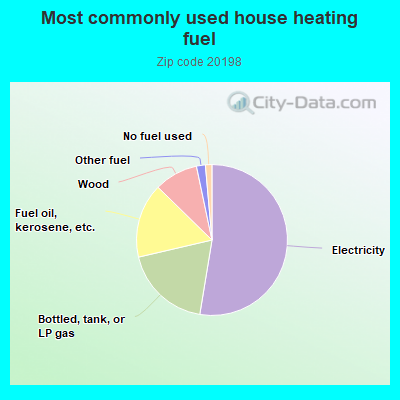
52.7%Electricity
18.8%Bottled, tank, or LP gas
16.0%Fuel oil, kerosene, etc.
9.4%Wood
1.9%Other fuel
1.4%No fuel used
Place of birth for U.S.-born residents:
This state: 877
Northeast: 370
Midwest: 125
South: 482
West: 70
58% of the 20198 zip code residents lived in the same house 5 years ago. Out of people who lived in different houses, 34% lived in this county. Out of people who lived in different counties, 50% lived in Virginia.
93% of the 20198 zip code residents lived in the same house 1 year ago. Out of people who lived in different houses, 25% moved from this county. Out of people who lived in different houses, 78% moved from different county within same state.
Private vs. public school enrollment:
Students in private schools in grades 1 to 8 (elementary and middle school): 108
Here:
36.5%
Virginia:
13.2%
Students in private schools in grades 9 to 12 (high school): 9
Here:
6.2%
Virginia:
10.2%
Students in private undergraduate colleges: 10
Here:
13.2%
Virginia:
18.7%
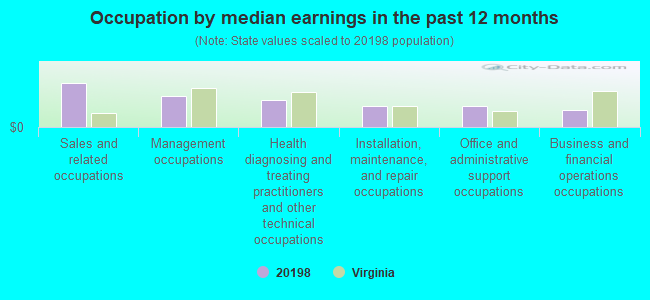
Occupation by median earnings in the past 12 months ($)
132,469Sales and related occupations
94,250Management occupations
81,122Health diagnosing and treating practitioners and other technical occupations
64,037Installation, maintenance, and repair occupations
62,961Office and administrative support occupations
51,322Business and financial operations occupations
Companies with federal contracts located in this zip code:
TKC INTERNATIONAL LLC (3819 LANDMARK RD in THE PLAINS, VA; small business) : $1,734,729 in 15 contractsfrom 1999 to 2006
Contracts for Other Defense -- Engineering Development (R&D), Personal Care Services (includes such services as barber and beauty shop, shoe repairs, tailoring, etc.), Defense Ships -- Basic Research (R&D), Engineering and Technical Services, and moreby Navy, Animal and Plant Health Inspection Service Signed by year:2000: $157,100; 2001: $0; 2002: $439,000; 2003: $49,950; 2004: $104,279; 2005: $584,900; 2006: $300,000.
Biggest contracts:
$484,900 with Navy for Other Defense -- Engineering Development (R&D). Signed on 2005-05-05. Completion date: 2007-04-22.
$409,000 with Navy for Personal Care Services (includes such services as barber and beauty shop, shoe repairs, tailoring, etc.). Signed on 2002-09-25. Completion date: 2004-09-30.
$200,000 with Navy for Defense Ships -- Basic Research (R&D). Signed on 2006-03-20. Completion date: 2008-03-20.
$100,000, same as above.Signed on 2006-07-12. Completion date: 2008-07-12.
MARIETEL, INC (4119 BULL RUN MOUNTAIN RD in THE PLAINS, VA; small business) : $199,998 in 2 contractsin 2005
$99,999 with Navy for Maintenance, Repair and Rebuilding of Equipment -- Communication, Detection, and Coherent Radiation Equipment. Signed on 2005-09-28. Completion date: 2006-02-28.
$99,999 with Navy for Miscellaneous Items. Signed on 2005-08-26. Completion date: 2006-02-28.
Top industries in this zip code by the number of employees in 2005:
Educational Services: Elementary and Secondary Schools (100-249 employees: 1 establishment)
Accommodation and Food Services: Full-Service Restaurants (20-49: 1, 10-19: 2)
Other Services (except Public Administration): Religious Organizations (20-49: 1, 1-4: 2)
Professional, Scientific, and Technical Services: Payroll Services (20-49: 1)
Arts, Entertainment, and Recreation: All Other Amusement and Recreation Industries (20-49: 1)
Other Services (except Public Administration): Environment, Conservation and Wildlife Organizations (10-19: 1, 5-9: 1, 1-4: 1)
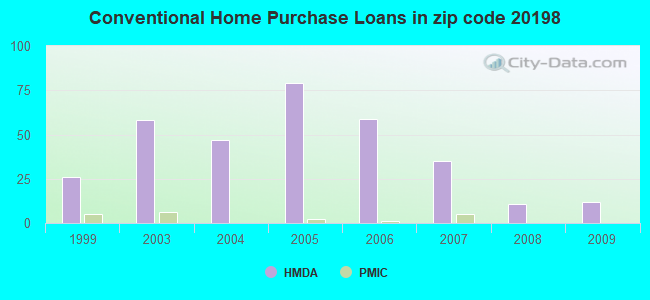
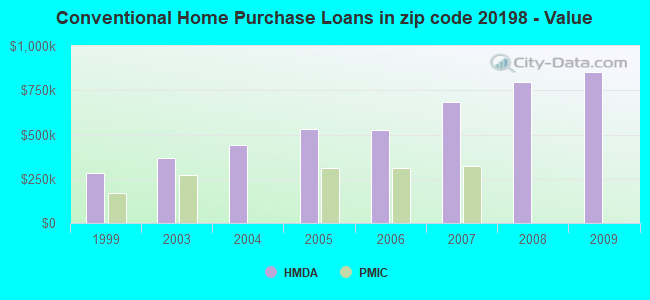
Detailed PMIC statistics for the following Tracts:9901.00
2002 - 2018 National Fire Incident Reporting System (NFIRS) incidents
According to the data from the years 2002 - 2018 the average number of fires per year is 19. The highest number of fire incidents - 46 took place in 2015, and the least - 3 in 2004. The data has an increasing trend.
When looking into fire subcategories, the most incidents belonged to: Outside Fires (35.3%), and Structure Fires (34.7%).
Fire incident types reported to NFIRS in Zip Code 20198


 Nearest zip codes: 20137, 20118, 20169, 20117, 20155, 20105.


 According to the data from the years 2002 - 2018 the average number of fires per year is 19. The highest number of fire incidents - 46 took place in 2015, and the least - 3 in 2004. The data has an increasing trend.
 When looking into fire subcategories, the most incidents belonged to: Outside Fires (35.3%), and Structure Fires (34.7%).