Estimated zip code population in 2022: 1,240 Zip code population in 2010: 1,120 Zip code population in 2000: 1,098
Houses and condos: 528 Renter-occupied apartments: 36
% of renters here:
8%
State:
32%
March 2022 cost of living index in zip code 20609: 90.2 (less than average, U.S. average is 100)
Land area: 9.9 sq. mi. Water area: 2.5 sq. mi.
Population density: 125 people per square mile
(very low).
OSM Map
General Map
Google Map
MSN Map
OSM Map
General Map
Google Map
MSN Map
OSM Map
General Map
Google Map
MSN Map
OSM Map
General Map
Google Map
MSN Map
Please wait while loading the map...
Real estate property taxes paid for housing units in 2022:
This zip code:
0.7% ($3,271)
Maryland:
0.9% ($3,777)
Median real estate property taxes paid for housing units with mortgages in 2022: $3,342 Median real estate property taxes paid for housing units with no mortgage in 2022: $2,991
Business Search- 14 Million verified businesses
Males: 668
(53.9%)
Females: 572
(46.1%)
For population 25 years and over in 20609:
High school or higher: 86.0%
Bachelor's degree or higher: 16.2%
Graduate or professional degree: 8.2%
Unemployed: 4.3%
Mean travel time to work (commute): 50.7 minutes
For population 15 years and over in 20609:
Never married: 27.5%
Now married: 47.5%
Separated: 0.0%
Widowed: 10.9%
Divorced: 14.1%
Zip code 20609 compared to state average:
Hispanic race population percentage significantly below state average.
Median age significantly above state average.
Foreign-born population percentage significantly below state average.
Renting percentage significantly below state average.
Length of stay since moving in significantly above state average.
Percentage of population with a bachelor's degree or higher significantly below state average.
Estimated median house/condo value in 2022: $443,403
20609:
$443,403
Maryland:
$398,100
According to our research of Maryland and other state lists, there was 1 registered sex offender living in 20609 zip code as of May 28, 2024. The ratio of all residents to sex offenders in zip code 20609 is 1,088 to 1. The ratio of registered sex offenders to all residents in this zip code is lower than the state average.
Median resident age:
This zip code:
54.9 years
Maryland median age:
39.7 years
Average household size:
This zip code:
2.7 people
Maryland:
2.5 people
Averages for the 2020 tax year for zip code 20609, filed in 2021:
Average Adjusted Gross Income (AGI) in 2020: $79,643 (Individual Income Tax Returns)
Here:
$79,643
State:
$86,905
Salary/wage: $72,689 (reported on 75.0% of returns)
Here:
$72,689
State:
$73,953
(% of AGI for various income ranges: 1080.0% for AGIs below $25k, 3181.8% for AGIs $25k-50k, 6027.1% for AGIs $50k-75k, 8445.0% for AGIs $75k-100k, 14033.3% for AGIs $100k-200k)
Taxable interest for individuals: $1,184 (reported on 41.7% of returns)
This zip code:
$1,184
Maryland:
$1,528
(% of AGI for various income ranges: 16.7% for AGIs below $25k, 4.5% for AGIs $25k-50k, 61.4% for AGIs $50k-75k, 147.5% for AGIs $75k-100k, 80.0% for AGIs $100k-200k)
Ordinary dividends: $4,980 (reported on 16.7% of returns)
Here:
$4,980
State:
$8,028
(% of AGI for various income ranges: 200.0% for AGIs $50k-75k, 397.8% for AGIs $100k-200k)
Net capital gain/loss in AGI: +$5,800 (reported on 11.7% of returns)
Here:
+$5,800
State:
+$25,238
(% of AGI for various income ranges: 94.3% for AGIs $50k-75k, 377.8% for AGIs $100k-200k)
Profit/loss from business: +$1,010 (reported on 16.7% of returns)
Here:
+$1,010
State:
+$11,398
(% of AGI for various income ranges: 113.3% for AGIs below $25k, 64.4% for AGIs $100k-200k)
Taxable individual retirement arrangement distribution: $14,233 (reported on 10.0% of returns)
20609:
$14,233
Maryland:
$20,944
(% of AGI for various income ranges: 317.3% for AGIs $25k-50k, 1262.5% for AGIs $75k-100k)
Total itemized deductions: $30,267 (reported on 20.0% of returns)
Here:
$30,267
State:
$30,672
(% of AGI for various income ranges: 1290.0% for AGIs $50k-75k, 1527.5% for AGIs $75k-100k, 1336.7% for AGIs $100k-200k)
Charity contributions: $4,200 (reported on 16.7% of returns)
Here:
$4,200
State:
$9,065
(% of AGI for various income ranges: 135.7% for AGIs $50k-75k, 224.4% for AGIs $100k-200k)
Taxes paid: $8,967 (reported on 20.0% of returns)
20609:
$8,967
State:
$8,475
(% of AGI for various income ranges: 365.7% for AGIs $50k-75k, 437.5% for AGIs $75k-100k, 455.6% for AGIs $100k-200k)
Earned income credit: $1,967 (reported on 10.0% of returns)
Here:
$1,967
State:
$2,151
(% of AGI for various income ranges: 55.6% for AGIs below $25k, 61.8% for AGIs $25k-50k)
Percentage of individuals using paid preparers for their 2020 taxes: 86.7%
Here:
87%
State:
90%
(% for various income ranges: 84.6% for AGIs below $25k, 92.9% for AGIs $25k-50k, 90.0% for AGIs $50k-75k, 71.4% for AGIs $75k-100k, 84.6% for AGIs $100k-200k, 100.0% for AGIs over 200k)
Averages for the 2012 tax year for zip code 20609, filed in 2013:
Average Adjusted Gross Income (AGI) in 2012: $65,081 (Individual Income Tax Returns)
Here:
$65,081
State:
$72,703
Salary/wage: $60,363 (reported on 77.4% of returns)
Here:
$60,363
State:
$62,228
(% of AGI for various income ranges: 62.8% for AGIs below $25k, 72.4% for AGIs $25k-50k, 70.5% for AGIs $50k-75k, 68.4% for AGIs $75k-100k, 73.6% for AGIs $100k-200k)
Taxable interest for individuals: $1,088 (reported on 47.2% of returns)
This zip code:
$1,088
Maryland:
$1,413
(% of AGI for various income ranges: 1.5% for AGIs below $25k, 1.0% for AGIs $25k-50k, 1.4% for AGIs $50k-75k, 0.6% for AGIs $75k-100k, 0.5% for AGIs $100k-200k)
Ordinary dividends: $2,511 (reported on 17.0% of returns)
Here:
$2,511
State:
$6,933
Net capital gain/loss in AGI: +$557 (reported on 13.2% of returns)
Here:
+$557
State:
+$14,830
Profit/loss from business: +$4,850 (reported on 15.1% of returns)
Here:
+$4,850
State:
+$12,606
(% of AGI for various income ranges: 10.4% for AGIs below $25k, 1.8% for AGIs $50k-75k, 0.6% for AGIs $100k-200k)
Taxable individual retirement arrangement distribution: $10,183 (reported on 11.3% of returns)
20609:
$10,183
Maryland:
$17,065
Total itemized deductions: $25,800 (25% of AGI, reported on 47.2% of returns)
Here:
$25,800
State:
$27,886
Here:
24.9% of AGI
State:
22.8% of AGI
(% of AGI for various income ranges: 17.3% for AGIs below $25k, 14.8% for AGIs $25k-50k, 15.5% for AGIs $50k-75k, 21.4% for AGIs $75k-100k, 20.1% for AGIs $100k-200k)
Charity contributions: $2,780 (reported on 37.7% of returns)
Here:
$2,780
State:
$4,452
(% of AGI for various income ranges: 1.3% for AGIs $25k-50k, 1.0% for AGIs $50k-75k, 2.0% for AGIs $75k-100k, 1.9% for AGIs $100k-200k)
Taxes paid: $10,344 (reported on 47.2% of returns)
20609:
$10,344
State:
$11,690
(% of AGI for various income ranges: 3.5% for AGIs below $25k, 3.7% for AGIs $25k-50k, 5.7% for AGIs $50k-75k, 8.8% for AGIs $75k-100k, 9.0% for AGIs $100k-200k)
Earned income credit: $1,967 (reported on 11.3% of returns)
Here:
$1,967
State:
$2,199
(% of AGI for various income ranges: 6.5% for AGIs below $25k)
Percentage of individuals using paid preparers for their 2012 taxes: 52.8%
Here:
53%
State:
52%
(% for various income ranges: 46.7% for AGIs below $25k, 53.8% for AGIs $25k-50k, 50.0% for AGIs $50k-75k, 60.0% for AGIs $75k-100k, 58.3% for AGIs $100k-200k)
Averages for the 2004 tax year for zip code 20609, filed in 2005:
Average Adjusted Gross Income (AGI) in 2004: $50,896 (Individual Income Tax Returns)
Here:
$50,896
State:
$60,339
Salary/wage: $46,430 (reported on 81.1% of returns)
Here:
$46,430
State:
$52,211
(% of AGI for various income ranges: 214.0% for AGIs below $10k, 73.4% for AGIs $10k-25k, 79.7% for AGIs $25k-50k, 77.6% for AGIs $50k-75k, 79.3% for AGIs $75k-100k, 63.4% for AGIs over 100k)
Taxable interest for individuals: $1,245 (reported on 50.4% of returns)
This zip code:
$1,245
Maryland:
$1,701
(% of AGI for various income ranges: 2.5% for AGIs $10k-25k, 1.5% for AGIs $25k-50k, 0.7% for AGIs $50k-75k, 1.9% for AGIs $75k-100k, 0.5% for AGIs over 100k)
Taxable dividends: $1,944 (reported on 15.1% of returns)
Here:
$1,944
State:
$4,235
(% of AGI for various income ranges: 17.4% for AGIs below $10k, 0.6% for AGIs $25k-50k, 0.2% for AGIs $50k-75k, 0.5% for AGIs $75k-100k, 0.8% for AGIs over 100k)
Net capital gain/loss: +$11,347 (reported on 10.4% of returns)
Here:
+$11,347
State:
+$15,888
Profit/loss from business: +$8,400 (reported on 12.8% of returns)
Here:
+$8,400
State:
+$12,221
(% of AGI for various income ranges: -0.7% for AGIs $10k-25k, -0.8% for AGIs $25k-50k, 0.0% for AGIs $50k-75k, 10.9% for AGIs $75k-100k)
Profit/loss from farming: +$467 (reported on 3.2% of returns)
Here:
+$467
State:
-$4,771
Total itemized deductions: $20,750 (25% of AGI, reported on 42.6% of returns)
Here:
$20,750
State:
$22,960
Here:
25.3% of AGI
State:
23.3% of AGI
(% of AGI for various income ranges: 22.5% for AGIs $10k-25k, 12.9% for AGIs $25k-50k, 14.3% for AGIs $50k-75k, 20.3% for AGIs $75k-100k, 18.7% for AGIs over 100k)
Charity contributions deductions: $2,595 (3% of AGI, reported on 39.4% of returns)
Here:
$2,595
State:
$4,031
Here:
3.1% of AGI
State:
3.9% of AGI
(% of AGI for various income ranges: 2.2% for AGIs $10k-25k, 1.2% for AGIs $25k-50k, 1.0% for AGIs $50k-75k, 2.2% for AGIs $75k-100k, 2.9% for AGIs over 100k)
Total tax: $6,720 (reported on 82.8% of returns)
20609:
$6,720
State:
$10,167
(% of AGI for various income ranges: 4.1% for AGIs $10k-25k, 7.5% for AGIs $25k-50k, 9.8% for AGIs $50k-75k, 10.0% for AGIs $75k-100k, 16.2% for AGIs over 100k)
Earned income credit: $1,838 (reported on 7.9% of returns)
Here:
$1,838
State:
$1,700
Percentage of individuals using paid preparers for their 2004 taxes: 58.5%
Here:
59%
State:
55%
(% for various income ranges: 41.9% for AGIs below $10k, 58.8% for AGIs $10k-25k, 56.1% for AGIs $25k-50k, 63.6% for AGIs $50k-75k, 63.8% for AGIs $75k-100k, 66.7% for AGIs over 100k)
Household received Food Stamps/SNAP in the past 12 months: 20 Household did not receive Food Stamps/SNAP in the past 12 months: 436
Women who did not have a birth in the past 12 months: 224 (68 now married, 156 unmarried)
Housing units in zip code 20609 with a mortgage: 301 (32 second mortgage, 22 both second mortgage and home equity loan) Residents with income below the poverty level in 2022:
This zip code:
1.5%
Whole state:
9.6%
Residents with income below 50% of the poverty level in 2022:
This zip code:
0.5%
Whole state:
4.7%
Median number of rooms in houses and condos:
Here:
6.6
State:
7.3
Median number of rooms in apartments:
Here:
4.7
State:
4.2
Notable locations in this zip code not listed on our city pages
Notable locations in zip code 20609: Little Hackley (A), Penerine (B), Maiden Bower (C), Hatchs Thicket (D), Cobrums Wharf (E), Barton Hall (F), Seventh District Volunteer Fire Department Company 5 (G), Seventh District Volunteer Rescue Squad (H). Display/hide their locations on the map
Size of family households: 173 2-persons, 36 3-persons, 66 4-persons, 52 5-persons
Size of nonfamily households: 116 1-person, 15 2-persons
91 married couples with children.
54 single-parent households (54 men).
98.9% of residents of 20609 zip code speak English at home.
0.6% of residents speak other Indo-European language at home (100% very well).
Foreign born population: 7 (0.6%) (100.0% of them are naturalized citizens)
This zip code:
0.6%
Whole state:
16.7%
100%France
19%Irish
16%English
11%American
3%German
2%Icelander
2%Italian
2%Polish
Year of entry for the foreign-born population
02010 or later
02000 to 2009
01990 to 1999
33Before 1990
Facilities with environmental interests located in this zip code:
FRESH FROM THE SEA (20840 OLEN MATTINGLY ROAD in AVENUE, MD)
STATE MASTER (Maryland Permits tracking) - National Pollutant Discharge Elimination System Permit National Pollutant Discharge Elimination System NON-MAJOR (Tracking pollutant discharge elimination systems) - permit Business SIC classification: PREPARED FRESH OR FROZEN FISH AND SEAFOODS Alternative names: JOHN TUCKER BROWN
41.2%Fuel oil, kerosene, etc.
35.4%Electricity
11.2%Bottled, tank, or LP gas
6.0%No fuel used
4.7%Wood
2.2%Utility gas
Population in 1990: 699. Population change in the 1990s: +399 (+57.1%).
Place of birth for U.S.-born residents:
This state: 912
Northeast: 85
South: 180
West: 16
80% of the 20609 zip code residents lived in the same house 5 years ago. Out of people who lived in different houses, 82% lived in this county. Out of people who lived in different counties, 50% lived in Maryland.
98% of the 20609 zip code residents lived in the same house 1 year ago. Out of people who lived in different houses, 140% moved from this county.
Private vs. public school enrollment:
Students in private schools in grades 1 to 8 (elementary and middle school):
Here:
0.0%
Maryland:
15.2%
Students in private schools in grades 9 to 12 (high school):
Here:
0.0%
Maryland:
14.4%
Students in private undergraduate colleges: 18
Here:
23.0%
Maryland:
20.2%
Occupation by median earnings in the past 12 months ($)
145,490Management occupations
86,207Construction and extraction occupations
81,873Business and financial operations occupations
43,503Health diagnosing and treating practitioners and other technical occupations
39,356Sales and related occupations
16,842Healthcare support occupations
Top industries in this zip code by the number of employees in 2005:
Other Services (except Public Administration): Religious Organizations (10-19 employees: 1 establishment, 5-9 employees: 1 establishment)
Administrative and Support and Waste Management and Remediation Services: Janitorial Services (10-19: 1)
Professional, Scientific, and Technical Services: Landscape Architectural Services (5-9: 1)
Arts, Entertainment, and Recreation: Amusement Arcades (5-9: 1)
Health Care and Social Assistance: Other Individual and Family Services (5-9: 1)
Construction: All Other Specialty Trade Contractors (1-4: 2)
Professional, Scientific, and Technical Services: Other Accounting Services (1-4: 1)
People in group quarters in 2010:
3 people in workers' group living quarters and job corps centers
Fatal accident statistics in 2014:
Fatal accident count: 1
Vehicles involved in fatal accidents: 1
Fatal accidents caused by drunken drivers: 1
Fatalities: 1
Persons involved in fatal accidents: 2
Pedestrians involved in fatal accidents: 0
Fatal accident statistics in 2013:
Fatal accident count: 1
Vehicles involved in fatal accidents: 1
Fatal accidents caused by drunken drivers: 0
Fatalities: 1
Persons involved in fatal accidents: 1
Pedestrians involved in fatal accidents: 0
2002 - 2018 National Fire Incident Reporting System (NFIRS) incidents
According to the data from the years 2002 - 2018 the average number of fires per year is 14. The highest number of reported fire incidents - 39 took place in 2004, and the least - 4 in 2012. The data has a decreasing trend.
When looking into fire subcategories, the most incidents belonged to: Structure Fires (53.6%), and Outside Fires (30.8%).
Fire incident types reported to NFIRS in Zip Code 20609


+$467
-$4,771
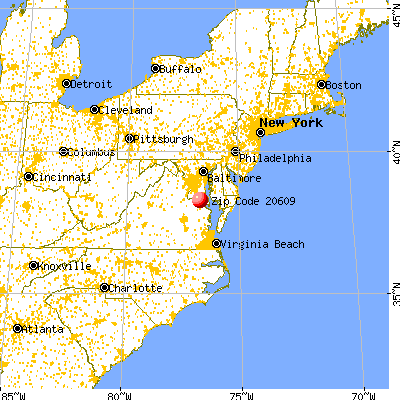
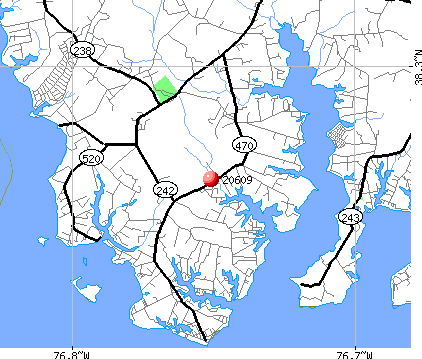 Nearest zip codes: 20618, 20606, 20626, 20621, 20624, 20625.


 According to the data from the years 2002 - 2018 the average number of fires per year is 14. The highest number of reported fire incidents - 39 took place in 2004, and the least - 4 in 2012. The data has a decreasing trend.
 When looking into fire subcategories, the most incidents belonged to: Structure Fires (53.6%), and Outside Fires (30.8%).