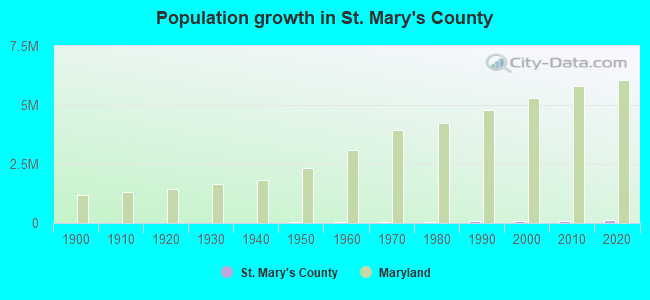
St. Mary's County, Maryland (MD)
County owner-occupied free and clear houses and condos in 2010: 5,547
County owner-occupied houses and condos in 2000: 22,001
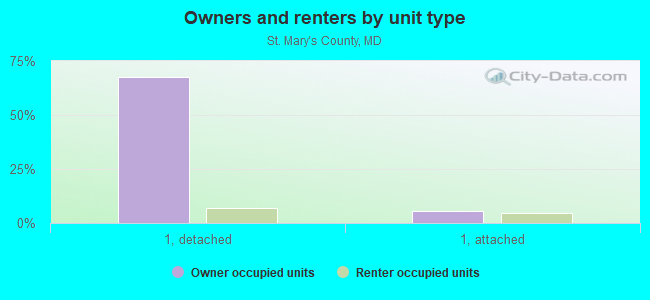
Renter-occupied apartments: 10,638 (it was 8,641 in 2000)
| % of renters here: | 28% |
| State: | 32% |
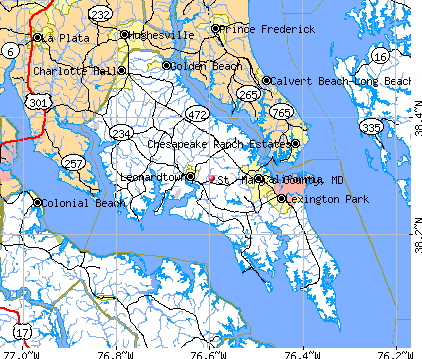
Land area: 361 sq. mi.
Water area: 403.3 sq. mi.
Population density: 318 people per square mile (high).
Industries providing employment: Public administration (19.8%), Professional, scientific, management, administrative, and waste management services (17.9%), Educational, health and social services (17.8%).
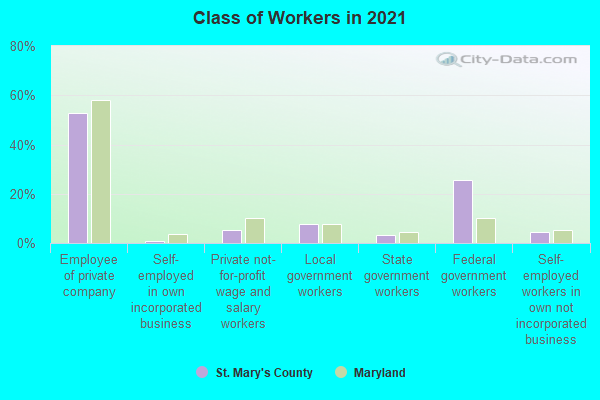
Type of workers:
- Private wage or salary: 59%
- Government: 36%
- Self-employed, not incorporated: 5%
- Unpaid family work: 0%
- OSM Map
- General Map
- Google Map
- MSN Map

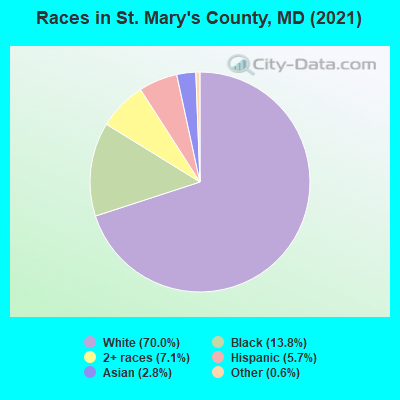
- 81,28070.8%White Non-Hispanic Alone
- 17,95215.6%Black Non-Hispanic Alone
- 6,8786.0%Hispanic or Latino
- 5,4524.7%Two or more races
- 2,9152.5%Asian alone
- 4000.3%Some other race alone
| Median resident age: | 37.3 years |
| Maryland median age: | 39.7 years |
| Males: 57,171 | |
| Females: 57,706 |

 | Racism is The Reason Rich Blacks in Prince George's County are locked out of wealth (218 replies) |
| St. Mary's County vs Calvert County (20 replies) |
| Coronavirus Count in Maryland (114 replies) |
| Maryland Among Worst States For Retirement (84 replies) |
| Best 55+ lifestyle living St. Mary vs St Michaels (2 replies) |
| St Marys of Maryland (39 replies) |
| St. Mary's County: | 2.0 people |
| Maryland: | 3 people |
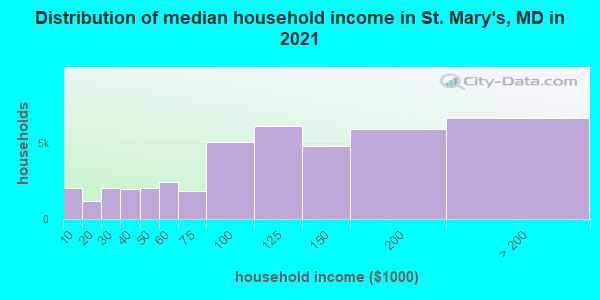
Estimated median household income in 2022: $113,717 ($54,706 in 1999)
| This county: | $113,717 |
| Maryland: | $94,991 |
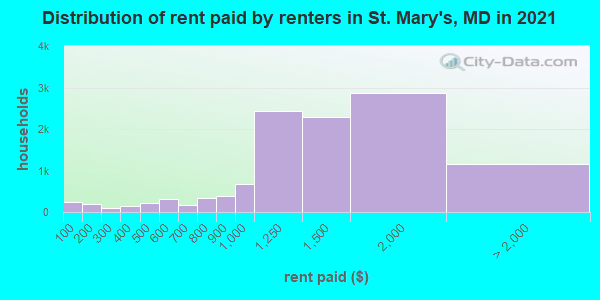
Median contract rent in 2022 for apartments: $1,385 (lower quartile is $1,067, upper quartile is $1,749)
| This county: | $1385 |
| State: | $1388 |
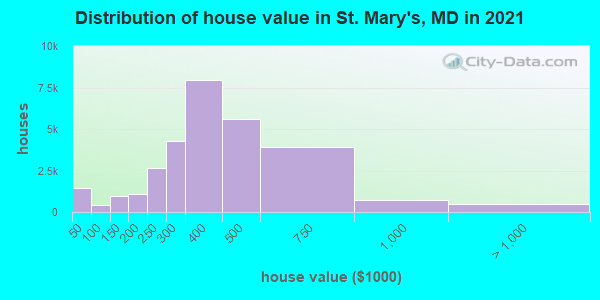
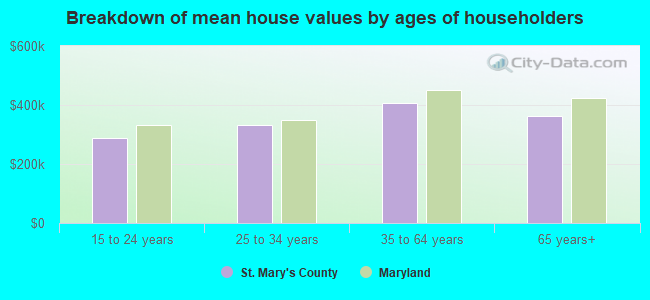
Estimated median house or condo value in 2022: $393,900 (it was $148,000 in 2000)
| St. Mary's: | $393,900 |
| Maryland: | $398,100 |
Mean price in 2022:
Median monthly housing costs for homes and condos with a mortgage: $2,056Detached houses: $434,448
Here: $434,448 State: $526,819 Townhouses or other attached units: $291,891
Here: $291,891 State: $328,305 In 2-unit structures: $256,566
Here: $256,566 State: $346,599 In 3-to-4-unit structures: $251,015
Here: $251,015 State: $295,378 In 5-or-more-unit structures: $338,851
Here: $338,851 State: $350,378 Mobile homes: $282,703
Here: $282,703 State: $89,353
Median monthly housing costs for units without a mortgage: $655
Institutionalized population: 923
Crime in 2021 (reported by the sheriff's office or county police, not the county total):
- Murders: 3
- Rapes: 27
- Robberies: 25
- Assaults: 230
- Burglaries: 202
- Thefts: 893
- Auto thefts: 67
Crime in 2020 (reported by the sheriff's office or county police, not the county total):
- Murders: 5
- Rapes: 15
- Robberies: 24
- Assaults: 99
- Burglaries: 166
- Thefts: 814
- Auto thefts: 64
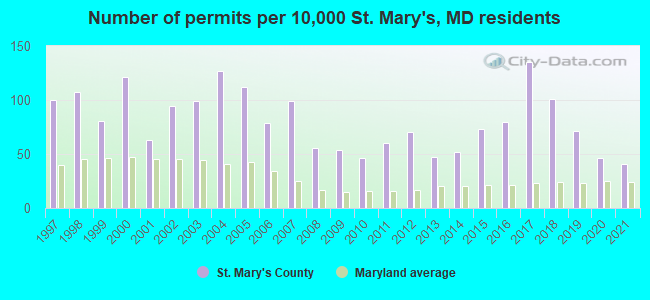
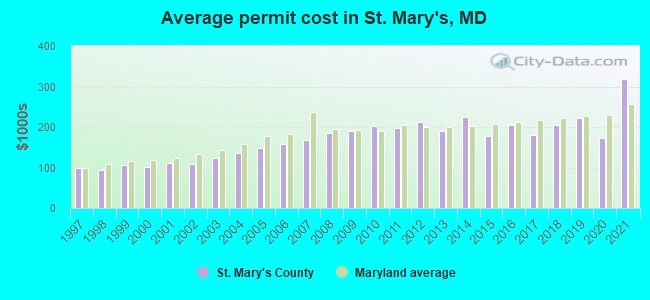
Single-family new house construction building permits:
- 2022: 238 buildings, average cost: $383,100
- 2021: 353 buildings, average cost: $317,500
- 2020: 399 buildings, average cost: $173,900
- 2019: 615 buildings, average cost: $220,500
- 2018: 871 buildings, average cost: $204,100
- 2017: 1164 buildings, average cost: $181,400
- 2016: 689 buildings, average cost: $205,600
- 2015: 626 buildings, average cost: $179,300
- 2014: 451 buildings, average cost: $224,800
- 2013: 403 buildings, average cost: $189,900
- 2012: 605 buildings, average cost: $213,300
- 2011: 516 buildings, average cost: $196,900
- 2010: 399 buildings, average cost: $201,800
- 2009: 465 buildings, average cost: $188,700
- 2008: 481 buildings, average cost: $185,300
- 2007: 854 buildings, average cost: $168,000
- 2006: 685 buildings, average cost: $158,200
- 2005: 963 buildings, average cost: $148,100
- 2004: 1096 buildings, average cost: $134,600
- 2003: 850 buildings, average cost: $123,800
- 2002: 814 buildings, average cost: $109,100
- 2001: 545 buildings, average cost: $110,100
- 2000: 1043 buildings, average cost: $100,500
- 1999: 701 buildings, average cost: $106,100
- 1998: 920 buildings, average cost: $95,100
- 1997: 866 buildings, average cost: $98,500
Median real estate property taxes paid for housing units with mortgages in 2022: $3,265 (0.8%)
Median real estate property taxes paid for housing units with no mortgage in 2022: $3,196 (0.8%)
| St. Mary's County: | 8.1% |
| Maryland: | 9.6% |
Median age of residents in 2022: 37.3 years old
(Males: 37.4 years old, Females: 37.1 years old)
(Median age for: White residents: 38.7 years old, Black residents: 34.9 years old, Asian residents: 40.4 years old, Hispanic or Latino residents: 29.9 years old, Other race residents: 35.5 years old)
Fair market rent in 2006 for a 1-bedroom apartment in St. Mary's County is $720 a month.
Fair market rent for a 2-bedroom apartment is $938 a month.
Fair market rent for a 3-bedroom apartment is $1233 a month.
Cities in this county include: Lexington Park, District 3, Leonardtown, California, Spring Ridge, District 7, Milestown, Golden Beach, Leonardtown, Mechanicsville, Charlotte Hall, Piney Point.
Neighboring counties: Cheyenne County, Colorado  , Piute County, Utah , Harrison County, Kentucky , San Miguel County, Colorado .
| Here: | 1.9% |
| Maryland: | 2.0% |
Current college students: 5,548
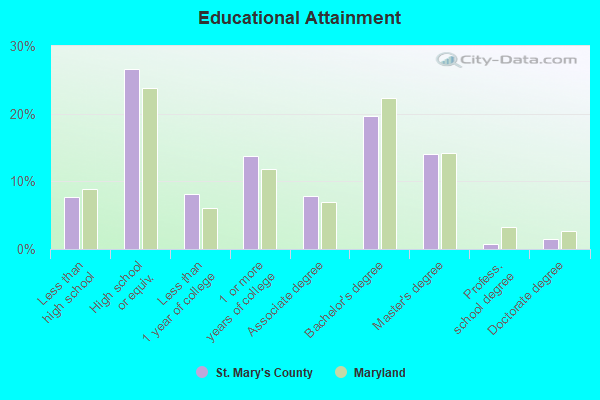
People 25 years of age or older with a high school degree or higher: 92.4%
People 25 years of age or older with a bachelor's degree or higher: 40.6%
Number of foreign born residents: 3,765 (64.3% naturalized citizens)
| St. Mary's County: | 3.3% |
| Whole state: | 16.7% |
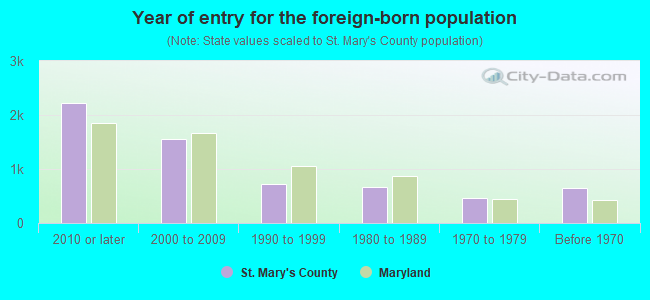
- Year of entry for the foreign-born population
- 2,2832010 or later
- 1,4062000 to 2009
- 6501990 to 1999
- 6681980 to 1989
- 4671970 to 1979
- 645Before 1970
Mean travel time to work (commute): minutes
Percentage of county residents living and working in this county: 96.3%
Housing units in structures:
- One, detached: 34,250
- One, attached: 4,069
- Two: 452
- 3 or 4: 279
- 5 to 9: 2,192
- 10 to 19: 2,089
- 20 to 49: 903
- 50 or more: 510
- Mobile homes: 1,652
- Boats, RVs, vans, etc.: 85
Housing units in St. Mary's County with a mortgage: 22,985 (2,511 second mortgage, 752 home equity loan, 1,323 both second mortgage and home equity loan)
Houses without a mortgage: 284
| Here: | 7.2% with mortgage |
| State: | 97.5% with mortgage |
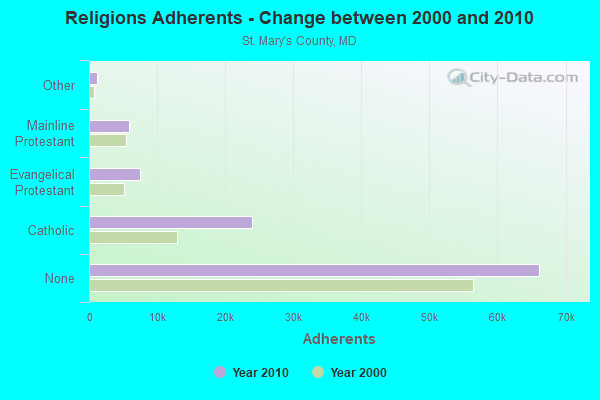
Religion statistics for St. Mary's County
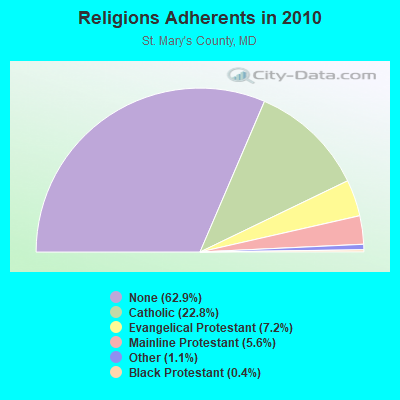
| Religion | Adherents | Congregations |
|---|---|---|
| Catholic | 24,014 | 15 |
| Evangelical Protestant | 7,519 | 35 |
| Mainline Protestant | 5,862 | 21 |
| Other | 1,206 | 7 |
| Black Protestant | 377 | 3 |
| None | 66,173 | - |
Source: Clifford Grammich, Kirk Hadaway, Richard Houseal, Dale E.Jones, Alexei Krindatch, Richie Stanley and Richard H.Taylor. 2012. 2010 U.S.Religion Census: Religious Congregations & Membership Study. Association of Statisticians of American Religious Bodies. Jones, Dale E., et al. 2002. Congregations and Membership in the United States 2000. Nashville, TN: Glenmary Research Center.
Food Environment Statistics:
| St. Mary's County: | 1.60 / 10,000 pop. |
| State: | 1.96 / 10,000 pop. |
| Here: | 0.10 / 10,000 pop. |
| Maryland: | 0.07 / 10,000 pop. |
| This county: | 1.00 / 10,000 pop. |
| Maryland: | 1.22 / 10,000 pop. |
| St. Mary's County: | 2.79 / 10,000 pop. |
| Maryland: | 2.05 / 10,000 pop. |
| This county: | 5.59 / 10,000 pop. |
| State: | 5.40 / 10,000 pop. |
| St. Mary's County: | 8.4% |
| Maryland: | 9.1% |
| St. Mary's County: | 28.9% |
| State: | 26.7% |
| Here: | 16.8% |
| State: | 15.5% |
Agriculture in St. Mary's County:
Average size of farms: 118 acresAverage value of agricultural products sold per farm: $21,137
Average value of crops sold per acre for harvested cropland: $263.34
The value of nursery, greenhouse, floriculture, and sod as a percentage of the total market value of agricultural products sold: 12.37%
The value of livestock, poultry, and their products as a percentage of the total market value of agricultural products sold: 26.30%
Average total farm production expenses per farm: $27,032
Harvested cropland as a percentage of land in farms: 50.08%
Irrigated harvested cropland as a percentage of land in farms: 2.20%
Average market value of all machinery and equipment per farm: $56,964
The percentage of farms operated by a family or individual: 92.03%
Average age of principal farm operators: 54 years
Average number of cattle and calves per 100 acres of all land in farms: 6.80
Milk cows as a percentage of all cattle and calves: 7.59%
Corn for grain: 9093 harvested acres
All wheat for grain: 5268 harvested acres
Soybeans for beans: 16438 harvested acres
Vegetables: 539 harvested acres
Land in orchards: 79 acres
Earthquake activity:
St. Mary's County-area historical earthquake activity is significantly above Maryland state average. It is 59% smaller than the overall U.S. average.On 8/23/2011 at 17:51:04, a magnitude 5.8 (5.8 MW, Depth: 3.7 mi, Class: Moderate, Intensity: VI - VII) earthquake occurred 77.6 miles away from St. Mary's County center
On 8/25/2011 at 05:07:52, a magnitude 4.5 (4.5 ML, Depth: 4.2 mi, Class: Light, Intensity: IV - V) earthquake occurred 78.3 miles away from the county center
On 12/9/2003 at 20:59:14, a magnitude 4.5 (4.5 MB, 4.5 LG) earthquake occurred 86.4 miles away from the county center
On 12/9/2003 at 20:59:18, a magnitude 4.5 (4.5 ML, Depth: 6.2 mi) earthquake occurred 89.4 miles away from the county center
On 1/16/1994 at 01:49:16, a magnitude 4.6 (4.6 MB, 4.6 LG, Depth: 3.1 mi) earthquake occurred 144.0 miles away from St. Mary's County center
On 8/24/2011 at 00:04:36, a magnitude 4.2 (4.2 ML) earthquake occurred 78.4 miles away from the county center
Magnitude types: regional Lg-wave magnitude (LG), body-wave magnitude (MB), local magnitude (ML), moment magnitude (MW)
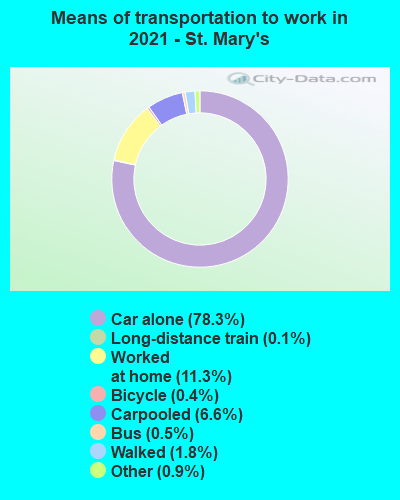
Means of transportation to work:
- Drove a car alone: 41,149 (72.6%)
- Carpooled: 2,852 (5.0%)
- Bus: 185 (0.3%)
- Subway or elevated rail: 31 (0.1%)
- Long-distance train or commuter rail: 42 (0.1%)
- Ferryboat: 15 (0.0%)
- Taxicab, motorcycle, or other means: 657 (1.2%)
- Bicycle: 145 (0.3%)
- Walked: 947 (1.7%)
- Worked at home: 10,550 (18.6%)
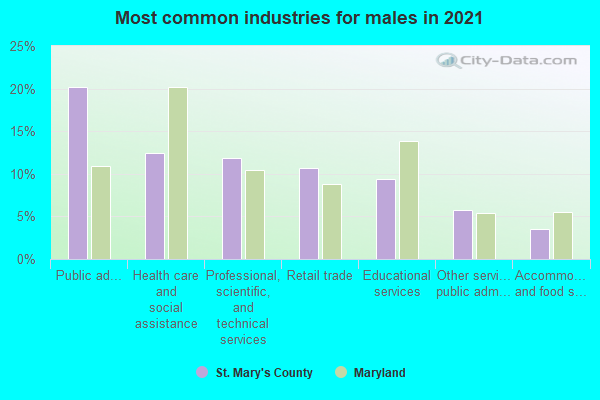
- Health care and social assistance (18%)
- Educational services (15%)
- Public administration (13%)
- Professional, scientific, and technical services (10%)
- Retail trade (9%)
- Accommodation and food services (7%)
- Administrative and support and waste management services (4%)
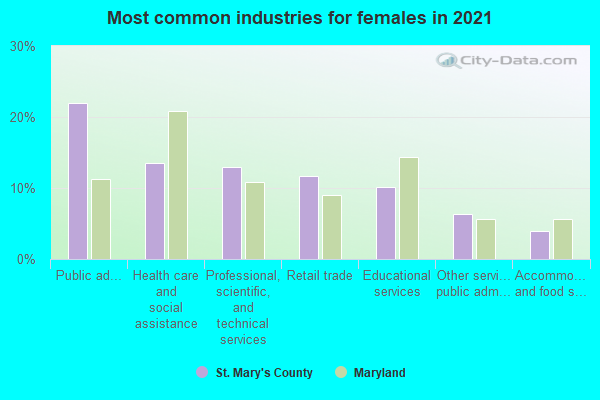
- Health care and social assistance (20%)
- Educational services (16%)
- Public administration (14%)
- Professional, scientific, and technical services (11%)
- Retail trade (9%)
- Accommodation and food services (8%)
- Administrative and support and waste management services (4%)
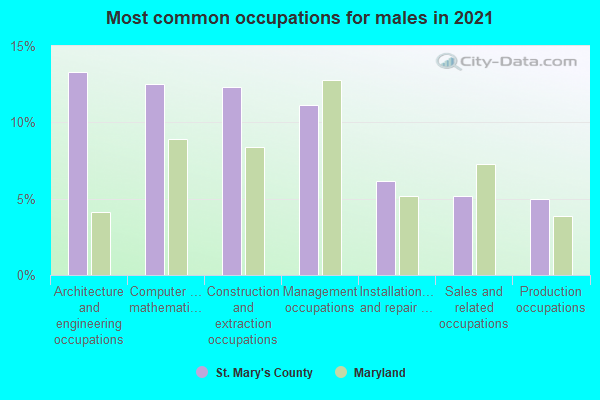
- Architecture and engineering occupations (16%)
- Management occupations (13%)
- Computer and mathematical occupations (10%)
- Construction and extraction occupations (10%)
- Sales and related occupations (8%)
- Installation, maintenance, and repair occupations (8%)
- Business and financial operations occupations (7%)
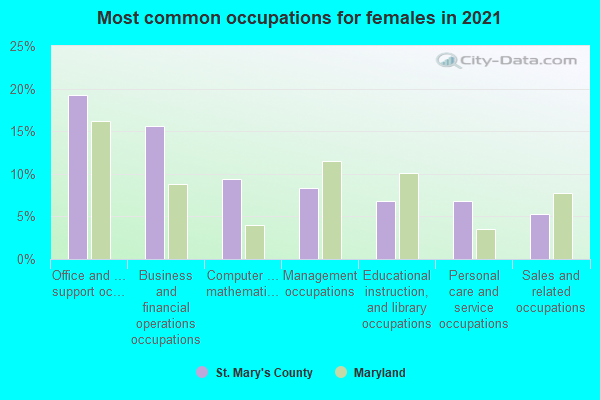
- Office and administrative support occupations (14%)
- Educational instruction, and library occupations (14%)
- Management occupations (13%)
- Business and financial operations occupations (10%)
- Sales and related occupations (7%)
- Healthcare support occupations (7%)
- Computer and mathematical occupations (5%)
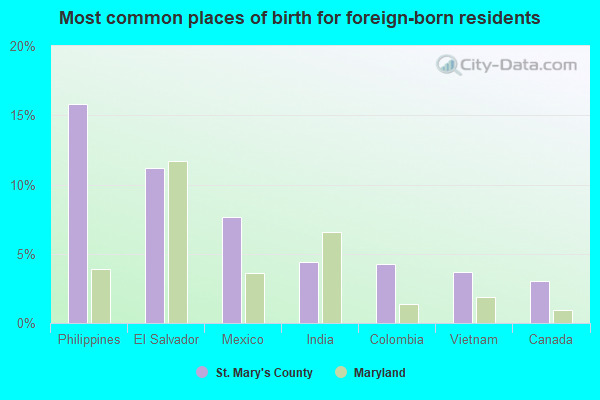
- Philippines (17%)
- El Salvador (9%)
- Mexico (6%)
- India (5%)
- Norway (5%)
- United Kingdom, excluding England and Scotland (4%)
- China, excluding Hong Kong and Taiwan (3%)
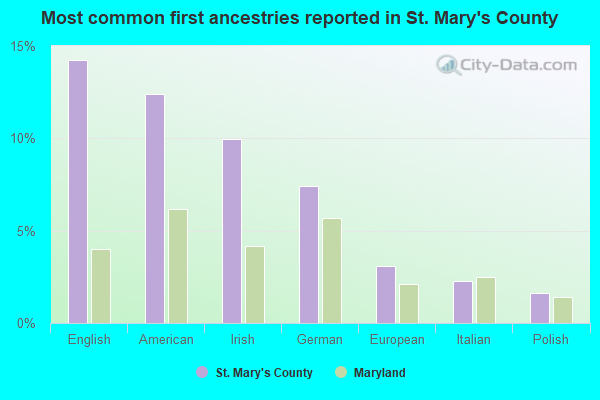
- American (13%)
- English (13%)
- German (9%)
- Irish (9%)
- Italian (3%)
- Polish (2%)
- European (2%)
People in group quarters in St. Mary's County, Maryland in 2010:
- 1,618 people in college/university student housing
- 668 people in nursing facilities/skilled-nursing facilities
- 251 people in local jails and other municipal confinement facilities
- 230 people in military barracks and dormitories (nondisciplinary)
- 55 people in emergency and transitional shelters (with sleeping facilities) for people experiencing homelessness
- 35 people in other noninstitutional facilities
- 32 people in residential treatment centers for adults
- 30 people in group homes intended for adults
- 4 people in in-patient hospice facilities
- 3 people in workers' group living quarters and job corps centers
People in group quarters in St. Mary's County, Maryland in 2000:
- 962 people in college dormitories (includes college quarters off campus)
- 622 people in nursing homes
- 596 people in military barracks, etc.
- 294 people in other noninstitutional group quarters
- 139 people in local jails and other confinement facilities (including police lockups)
- 75 people in job corps and vocational training facilities
- 23 people in homes for the mentally ill
- 18 people in homes for the mentally retarded
- 15 people in homes or halfway houses for drug/alcohol abuse
- 11 people in homes for the physically handicapped
- 11 people in religious group quarters
- 5 people in hospitals/wards and hospices for chronically ill
- 5 people in other hospitals or wards for chronically ill
- 5 people in other group homes
- 5 people in other workers' dormitories
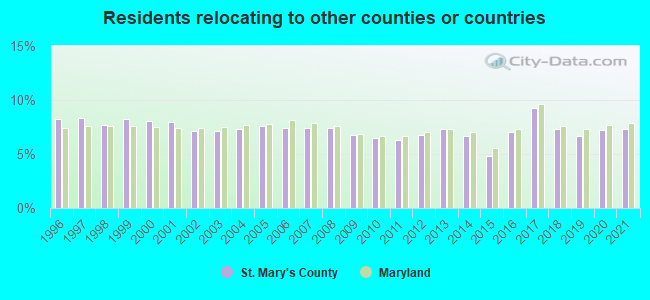
7.37% of this county's 2021 resident taxpayers lived in other counties in 2020 ($70,801 average adjusted gross income)
| Here: | 7.37% |
| Maryland average: | 7.42% |
0.13% of residents moved from foreign countries ($1,142 average AGI)
St. Mary's County: 0.13% Maryland average: 0.05%
3.36% relocated from other counties in Maryland ($31,244 average AGI)
3.87% relocated from other states ($38,415 average AGI)
St. Mary's County: 3.87% Maryland average: 3.41%

Top counties from which taxpayers relocated into this county between 2020 and 2021:
| from Charles County, MD | |
| from Calvert County, MD | |
| from Prince George's County, MD | |
| from Anne Arundel County, MD | |
| from San Diego County, CA | |
| from Montgomery County, MD | |
| from Virginia Beach city, VA |
7.28% of this county's 2020 resident taxpayers moved to other counties in 2021 ($75,710 average adjusted gross income)
| Here: | 7.28% |
| Maryland average: | 7.91% |
0.09% of residents moved to foreign countries ($968 average AGI)
St. Mary's County: 0.09% Maryland average: 0.04%
2.50% relocated to other counties in Maryland ($21,890 average AGI)
4.68% relocated to other states ($52,852 average AGI)
St. Mary's County: 4.68% Maryland average: 3.93%
Top counties to which taxpayers relocated from this county between 2020 and 2021:
| to Calvert County, MD | |
| to Charles County, MD | |
| to Prince George's County, MD | |
| to Anne Arundel County, MD | |
| to Virginia Beach city, VA | |
| to Montgomery County, MD | |
| to San Diego County, CA |
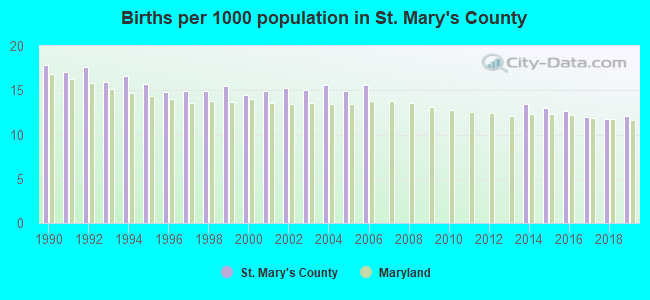
Births per 1000 population from 1990 to 1999: 16.1
Births per 1000 population from 2000 to 2009: 10.6
Births per 1000 population from 2010 to 2022: 6.7
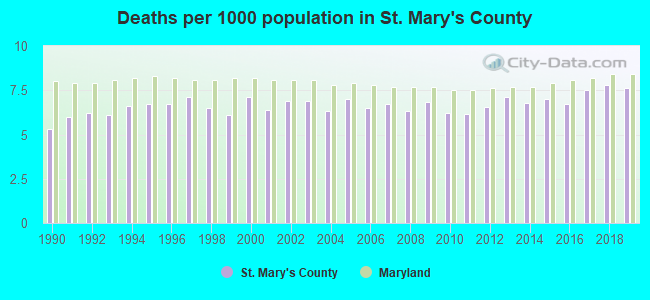
Deaths per 1000 population from 1990 to 1999: 6.3
Deaths per 1000 population from 2000 to 2009: 6.7
Deaths per 1000 population from 2010 to 2020: 7.1
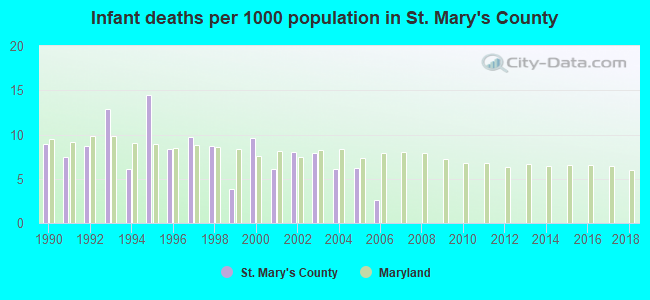
Infant deaths per 1000 live births from 1990 to 1999: 8.9
Infant deaths per 1000 live births from 2000 to 2006: 6.6
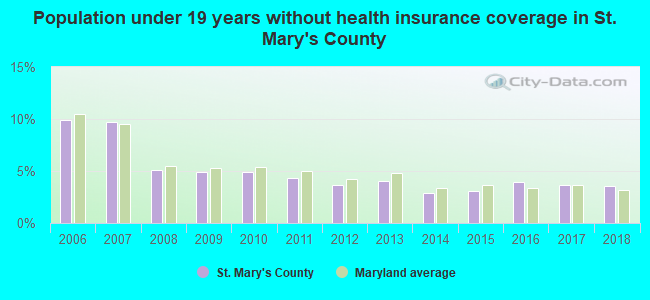
Persons under 19 years old without health insurance coverage in 2018: 3.6%

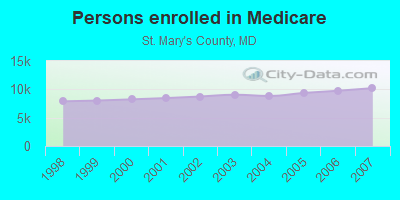
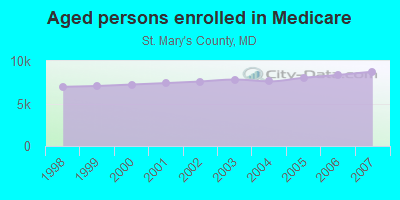
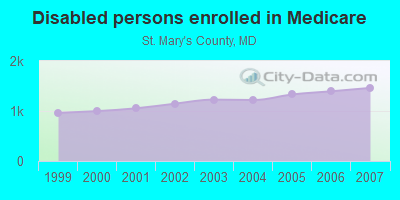
Persons enrolled in hospital insurance and/or supplemental medical insurance (Medicare) in July 1, 2007: 10,207 (8,745 aged, 1,462 disabled)
Children under 18 without health insurance coverage in 2007: 2,096 (7%)
Most common underlying causes of death in St. Mary's County, Maryland in 1999 - 2019:
- Bronchus or lung, unspecified - Malignant neoplasms (1,041)
- Atherosclerotic heart disease (883)
- Acute myocardial infarction, unspecified (741)
- Atherosclerotic cardiovascular disease, so described (727)
- Unspecified dementia (639)
- Chronic obstructive pulmonary disease, unspecified (620)
- Stroke, not specified as haemorrhage or infarction (357)
- Colon, unspecified - Malignant neoplasms (257)
- Alzheimer disease, unspecified (229)
- Unspecified diabetes mellitus, without complications (225)
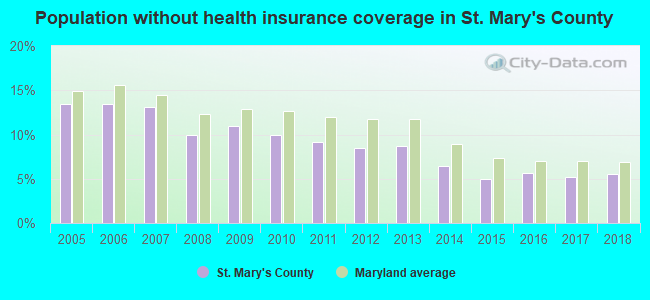
Population without health insurance coverage in 2000: 12%
Children under 18 without health insurance coverage in 2000: 9%
Short term general hospital admissions per 100,000 population in 2004: 7,371
Short term general hospital beds per 100,000 population in 2004: 119
Emergency room visits per 100,000 population in 2004: 37,582
General practice office based MDs per 100,000 population in 2005: 1,503
Medical specialist MDs per 100,000 population in 2005: 667
Dentists per 100,000 population in 1998: 18
Total births per 100,000 population, July 2005 - July 2006 : 34
Total deaths per 100,000 population, July 2005 - July 2006: 64
Limited-service eating places per 100,000 population in 2005 : 15
Homicides per 1,000,000 population from 2000 to 2006: 34.0. This is less than state average.
Suicides per 1,000,000 population from 2000 to 2006: 98.9. This is more than state average.
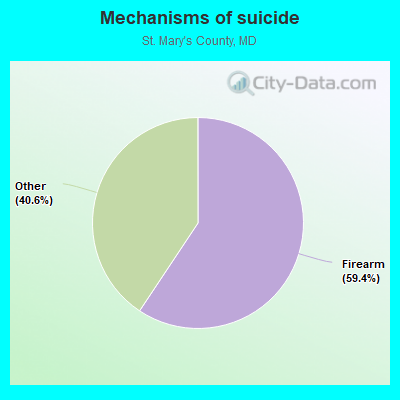
- Firearm - 58.7
- Other - 40.2
Household type by relationship:
Households: 114,877- Male householders: 22,062 (5,761 living alone), Female householders: 22,330 (4,883 living alone)
22,873 spouses (22,749 opposite-sex spouses), 2,627 unmarried partners, (2,560 opposite-sex unmarried partners), 32,672 children (30,974 natural, 268 adopted, 1,430 stepchildren), 2,827 grandchildren, 905 brothers or sisters, 1,399 parents, 0 foster children, 845 other relatives, 3,564 non-relatives
- In group quarters: 2,773
Size of family households: 12,826 2-persons, 7,640 3-persons, 5,461 4-persons, 2,762 5-persons, 1,220 6-persons, 868 7-or-more-persons.
Size of nonfamily households: 10,644 1-person, 2,403 2-persons, 541 3-persons, 27 4-persons.
18,186 married couples with children.
5,787 single-parent households (1,432 men, 4,355 women).
91.7% of residents of St. Mary's speak English at home.
3.1% of residents speak Spanish at home (63% speak English very well, 21% speak English well, 16% speak English not well).
2.1% of residents speak other Indo-European language at home (57% speak English very well, 33% speak English well, 7% speak English not well, 3% don't speak English at all).
1.6% of residents speak Asian or Pacific Island language at home (48% speak English very well, 38% speak English well, 14% speak English not well).
0.4% of residents speak other language at home (79% speak English very well, 10% speak English well, 12% don't speak English at all).
In fiscal year 2004:
Federal Government expenditure: $2,366,275,000 ($24,929 per capita)
Department of Defense expenditure: $1,989,057,000
Federal direct payments to individuals for retirement and disability: $273,009,000
Federal other direct payments to individuals: $73,168,000
Federal direct payments not to individuals: $7,645,000
Federal grants: $65,819,000
Federal procurement contracts: $1,354,190,000 ($1,336,670,000 Department of Defense)
Federal salaries and wages: $592,442,000 ($577,835,000 Department of Defense)
Federal Government direct loans: $5,936,000
Federal guaranteed/insured loans: $134,622,000
Federal Government insurance: $145,529,000
Population change from April 1, 2000 to July 1, 2005:
Births: 6,898| Here: | 71 per 1000 residents |
| State: | 71 per 1000 residents |
Deaths: 3,168
| Here: | 33 per 1000 residents |
| State: | 41 per 1000 residents |
Net international migration: +308
| Here: | +3 per 1000 residents |
| State: | +19 per 1000 residents |
Net internal migration: +6,378
| Here: | +66 per 1000 residents |
| State: | +2 per 1000 residents |
Total withdrawal of fresh water for public supply: 3.68 millions of gallons per day (all from ground)
| Here: | 7.2 |
| State: | 7.3 |
| Here: | 4.8 |
| State: | 4.2 |
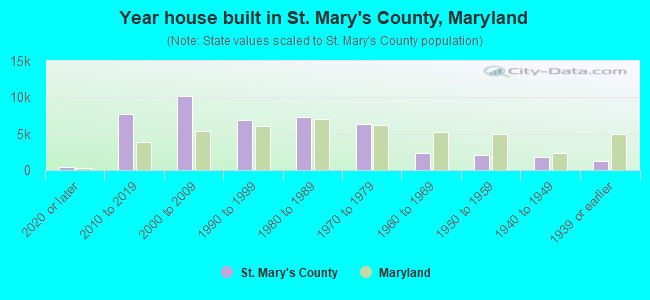
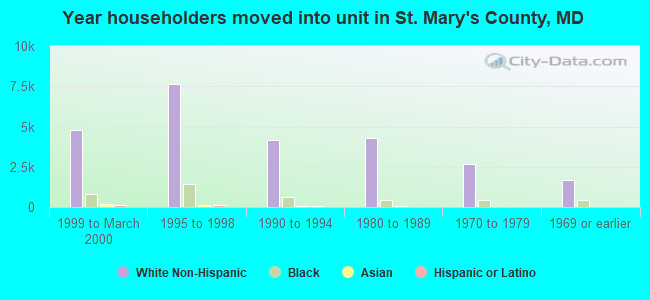
- Year house built in St. Mary's County, Maryland
- 1,0832020 or later
- 6,6882010 to 2019
- 10,7172000 to 2009
- 9,7711990 to 1999
- 7,1101980 to 1989
- 4,8201970 to 1979
- 1,9321960 to 1969
- 2,4821950 to 1959
- 6961940 to 1949
- 1,1821939 or earlier
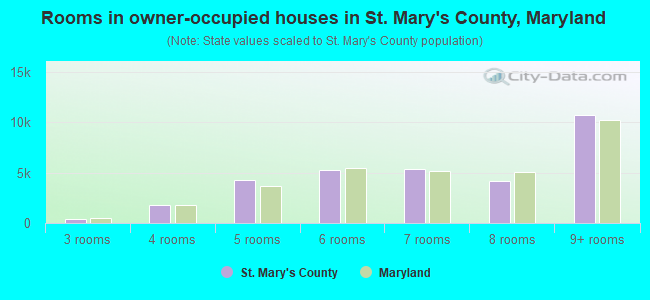
- Rooms in owner-occupied houses in St. Mary's County, Maryland
- 01 room
- 02 rooms
- 5773 rooms
- 1,6914 rooms
- 4,7425 rooms
- 4,7566 rooms
- 5,9087 rooms
- 4,2058 rooms
- 10,4469+ rooms
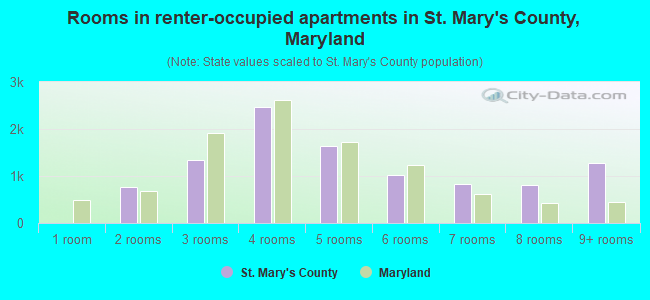
- Rooms in renter-occupied apartments in St. Mary's County, Maryland
- 3691 room
- 5632 rooms
- 1,8723 rooms
- 2,5914 rooms
- 2,1285 rooms
- 2,1446 rooms
- 1,0027 rooms
- 5898 rooms
- 8099+ rooms
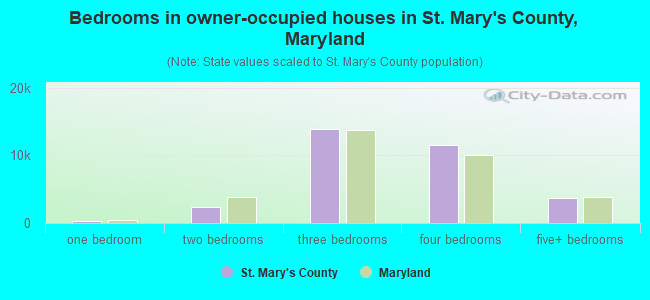
- Bedrooms in owner-occupied houses in St. Mary's County, Maryland
- 0no bedroom
- 3521 bedroom
- 2,2002 bedrooms
- 14,7863 bedrooms
- 10,5034 bedrooms
- 4,4845+ bedrooms
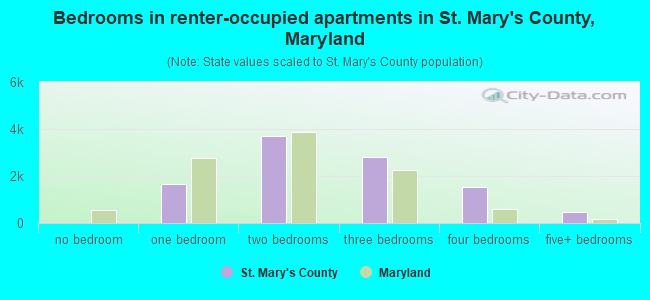
- Bedrooms in renter-occupied apartments in St. Mary's County, Maryland
- 369no bedroom
- 1,6371 bedroom
- 4,4042 bedrooms
- 3,9793 bedrooms
- 1,5544 bedrooms
- 1245+ bedrooms
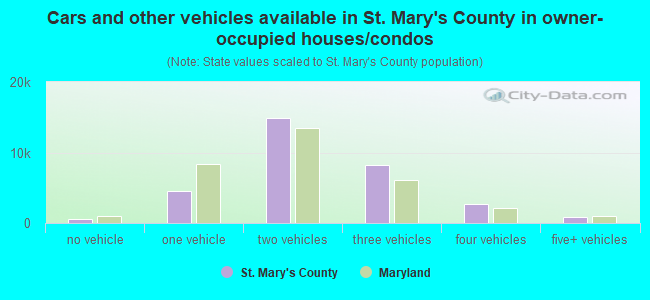
- Cars and other vehicles available in St. Mary's County in owner-occupied houses/condos
- 1,099no vehicle
- 5,9561 vehicle
- 12,1262 vehicles
- 8,7943 vehicles
- 3,1174 vehicles
- 1,2335+ vehicles
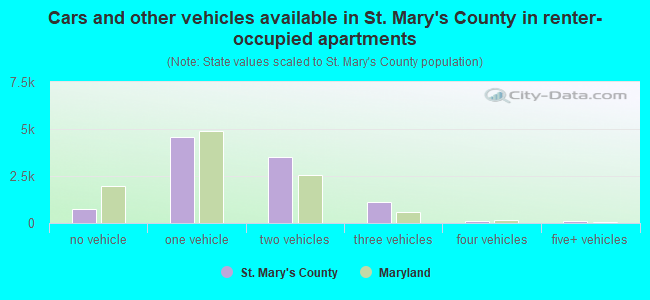
- Cars and other vehicles available in St. Mary's County in renter-occupied apartments
- 567no vehicle
- 6,8901 vehicle
- 3,3592 vehicles
- 1,0243 vehicles
- 1914 vehicles
- 365+ vehicles
88.1% of St. Mary's County residents lived in the same house 1 years ago.
Out of people who lived in different houses, 33% lived in this county.
Out of people who lived in different counties, 57% lived in Maryland.
| St. Mary's County: | 88.1% |
| State average: | 88.5% |
Place of birth for U.S.-born residents:
- This state: 58,431
- Other state: 50,419
- Northeast: 14,592
- Midwest: 7,790
- South: 22,222
- West: 5,815
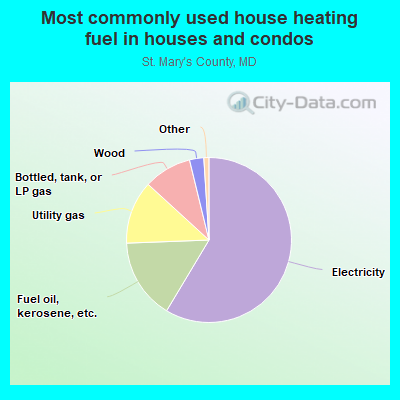
- 57.6%Electricity
- 15.4%Fuel oil, kerosene, etc.
- 10.2%Utility gas
- 10.2%Bottled, tank, or LP gas
- 4.3%Wood
- 0.9%No fuel used
- 0.9%Other fuel
- 0.5%Solar energy
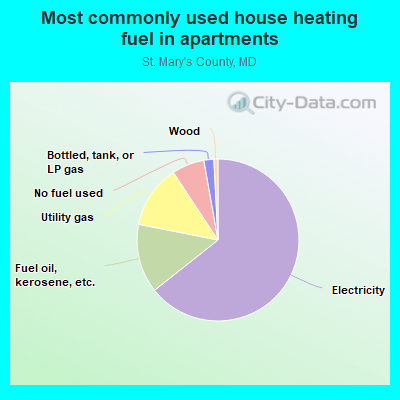
- 69.2%Electricity
- 18.0%Utility gas
- 8.3%Fuel oil, kerosene, etc.
- 2.4%Bottled, tank, or LP gas
- 1.8%No fuel used
- 0.2%Wood
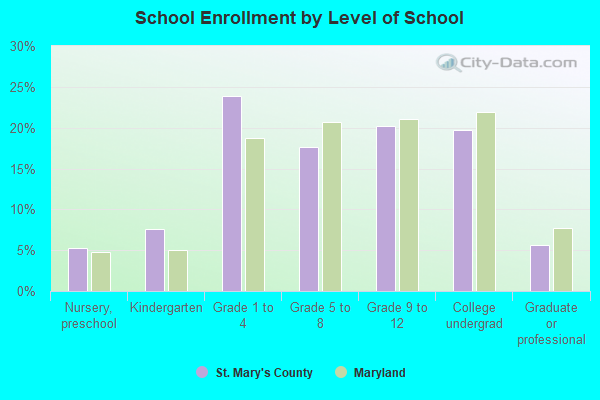
Private vs. public school enrollment:
| Here: | 23.5% |
| Maryland: | 15.2% |
| Here: | 12.3% |
| Maryland: | 14.4% |
| Here: | 15.2% |
| Maryland: | 20.2% |

St. Mary's County government finances - Expenditure in 2020:
- Bond Funds - Cash and Securities: $13,390,000
- Charges - Sewerage: $19,603,000
Sewerage: $17,875,000
Other: $7,595,000
Other: $5,264,000
Solid Waste Management: $4,760,000
Parks and Recreation: $3,826,000
Parks and Recreation: $3,366,000
Elementary and Secondary Education School Lunch: $2,815,000
Elementary and Secondary Education School Lunch: $1,956,000
Solid Waste Management: $545,000
Air Transportation: $136,000
Air Transportation: $87,000
Elementary and Secondary Education School Tuition and Transportation: $28,000
Elementary and Secondary Education - Other: $7,000
Elementary and Secondary Education School Tuition and Transportation: $6,000
- Construction - Elementary and Secondary Education: $16,779,000
Water Utilities: $5,452,000
Sewerage: $5,177,000
Water Utilities: $4,002,000
Sewerage: $2,562,000
Elementary and Secondary Education: $2,465,000
Police Protection: $2,150,000
Regular Highways: $663,000
General - Other: $538,000
Financial Administration: $506,000
Transit Utilities: $390,000
Judicial and Legal Services: $338,000
Protective Inspection and Regulation - Other: $266,000
Correctional Institutions: $110,000
Parks and Recreation: $96,000
General Public Buildings: $65,000
Central Staff Services: $43,000
Air Transportation: $15,000
Health - Other: $13,000
Natural Resources - Other: $3,000
- Current Operations - Elementary and Secondary Education: $239,612,000
Elementary and Secondary Education: $226,272,000
General - Other: $59,292,000
Police Protection: $27,676,000
General - Other: $23,579,000
Police Protection: $23,435,000
Regular Highways: $20,800,000
Water Utilities: $19,728,000
Water Utilities: $18,759,000
Sewerage: $14,957,000
Regular Highways: $13,566,000
Parks and Recreation: $13,517,000
Sewerage: $12,868,000
Correctional Institutions: $11,699,000
Correctional Institutions: $10,492,000
Parks and Recreation: $9,529,000
Judicial and Legal Services: $6,414,000
Financial Administration: $6,190,000
Judicial and Legal Services: $5,771,000
Financial Administration: $5,407,000
Natural Resources - Other: $5,391,000
Central Staff Services: $4,936,000
Central Staff Services: $4,918,000
Solid Waste Management: $4,806,000
Solid Waste Management: $4,097,000
General Public Buildings: $3,591,000
General Public Buildings: $3,521,000
Local Fire Protection: $3,092,000
Local Fire Protection: $2,814,000
Protective Inspection and Regulation - Other: $2,695,000
Transit Utilities: $2,516,000
Transit Utilities: $2,381,000
Natural Resources - Other: $2,212,000
Health - Other: $1,661,000
Health - Other: $1,610,000
Air Transportation: $122,000
Protective Inspection and Regulation - Other: $75,000
Air Transportation: $22,000
- Federal Intergovernmental - Other: $15,235,000
Education: $6,212,000
Education: $5,211,000
Other: $3,011,000
Transit Utilities: $1,559,000
Transit Utilities: $1,154,000
Natural Resources: $44,000
- General - Interest on Debt: $8,769,000
Interest on Debt: $7,306,000
- Intergovernmental to Local - Other - Libraries: $2,964,000
Other - Libraries: $2,801,000
Other - Health - Other: $2,430,000
Other - Health - Other: $2,194,000
Other - Elementary and Secondary Education: $1,912,000
Other - Elementary and Secondary Education: $1,900,000
Other - Sewerage: $148,000
Other - Electric Utilities: $113,000
Other - General - Other: $45,000
Other - General - Other: $43,000
- Local Intergovernmental - Sewerage: $37,000
Sewerage: $36,000
- Long Term Debt - Outstanding Unspecified Public Purpose: $312,854,000
Beginning Outstanding - Unspecified Public Purpose: $311,963,000
Outstanding Unspecified Public Purpose: $300,047,000
Beginning Outstanding - Unspecified Public Purpose: $283,360,000
Issue, Unspecified Public Purpose: $55,186,000
Retired Unspecified Public Purpose: $42,483,000
Issue, Unspecified Public Purpose: $30,566,000
Retired Unspecified Public Purpose: $25,691,000
Beginning Outstanding - Public Debt for Private Purpose: $11,003,000
Outstanding Nonguaranteed - Industrial Revenue: $10,042,000
Beginning Outstanding - Public Debt for Private Purpose: $9,081,000
Outstanding Nonguaranteed - Industrial Revenue: $8,120,000
Retired Nonguaranteed - Public Debt for Private Purpose: $961,000
Retired Nonguaranteed - Public Debt for Private Purpose: $961,000
- Miscellaneous - General Revenue - Other: $16,700,000
General Revenue - Other: $14,237,000
Special Assessments: $13,433,000
Special Assessments: $12,154,000
Interest Earnings: $3,352,000
Interest Earnings: $1,806,000
Fines and Forfeits: $377,000
Sale of Property: $38,000
Fines and Forfeits: $16,000
- Other Capital Outlay - Elementary and Secondary Education: $2,706,000
Police Protection: $2,520,000
Elementary and Secondary Education: $2,204,000
Regular Highways: $1,169,000
Transit Utilities: $959,000
Financial Administration: $292,000
General - Other: $288,000
Sewerage: $171,000
Sewerage: $156,000
Water Utilities: $119,000
Judicial and Legal Services: $99,000
Correctional Institutions: $97,000
Parks and Recreation: $91,000
General Public Building: $64,000
Central Staff Services: $44,000
Health - Other: $20,000
Water Utilities: $11,000
Natural Resources - Other: $2,000
- Other Funds - Cash and Securities: $194,277,000
Cash and Securities: $139,962,000
- Revenue - Water Utilities: $10,595,000
Water Utilities: $9,504,000
Transit Utilities: $341,000
Transit Utilities: $270,000
- Sinking Funds - Cash and Securities: $10,042,000
Cash and Securities: $8,120,000
- State Intergovernmental - Education: $136,645,000
Education: $119,225,000
Other: $8,728,000
Other: $4,908,000
Highways: $2,181,000
Highways: $1,553,000
Transit Utilities: $467,000
Transit Utilities: $458,000
- Tax - Property: $119,994,000
Property: $110,533,000
Individual Income: $107,335,000
Individual Income: $90,411,000
Other Selective Sales: $12,621,000
Other Selective Sales: $11,972,000
Documentary and Stock Transfer: $6,161,000
Documentary and Stock Transfer: $5,918,000
Public Utility License: $1,018,000
Public Utility License: $976,000
Death and Gift: $800,000
Other License: $317,000
Other License: $227,000
Occupation and Business License - Other: $188,000
Occupation and Business License - Other: $164,000
Amusements Sales: $132,000
Amusements Sales: $104,000
Alcoholic Beverage License: $99,000
Alcoholic Beverage License: $76,000
Amusements License: $2,000
- Total Salaries and Wages: $161,525,000
: $151,994,000
- Water Utilities - Interest on Debt: $1,054,000
Interest on Debt: $860,000
St. Mary's County government finances - Revenue in 2020:
- Bond Funds - Cash and Securities: $13,390,000
- Charges - Sewerage: $19,603,000
Sewerage: $17,875,000
Other: $7,595,000
Other: $5,264,000
Solid Waste Management: $4,760,000
Parks and Recreation: $3,826,000
Parks and Recreation: $3,366,000
Elementary and Secondary Education School Lunch: $2,815,000
Elementary and Secondary Education School Lunch: $1,956,000
Solid Waste Management: $545,000
Air Transportation: $136,000
Air Transportation: $87,000
Elementary and Secondary Education School Tuition and Transportation: $28,000
Elementary and Secondary Education - Other: $7,000
Elementary and Secondary Education School Tuition and Transportation: $6,000
- Construction - Elementary and Secondary Education: $16,779,000
Water Utilities: $5,452,000
Sewerage: $5,177,000
Water Utilities: $4,002,000
Sewerage: $2,562,000
Elementary and Secondary Education: $2,465,000
Police Protection: $2,150,000
Regular Highways: $663,000
General - Other: $538,000
Financial Administration: $506,000
Transit Utilities: $390,000
Judicial and Legal Services: $338,000
Protective Inspection and Regulation - Other: $266,000
Correctional Institutions: $110,000
Parks and Recreation: $96,000
General Public Buildings: $65,000
Central Staff Services: $43,000
Air Transportation: $15,000
Health - Other: $13,000
Natural Resources - Other: $3,000
- Current Operations - Elementary and Secondary Education: $239,612,000
Elementary and Secondary Education: $226,272,000
General - Other: $59,292,000
Police Protection: $27,676,000
General - Other: $23,579,000
Police Protection: $23,435,000
Regular Highways: $20,800,000
Water Utilities: $19,728,000
Water Utilities: $18,759,000
Sewerage: $14,957,000
Regular Highways: $13,566,000
Parks and Recreation: $13,517,000
Sewerage: $12,868,000
Correctional Institutions: $11,699,000
Correctional Institutions: $10,492,000
Parks and Recreation: $9,529,000
Judicial and Legal Services: $6,414,000
Financial Administration: $6,190,000
Judicial and Legal Services: $5,771,000
Financial Administration: $5,407,000
Natural Resources - Other: $5,391,000
Central Staff Services: $4,936,000
Central Staff Services: $4,918,000
Solid Waste Management: $4,806,000
Solid Waste Management: $4,097,000
General Public Buildings: $3,591,000
General Public Buildings: $3,521,000
Local Fire Protection: $3,092,000
Local Fire Protection: $2,814,000
Protective Inspection and Regulation - Other: $2,695,000
Transit Utilities: $2,516,000
Transit Utilities: $2,381,000
Natural Resources - Other: $2,212,000
Health - Other: $1,661,000
Health - Other: $1,610,000
Air Transportation: $122,000
Protective Inspection and Regulation - Other: $75,000
Air Transportation: $22,000
- Federal Intergovernmental - Other: $15,235,000
Education: $6,212,000
Education: $5,211,000
Other: $3,011,000
Transit Utilities: $1,559,000
Transit Utilities: $1,154,000
Natural Resources: $44,000
- General - Interest on Debt: $8,769,000
Interest on Debt: $7,306,000
- Intergovernmental to Local - Other - Libraries: $2,964,000
Other - Libraries: $2,801,000
Other - Health - Other: $2,430,000
Other - Health - Other: $2,194,000
Other - Elementary and Secondary Education: $1,912,000
Other - Elementary and Secondary Education: $1,900,000
Other - Sewerage: $148,000
Other - Electric Utilities: $113,000
Other - General - Other: $45,000
Other - General - Other: $43,000
- Local Intergovernmental - Sewerage: $37,000
Sewerage: $36,000
- Long Term Debt - Outstanding Unspecified Public Purpose: $312,854,000
Beginning Outstanding - Unspecified Public Purpose: $311,963,000
Outstanding Unspecified Public Purpose: $300,047,000
Beginning Outstanding - Unspecified Public Purpose: $283,360,000
Issue, Unspecified Public Purpose: $55,186,000
Retired Unspecified Public Purpose: $42,483,000
Issue, Unspecified Public Purpose: $30,566,000
Retired Unspecified Public Purpose: $25,691,000
Beginning Outstanding - Public Debt for Private Purpose: $11,003,000
Outstanding Nonguaranteed - Industrial Revenue: $10,042,000
Beginning Outstanding - Public Debt for Private Purpose: $9,081,000
Outstanding Nonguaranteed - Industrial Revenue: $8,120,000
Retired Nonguaranteed - Public Debt for Private Purpose: $961,000
Retired Nonguaranteed - Public Debt for Private Purpose: $961,000
- Miscellaneous - General Revenue - Other: $16,700,000
General Revenue - Other: $14,237,000
Special Assessments: $13,433,000
Special Assessments: $12,154,000
Interest Earnings: $3,352,000
Interest Earnings: $1,806,000
Fines and Forfeits: $377,000
Sale of Property: $38,000
Fines and Forfeits: $16,000
- Other Capital Outlay - Elementary and Secondary Education: $2,706,000
Police Protection: $2,520,000
Elementary and Secondary Education: $2,204,000
Regular Highways: $1,169,000
Transit Utilities: $959,000
Financial Administration: $292,000
General - Other: $288,000
Sewerage: $171,000
Sewerage: $156,000
Water Utilities: $119,000
Judicial and Legal Services: $99,000
Correctional Institutions: $97,000
Parks and Recreation: $91,000
General Public Building: $64,000
Central Staff Services: $44,000
Health - Other: $20,000
Water Utilities: $11,000
Natural Resources - Other: $2,000
- Other Funds - Cash and Securities: $194,277,000
Cash and Securities: $139,962,000
- Revenue - Water Utilities: $10,595,000
Water Utilities: $9,504,000
Transit Utilities: $341,000
Transit Utilities: $270,000
- Sinking Funds - Cash and Securities: $10,042,000
Cash and Securities: $8,120,000
- State Intergovernmental - Education: $136,645,000
Education: $119,225,000
Other: $8,728,000
Other: $4,908,000
Highways: $2,181,000
Highways: $1,553,000
Transit Utilities: $467,000
Transit Utilities: $458,000
- Tax - Property: $119,994,000
Property: $110,533,000
Individual Income: $107,335,000
Individual Income: $90,411,000
Other Selective Sales: $12,621,000
Other Selective Sales: $11,972,000
Documentary and Stock Transfer: $6,161,000
Documentary and Stock Transfer: $5,918,000
Public Utility License: $1,018,000
Public Utility License: $976,000
Death and Gift: $800,000
Other License: $317,000
Other License: $227,000
Occupation and Business License - Other: $188,000
Occupation and Business License - Other: $164,000
Amusements Sales: $132,000
Amusements Sales: $104,000
Alcoholic Beverage License: $99,000
Alcoholic Beverage License: $76,000
Amusements License: $2,000
- Total Salaries and Wages: $161,525,000
: $151,994,000
- Water Utilities - Interest on Debt: $1,054,000
Interest on Debt: $860,000
St. Mary's County government finances - Debt in 2020:
- Bond Funds - Cash and Securities: $13,390,000
- Charges - Sewerage: $19,603,000
Sewerage: $17,875,000
Other: $7,595,000
Other: $5,264,000
Solid Waste Management: $4,760,000
Parks and Recreation: $3,826,000
Parks and Recreation: $3,366,000
Elementary and Secondary Education School Lunch: $2,815,000
Elementary and Secondary Education School Lunch: $1,956,000
Solid Waste Management: $545,000
Air Transportation: $136,000
Air Transportation: $87,000
Elementary and Secondary Education School Tuition and Transportation: $28,000
Elementary and Secondary Education - Other: $7,000
Elementary and Secondary Education School Tuition and Transportation: $6,000
- Construction - Elementary and Secondary Education: $16,779,000
Water Utilities: $5,452,000
Sewerage: $5,177,000
Water Utilities: $4,002,000
Sewerage: $2,562,000
Elementary and Secondary Education: $2,465,000
Police Protection: $2,150,000
Regular Highways: $663,000
General - Other: $538,000
Financial Administration: $506,000
Transit Utilities: $390,000
Judicial and Legal Services: $338,000
Protective Inspection and Regulation - Other: $266,000
Correctional Institutions: $110,000
Parks and Recreation: $96,000
General Public Buildings: $65,000
Central Staff Services: $43,000
Air Transportation: $15,000
Health - Other: $13,000
Natural Resources - Other: $3,000
- Current Operations - Elementary and Secondary Education: $239,612,000
Elementary and Secondary Education: $226,272,000
General - Other: $59,292,000
Police Protection: $27,676,000
General - Other: $23,579,000
Police Protection: $23,435,000
Regular Highways: $20,800,000
Water Utilities: $19,728,000
Water Utilities: $18,759,000
Sewerage: $14,957,000
Regular Highways: $13,566,000
Parks and Recreation: $13,517,000
Sewerage: $12,868,000
Correctional Institutions: $11,699,000
Correctional Institutions: $10,492,000
Parks and Recreation: $9,529,000
Judicial and Legal Services: $6,414,000
Financial Administration: $6,190,000
Judicial and Legal Services: $5,771,000
Financial Administration: $5,407,000
Natural Resources - Other: $5,391,000
Central Staff Services: $4,936,000
Central Staff Services: $4,918,000
Solid Waste Management: $4,806,000
Solid Waste Management: $4,097,000
General Public Buildings: $3,591,000
General Public Buildings: $3,521,000
Local Fire Protection: $3,092,000
Local Fire Protection: $2,814,000
Protective Inspection and Regulation - Other: $2,695,000
Transit Utilities: $2,516,000
Transit Utilities: $2,381,000
Natural Resources - Other: $2,212,000
Health - Other: $1,661,000
Health - Other: $1,610,000
Air Transportation: $122,000
Protective Inspection and Regulation - Other: $75,000
Air Transportation: $22,000
- Federal Intergovernmental - Other: $15,235,000
Education: $6,212,000
Education: $5,211,000
Other: $3,011,000
Transit Utilities: $1,559,000
Transit Utilities: $1,154,000
Natural Resources: $44,000
- General - Interest on Debt: $8,769,000
Interest on Debt: $7,306,000
- Intergovernmental to Local - Other - Libraries: $2,964,000
Other - Libraries: $2,801,000
Other - Health - Other: $2,430,000
Other - Health - Other: $2,194,000
Other - Elementary and Secondary Education: $1,912,000
Other - Elementary and Secondary Education: $1,900,000
Other - Sewerage: $148,000
Other - Electric Utilities: $113,000
Other - General - Other: $45,000
Other - General - Other: $43,000
- Local Intergovernmental - Sewerage: $37,000
Sewerage: $36,000
- Long Term Debt - Outstanding Unspecified Public Purpose: $312,854,000
Beginning Outstanding - Unspecified Public Purpose: $311,963,000
Outstanding Unspecified Public Purpose: $300,047,000
Beginning Outstanding - Unspecified Public Purpose: $283,360,000
Issue, Unspecified Public Purpose: $55,186,000
Retired Unspecified Public Purpose: $42,483,000
Issue, Unspecified Public Purpose: $30,566,000
Retired Unspecified Public Purpose: $25,691,000
Beginning Outstanding - Public Debt for Private Purpose: $11,003,000
Outstanding Nonguaranteed - Industrial Revenue: $10,042,000
Beginning Outstanding - Public Debt for Private Purpose: $9,081,000
Outstanding Nonguaranteed - Industrial Revenue: $8,120,000
Retired Nonguaranteed - Public Debt for Private Purpose: $961,000
Retired Nonguaranteed - Public Debt for Private Purpose: $961,000
- Miscellaneous - General Revenue - Other: $16,700,000
General Revenue - Other: $14,237,000
Special Assessments: $13,433,000
Special Assessments: $12,154,000
Interest Earnings: $3,352,000
Interest Earnings: $1,806,000
Fines and Forfeits: $377,000
Sale of Property: $38,000
Fines and Forfeits: $16,000
- Other Capital Outlay - Elementary and Secondary Education: $2,706,000
Police Protection: $2,520,000
Elementary and Secondary Education: $2,204,000
Regular Highways: $1,169,000
Transit Utilities: $959,000
Financial Administration: $292,000
General - Other: $288,000
Sewerage: $171,000
Sewerage: $156,000
Water Utilities: $119,000
Judicial and Legal Services: $99,000
Correctional Institutions: $97,000
Parks and Recreation: $91,000
General Public Building: $64,000
Central Staff Services: $44,000
Health - Other: $20,000
Water Utilities: $11,000
Natural Resources - Other: $2,000
- Other Funds - Cash and Securities: $194,277,000
Cash and Securities: $139,962,000
- Revenue - Water Utilities: $10,595,000
Water Utilities: $9,504,000
Transit Utilities: $341,000
Transit Utilities: $270,000
- Sinking Funds - Cash and Securities: $10,042,000
Cash and Securities: $8,120,000
- State Intergovernmental - Education: $136,645,000
Education: $119,225,000
Other: $8,728,000
Other: $4,908,000
Highways: $2,181,000
Highways: $1,553,000
Transit Utilities: $467,000
Transit Utilities: $458,000
- Tax - Property: $119,994,000
Property: $110,533,000
Individual Income: $107,335,000
Individual Income: $90,411,000
Other Selective Sales: $12,621,000
Other Selective Sales: $11,972,000
Documentary and Stock Transfer: $6,161,000
Documentary and Stock Transfer: $5,918,000
Public Utility License: $1,018,000
Public Utility License: $976,000
Death and Gift: $800,000
Other License: $317,000
Other License: $227,000
Occupation and Business License - Other: $188,000
Occupation and Business License - Other: $164,000
Amusements Sales: $132,000
Amusements Sales: $104,000
Alcoholic Beverage License: $99,000
Alcoholic Beverage License: $76,000
Amusements License: $2,000
- Total Salaries and Wages: $161,525,000
: $151,994,000
- Water Utilities - Interest on Debt: $1,054,000
Interest on Debt: $860,000
St. Mary's County government finances - Cash and Securities in 2020:
- Bond Funds - Cash and Securities: $13,390,000
- Charges - Sewerage: $19,603,000
Sewerage: $17,875,000
Other: $7,595,000
Other: $5,264,000
Solid Waste Management: $4,760,000
Parks and Recreation: $3,826,000
Parks and Recreation: $3,366,000
Elementary and Secondary Education School Lunch: $2,815,000
Elementary and Secondary Education School Lunch: $1,956,000
Solid Waste Management: $545,000
Air Transportation: $136,000
Air Transportation: $87,000
Elementary and Secondary Education School Tuition and Transportation: $28,000
Elementary and Secondary Education - Other: $7,000
Elementary and Secondary Education School Tuition and Transportation: $6,000
- Construction - Elementary and Secondary Education: $16,779,000
Water Utilities: $5,452,000
Sewerage: $5,177,000
Water Utilities: $4,002,000
Sewerage: $2,562,000
Elementary and Secondary Education: $2,465,000
Police Protection: $2,150,000
Regular Highways: $663,000
General - Other: $538,000
Financial Administration: $506,000
Transit Utilities: $390,000
Judicial and Legal Services: $338,000
Protective Inspection and Regulation - Other: $266,000
Correctional Institutions: $110,000
Parks and Recreation: $96,000
General Public Buildings: $65,000
Central Staff Services: $43,000
Air Transportation: $15,000
Health - Other: $13,000
Natural Resources - Other: $3,000
- Current Operations - Elementary and Secondary Education: $239,612,000
Elementary and Secondary Education: $226,272,000
General - Other: $59,292,000
Police Protection: $27,676,000
General - Other: $23,579,000
Police Protection: $23,435,000
Regular Highways: $20,800,000
Water Utilities: $19,728,000
Water Utilities: $18,759,000
Sewerage: $14,957,000
Regular Highways: $13,566,000
Parks and Recreation: $13,517,000
Sewerage: $12,868,000
Correctional Institutions: $11,699,000
Correctional Institutions: $10,492,000
Parks and Recreation: $9,529,000
Judicial and Legal Services: $6,414,000
Financial Administration: $6,190,000
Judicial and Legal Services: $5,771,000
Financial Administration: $5,407,000
Natural Resources - Other: $5,391,000
Central Staff Services: $4,936,000
Central Staff Services: $4,918,000
Solid Waste Management: $4,806,000
Solid Waste Management: $4,097,000
General Public Buildings: $3,591,000
General Public Buildings: $3,521,000
Local Fire Protection: $3,092,000
Local Fire Protection: $2,814,000
Protective Inspection and Regulation - Other: $2,695,000
Transit Utilities: $2,516,000
Transit Utilities: $2,381,000
Natural Resources - Other: $2,212,000
Health - Other: $1,661,000
Health - Other: $1,610,000
Air Transportation: $122,000
Protective Inspection and Regulation - Other: $75,000
Air Transportation: $22,000
- Federal Intergovernmental - Other: $15,235,000
Education: $6,212,000
Education: $5,211,000
Other: $3,011,000
Transit Utilities: $1,559,000
Transit Utilities: $1,154,000
Natural Resources: $44,000
- General - Interest on Debt: $8,769,000
Interest on Debt: $7,306,000
- Intergovernmental to Local - Other - Libraries: $2,964,000
Other - Libraries: $2,801,000
Other - Health - Other: $2,430,000
Other - Health - Other: $2,194,000
Other - Elementary and Secondary Education: $1,912,000
Other - Elementary and Secondary Education: $1,900,000
Other - Sewerage: $148,000
Other - Electric Utilities: $113,000
Other - General - Other: $45,000
Other - General - Other: $43,000
- Local Intergovernmental - Sewerage: $37,000
Sewerage: $36,000
- Long Term Debt - Outstanding Unspecified Public Purpose: $312,854,000
Beginning Outstanding - Unspecified Public Purpose: $311,963,000
Outstanding Unspecified Public Purpose: $300,047,000
Beginning Outstanding - Unspecified Public Purpose: $283,360,000
Issue, Unspecified Public Purpose: $55,186,000
Retired Unspecified Public Purpose: $42,483,000
Issue, Unspecified Public Purpose: $30,566,000
Retired Unspecified Public Purpose: $25,691,000
Beginning Outstanding - Public Debt for Private Purpose: $11,003,000
Outstanding Nonguaranteed - Industrial Revenue: $10,042,000
Beginning Outstanding - Public Debt for Private Purpose: $9,081,000
Outstanding Nonguaranteed - Industrial Revenue: $8,120,000
Retired Nonguaranteed - Public Debt for Private Purpose: $961,000
Retired Nonguaranteed - Public Debt for Private Purpose: $961,000
- Miscellaneous - General Revenue - Other: $16,700,000
General Revenue - Other: $14,237,000
Special Assessments: $13,433,000
Special Assessments: $12,154,000
Interest Earnings: $3,352,000
Interest Earnings: $1,806,000
Fines and Forfeits: $377,000
Sale of Property: $38,000
Fines and Forfeits: $16,000
- Other Capital Outlay - Elementary and Secondary Education: $2,706,000
Police Protection: $2,520,000
Elementary and Secondary Education: $2,204,000
Regular Highways: $1,169,000
Transit Utilities: $959,000
Financial Administration: $292,000
General - Other: $288,000
Sewerage: $171,000
Sewerage: $156,000
Water Utilities: $119,000
Judicial and Legal Services: $99,000
Correctional Institutions: $97,000
Parks and Recreation: $91,000
General Public Building: $64,000
Central Staff Services: $44,000
Health - Other: $20,000
Water Utilities: $11,000
Natural Resources - Other: $2,000
- Other Funds - Cash and Securities: $194,277,000
Cash and Securities: $139,962,000
- Revenue - Water Utilities: $10,595,000
Water Utilities: $9,504,000
Transit Utilities: $341,000
Transit Utilities: $270,000
- Sinking Funds - Cash and Securities: $10,042,000
Cash and Securities: $8,120,000
- State Intergovernmental - Education: $136,645,000
Education: $119,225,000
Other: $8,728,000
Other: $4,908,000
Highways: $2,181,000
Highways: $1,553,000
Transit Utilities: $467,000
Transit Utilities: $458,000
- Tax - Property: $119,994,000
Property: $110,533,000
Individual Income: $107,335,000
Individual Income: $90,411,000
Other Selective Sales: $12,621,000
Other Selective Sales: $11,972,000
Documentary and Stock Transfer: $6,161,000
Documentary and Stock Transfer: $5,918,000
Public Utility License: $1,018,000
Public Utility License: $976,000
Death and Gift: $800,000
Other License: $317,000
Other License: $227,000
Occupation and Business License - Other: $188,000
Occupation and Business License - Other: $164,000
Amusements Sales: $132,000
Amusements Sales: $104,000
Alcoholic Beverage License: $99,000
Alcoholic Beverage License: $76,000
Amusements License: $2,000
- Total Salaries and Wages: $161,525,000
: $151,994,000
- Water Utilities - Interest on Debt: $1,054,000
Interest on Debt: $860,000
Supplemental Security Income (SSI) in 2006:
- Total number of recipients: 1,163
- Number of aged recipients: 178
- Number of blind and disabled recipients: 985
- Number of recipients under 18: 126
- Number of recipients between 18 and 64: 726
- Number of recipients older than 64: 311
- Number of recipients also receiving OASDI: 391
- Amount of payments (thousands of dollars): 536
| Most common first names in St. Mary's County, MD among deceased individuals | ||
| Name | Count | Lived (average) |
|---|---|---|
| Mary | 402 | 78.6 years |
| James | 338 | 71.8 years |
| William | 310 | 72.7 years |
| John | 293 | 71.7 years |
| Joseph | 267 | 71.1 years |
| Charles | 170 | 72.0 years |
| George | 155 | 72.4 years |
| Robert | 152 | 70.5 years |
| Thomas | 133 | 73.7 years |
| Margaret | 118 | 77.2 years |
| Most common last names in St. Mary's County, MD among deceased individuals | ||
| Last name | Count | Lived (average) |
|---|---|---|
| Johnson | 82 | 75.7 years |
| Wood | 69 | 77.2 years |
| Smith | 68 | 74.0 years |
| Mattingly | 57 | 76.3 years |
| Thomas | 54 | 70.1 years |
| Buckler | 54 | 74.6 years |
| Long | 53 | 74.7 years |
| Russell | 51 | 75.4 years |
| Thompson | 49 | 75.1 years |
| Davis | 46 | 73.7 years |
| Businesses in St. Mary's County, MD | ||||
| Name | Count | Name | Count | |
|---|---|---|---|---|
| 7-Eleven | 2 | Long John Silver's | 1 | |
| AT&T | 1 | Lowe's | 1 | |
| Advance Auto Parts | 2 | Marriott | 2 | |
| Applebee's | 1 | Marshalls | 1 | |
| Arby's | 3 | MasterBrand Cabinets | 12 | |
| AutoZone | 4 | McDonald's | 5 | |
| Bath & Body Works | 1 | Nike | 4 | |
| Blockbuster | 1 | Old Navy | 1 | |
| Budget Car Rental | 1 | Olive Garden | 1 | |
| Burger King | 3 | Outback | 1 | |
| CVS | 3 | Outback Steakhouse | 1 | |
| Chevrolet | 1 | Panera Bread | 1 | |
| Chick-Fil-A | 1 | Papa John's Pizza | 2 | |
| Chipotle | 1 | Payless | 1 | |
| Curves | 1 | Penske | 1 | |
| Days Inn | 1 | Pier 1 Imports | 1 | |
| Decora Cabinetry | 2 | Pizza Hut | 3 | |
| Domino's Pizza | 2 | Popeyes | 2 | |
| DressBarn | 1 | Quiznos | 1 | |
| Dressbarn | 1 | RadioShack | 3 | |
| Dunkin Donuts | 1 | Red Robin | 1 | |
| Extended Stay America | 1 | Rite Aid | 3 | |
| Famous Footwear | 1 | Ruby Tuesday | 1 | |
| Fashion Bug | 1 | Sears | 1 | |
| FedEx | 13 | Sleep Inn | 1 | |
| Foot Locker | 1 | Staples | 1 | |
| Ford | 2 | Starbucks | 1 | |
| GNC | 2 | Subway | 8 | |
| GameStop | 1 | Super 8 | 1 | |
| Giant | 1 | T-Mobile | 2 | |
| H&R Block | 4 | Taco Bell | 2 | |
| Hilton | 1 | Target | 1 | |
| Hyundai | 1 | The Room Place | 1 | |
| IHOP | 1 | Toyota | 1 | |
| JCPenney | 1 | True Value | 3 | |
| Jones New York | 2 | U-Haul | 4 | |
| KFC | 2 | UPS | 9 | |
| Kmart | 1 | Verizon Wireless | 2 | |
| Kohl's | 1 | Walmart | 1 | |
| La Quinta | 1 | Wendy's | 4 | |
| Lane Furniture | 1 | World Gym | 4 | |
St. Mary's County on our top lists:
- #61 on the list of "Top 101 counties with the largest number of people moving in compared to moving out (pop. 50,000+)"
- #70 on the list of "Top 101 counties with the highest percentage of residents relocating from foreign countries between 2010 and 2011 (pop. 50,000+)"
- #79 on the list of "Top 101 counties with the lowest total withdrawal of fresh water for public supply (pop. 50,000+)"
- #90 on the list of "Top 101 counties with the highest percentage of residents relocating to foreign countries in 2011 (pop. 50,000+)"
- #98 on the list of "Top 101 counties with the highest percentage of residents relocating from foreign countries between 2010 and 2011"