Estimated zip code population in 2022: 4,786 Zip code population in 2010: 2,381 Zip code population in 2000: 2,030
Houses and condos: 1,873 Renter-occupied apartments: 254
% of renters here:
13%
State:
33%
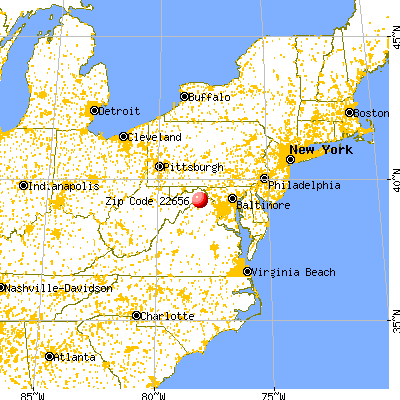
March 2022 cost of living index in zip code 22656: 88.1 (less than average, U.S. average is 100)
Land area: 8.4 sq. mi. Water area: 0.1 sq. mi.
Population density: 571 people per square mile
(low).
OSM Map
General Map
Google Map
MSN Map
OSM Map
General Map
Google Map
MSN Map
OSM Map
General Map
Google Map
MSN Map
OSM Map
General Map
Google Map
MSN Map
Please wait while loading the map...
Real estate property taxes paid for housing units in 2022:
This zip code:
0.5% ($1,854)
Virginia:
0.7% ($2,617)
Median real estate property taxes paid for housing units with mortgages in 2022: $2,040 (0.5%) Median real estate property taxes paid for housing units with no mortgage in 2022: $1,329 (0.7%)
Business Search- 14 Million verified businesses
Males: 2,259
(47.2%)
Females: 2,527
(52.8%)
For population 25 years and over in 22656:
High school or higher: 91.4%
Bachelor's degree or higher: 43.0%
Graduate or professional degree: 18.4%
Unemployed: 2.0%
Mean travel time to work (commute): 35.7 minutes
For population 15 years and over in 22656:
Never married: 17.9%
Now married: 58.2%
Separated: 2.7%
Widowed: 8.0%
Divorced: 13.2%
Zip code 22656 compared to state average:
Unemployed percentage below state average.
Black race population percentage below state average.
Hispanic race population percentage below state average.
Renting percentage significantly below state average.
Estimated median house/condo value in 2022: $377,000
22656:
$377,000
Virginia:
$365,700
According to our research of Virginia and other state lists, there were 6 registered sex offenders living in 22656 zip code as of May 23, 2024. The ratio of all residents to sex offenders in zip code 22656 is 529 to 1. The ratio of registered sex offenders to all residents in this zip code is lower than the state average.
Median resident age:
This zip code:
42.3 years
Virginia median age:
39.0 years
Average household size:
This zip code:
2.5 people
Virginia:
2.5 people
Averages for the 2020 tax year for zip code 22656, filed in 2021:
Average Adjusted Gross Income (AGI) in 2020: $84,419 (Individual Income Tax Returns)
Here:
$84,419
State:
$86,446
Salary/wage: $78,762 (reported on 86.3% of returns)
Here:
$78,762
State:
$71,185
(% of AGI for various income ranges: 1117.4% for AGIs below $25k, 3685.4% for AGIs $25k-50k, 7015.0% for AGIs $50k-75k, 9126.7% for AGIs $75k-100k, 18647.0% for AGIs $100k-200k, 46333.8% for AGIs over 200k)
Taxable interest for individuals: $952 (reported on 26.9% of returns)
This zip code:
$952
Virginia:
$1,805
(% of AGI for various income ranges: 14.9% for AGIs below $25k, 24.1% for AGIs $25k-50k, 30.4% for AGIs $50k-75k, 32.9% for AGIs $75k-100k, 52.2% for AGIs $100k-200k, 160.0% for AGIs over 200k)
Ordinary dividends: $2,772 (reported on 18.5% of returns)
Here:
$2,772
State:
$8,327
(% of AGI for various income ranges: 20.0% for AGIs below $25k, 27.1% for AGIs $25k-50k, 65.4% for AGIs $50k-75k, 56.7% for AGIs $75k-100k, 81.7% for AGIs $100k-200k, 617.5% for AGIs over 200k)
Net capital gain/loss in AGI: +$7,009 (reported on 17.3% of returns)
Here:
+$7,009
State:
+$24,644
(% of AGI for various income ranges: 10.5% for AGIs below $25k, 28.8% for AGIs $25k-50k, 20.7% for AGIs $50k-75k, 57.5% for AGIs $75k-100k, 264.1% for AGIs $100k-200k, 2150.0% for AGIs over 200k)
Profit/loss from business: +$13,507 (reported on 16.6% of returns)
Here:
+$13,507
State:
+$12,836
(% of AGI for various income ranges: 132.3% for AGIs below $25k, 167.8% for AGIs $25k-50k, 67.9% for AGIs $50k-75k, 315.8% for AGIs $75k-100k, 376.7% for AGIs $100k-200k, 2675.0% for AGIs over 200k)
Taxable individual retirement arrangement distribution: $15,810 (reported on 7.7% of returns)
22656:
$15,810
Virginia:
$21,535
(% of AGI for various income ranges: 54.7% for AGIs below $25k, 79.0% for AGIs $25k-50k, 169.3% for AGIs $50k-75k, 235.8% for AGIs $75k-100k, 374.1% for AGIs $100k-200k)
Total itemized deductions: $26,389 (reported on 17.0% of returns)
Here:
$26,389
State:
$33,287
(% of AGI for various income ranges: 143.2% for AGIs $25k-50k, 460.4% for AGIs $50k-75k, 606.7% for AGIs $75k-100k, 1281.1% for AGIs $100k-200k, 3642.5% for AGIs over 200k)
Charity contributions: $6,875 (reported on 11.8% of returns)
Here:
$6,875
State:
$10,381
(% of AGI for various income ranges: 87.1% for AGIs $50k-75k, 76.2% for AGIs $75k-100k, 204.8% for AGIs $100k-200k, 1038.8% for AGIs over 200k)
Taxes paid: $7,757 (reported on 17.0% of returns)
22656:
$7,757
State:
$8,284
(% of AGI for various income ranges: 26.3% for AGIs $25k-50k, 105.7% for AGIs $50k-75k, 183.8% for AGIs $75k-100k, 432.2% for AGIs $100k-200k, 918.8% for AGIs over 200k)
Earned income credit: $2,055 (reported on 10.7% of returns)
Here:
$2,055
State:
$2,214
(% of AGI for various income ranges: 71.6% for AGIs below $25k, 70.2% for AGIs $25k-50k)
Percentage of individuals using paid preparers for their 2020 taxes: 94.1%
Here:
94%
State:
92%
(% for various income ranges: 93.2% for AGIs below $25k, 94.1% for AGIs $25k-50k, 94.7% for AGIs $50k-75k, 93.8% for AGIs $75k-100k, 94.6% for AGIs $100k-200k, 94.1% for AGIs over 200k)
Averages for the 2012 tax year for zip code 22656, filed in 2013:
Average Adjusted Gross Income (AGI) in 2012: $58,312 (Individual Income Tax Returns)
Here:
$58,312
State:
$71,192
Salary/wage: $53,248 (reported on 89.0% of returns)
Here:
$53,248
State:
$59,229
(% of AGI for various income ranges: 79.0% for AGIs below $25k, 82.2% for AGIs $25k-50k, 83.0% for AGIs $50k-75k, 80.6% for AGIs $75k-100k, 81.8% for AGIs $100k-200k, 78.4% for AGIs over 200k)
Taxable interest for individuals: $876 (reported on 30.8% of returns)
This zip code:
$876
Virginia:
$1,600
(% of AGI for various income ranges: 1.2% for AGIs below $25k, 0.5% for AGIs $25k-50k, 0.2% for AGIs $50k-75k, 0.4% for AGIs $75k-100k, 0.5% for AGIs $100k-200k, 0.2% for AGIs over 200k)
Ordinary dividends: $1,712 (reported on 17.8% of returns)
Here:
$1,712
State:
$6,959
(% of AGI for various income ranges: 0.9% for AGIs below $25k, 0.3% for AGIs $25k-50k, 0.3% for AGIs $50k-75k, 0.3% for AGIs $75k-100k, 0.8% for AGIs $100k-200k)
Net capital gain/loss in AGI: +$2,200 (reported on 11.6% of returns)
Here:
+$2,200
State:
+$16,672
(% of AGI for various income ranges: 0.8% for AGIs $25k-50k, 0.2% for AGIs $50k-75k, 0.2% for AGIs $75k-100k, 0.7% for AGIs $100k-200k)
Profit/loss from business: +$10,035 (reported on 15.8% of returns)
Here:
+$10,035
State:
+$14,116
(% of AGI for various income ranges: 5.0% for AGIs below $25k, 5.7% for AGIs $25k-50k, 2.2% for AGIs $50k-75k, 1.6% for AGIs $75k-100k, 2.6% for AGIs $100k-200k)
Taxable individual retirement arrangement distribution: $13,550 (reported on 8.2% of returns)
22656:
$13,550
Virginia:
$16,667
(% of AGI for various income ranges: 2.5% for AGIs below $25k, 2.0% for AGIs $25k-50k, 2.0% for AGIs $50k-75k, 2.2% for AGIs $75k-100k, 2.1% for AGIs $100k-200k)
Total itemized deductions: $21,951 (22% of AGI, reported on 37.7% of returns)
Here:
$21,951
State:
$26,596
Here:
21.7% of AGI
State:
20.1% of AGI
(% of AGI for various income ranges: 6.6% for AGIs below $25k, 9.0% for AGIs $25k-50k, 13.7% for AGIs $50k-75k, 18.9% for AGIs $75k-100k, 15.7% for AGIs $100k-200k, 14.2% for AGIs over 200k)
Charity contributions: $3,425 (reported on 27.4% of returns)
Here:
$3,425
State:
$4,443
(% of AGI for various income ranges: 0.7% for AGIs $25k-50k, 1.1% for AGIs $50k-75k, 1.9% for AGIs $75k-100k, 2.2% for AGIs $100k-200k, 2.0% for AGIs over 200k)
Taxes paid: $7,233 (reported on 37.0% of returns)
22656:
$7,233
State:
$9,951
(% of AGI for various income ranges: 1.0% for AGIs below $25k, 1.8% for AGIs $25k-50k, 3.7% for AGIs $50k-75k, 5.1% for AGIs $75k-100k, 5.8% for AGIs $100k-200k, 6.5% for AGIs over 200k)
Earned income credit: $1,915 (reported on 13.7% of returns)
Here:
$1,915
State:
$2,211
(% of AGI for various income ranges: 4.7% for AGIs below $25k, 0.8% for AGIs $25k-50k)
Percentage of individuals using paid preparers for their 2012 taxes: 46.6%
Here:
47%
State:
46%
(% for various income ranges: 42.0% for AGIs below $25k, 48.4% for AGIs $25k-50k, 50.0% for AGIs $50k-75k, 46.7% for AGIs $75k-100k, 56.0% for AGIs $100k-200k)
Averages for the 2004 tax year for zip code 22656, filed in 2005:
Average Adjusted Gross Income (AGI) in 2004: $42,230 (Individual Income Tax Returns)
Here:
$42,230
State:
$56,704
Salary/wage: $38,038 (reported on 88.5% of returns)
Here:
$38,038
State:
$48,441
(% of AGI for various income ranges: 103.5% for AGIs below $10k, 79.5% for AGIs $10k-25k, 87.9% for AGIs $25k-50k, 83.9% for AGIs $50k-75k, 74.9% for AGIs $75k-100k, 70.9% for AGIs over 100k)
Taxable interest for individuals: $929 (reported on 36.7% of returns)
This zip code:
$929
Virginia:
$1,688
(% of AGI for various income ranges: 3.3% for AGIs below $10k, 1.7% for AGIs $10k-25k, 0.7% for AGIs $25k-50k, 0.6% for AGIs $50k-75k, 0.6% for AGIs $75k-100k, 0.7% for AGIs over 100k)
Taxable dividends: $1,349 (reported on 16.1% of returns)
Here:
$1,349
State:
$4,028
(% of AGI for various income ranges: 0.2% for AGIs below $10k, 0.7% for AGIs $10k-25k, 0.1% for AGIs $25k-50k, 0.6% for AGIs $50k-75k, 0.5% for AGIs $75k-100k, 0.7% for AGIs over 100k)
Net capital gain/loss: +$7,763 (reported on 11.0% of returns)
Here:
+$7,763
State:
+$14,375
(% of AGI for various income ranges: -0.8% for AGIs below $10k, -0.2% for AGIs $10k-25k, 0.1% for AGIs $25k-50k, -0.0% for AGIs $50k-75k, 1.2% for AGIs $75k-100k, 6.5% for AGIs over 100k)
Profit/loss from business: +$8,636 (reported on 12.8% of returns)
Here:
+$8,636
State:
+$13,342
(% of AGI for various income ranges: 5.4% for AGIs below $10k, 3.4% for AGIs $10k-25k, 2.9% for AGIs $25k-50k, 3.0% for AGIs $50k-75k, 2.5% for AGIs $75k-100k, 1.7% for AGIs over 100k)
IRA payment deduction: $3,133 (reported on 1.5% of returns)
22656:
$3,133
Virginia:
$2,943
Total itemized deductions: $17,292 (20% of AGI, reported on 26.5% of returns)
Here:
$17,292
State:
$21,492
Here:
20.3% of AGI
State:
21.0% of AGI
(% of AGI for various income ranges: 4.7% for AGIs $10k-25k, 8.1% for AGIs $25k-50k, 12.6% for AGIs $50k-75k, 15.2% for AGIs $75k-100k, 12.1% for AGIs over 100k)
Charity contributions deductions: $2,481 (3% of AGI, reported on 22.7% of returns)
Here:
$2,481
State:
$3,794
Here:
2.8% of AGI
State:
3.5% of AGI
(% of AGI for various income ranges: 0.7% for AGIs below $10k, 1.0% for AGIs $25k-50k, 1.0% for AGIs $50k-75k, 2.2% for AGIs $75k-100k, 1.8% for AGIs over 100k)
Total tax: $5,671 (reported on 76.7% of returns)
22656:
$5,671
State:
$9,537
(% of AGI for various income ranges: 1.9% for AGIs below $10k, 4.1% for AGIs $10k-25k, 7.3% for AGIs $25k-50k, 8.3% for AGIs $50k-75k, 10.8% for AGIs $75k-100k, 16.5% for AGIs over 100k)
Earned income credit: $1,521 (reported on 13.7% of returns)
Here:
$1,521
State:
$1,734
Percentage of individuals using paid preparers for their 2004 taxes: 59.2%
Here:
59%
State:
52%
(% for various income ranges: 49.8% for AGIs below $10k, 61.4% for AGIs $10k-25k, 60.3% for AGIs $25k-50k, 61.3% for AGIs $50k-75k, 63.3% for AGIs $75k-100k, 65.8% for AGIs over 100k)
Household received Food Stamps/SNAP in the past 12 months: 94 Household did not receive Food Stamps/SNAP in the past 12 months: 1,773
Women who had a birth in the past 12 months: 30 (31 now married, 0 unmarried) Women who did not have a birth in the past 12 months: 1,036 (580 now married, 451 unmarried)
Housing units in zip code 22656 with a mortgage: 1,060 (92 second mortgage, 60 both second mortgage and home equity loan) Houses without a mortgage: 39
Median monthly owner costs for units with a mortgage: $1,832 Median monthly owner costs for units without a mortgage: $427
Residents with income below the poverty level in 2022:
This zip code:
3.8%
Whole state:
10.6%
Residents with income below 50% of the poverty level in 2022:
This zip code:
1.0%
Whole state:
5.2%
Median number of rooms in houses and condos:
Here:
6.9
State:
7.0
Median number of rooms in apartments:
Here:
6.1
State:
4.3
Notable locations in this zip code not listed on our city pages
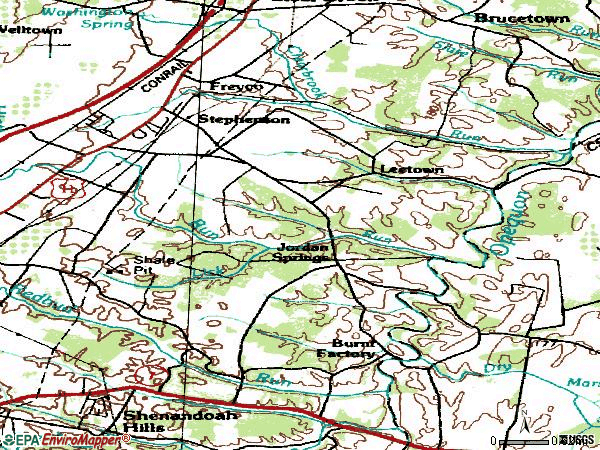
Streams, rivers, and creeks: Abrams Creek (A), Redbud Run (B), Lick Run (C), Hot Run (D), Hiatt Run (E), Clearbrook Run (F). Display/hide their locations on the map
Size of family households: 782 2-persons, 351 3-persons, 241 4-persons, 124 5-persons, 16 6-persons, 3 7-or-more-persons
Size of nonfamily households: 257 1-person, 98 2-persons
498 married couples with children.
450 single-parent households (255 men, 195 women).
87.5% of residents of 22656 zip code speak English at home.
5.0% of residents speak Spanish at home (93% very well, 3% well, 5% not well).
4.9% of residents speak other Indo-European language at home (93% very well, 7% well).
2.5% of residents speak Asian or Pacific Island language at home (100% very well).
Foreign born population: 555 (11.6%) (84.4% of them are naturalized citizens)
This zip code:
11.6%
Whole state:
12.7%
26%Bhutan
15%Malaysia
9%Uruguay
7%Austria
6%Singapore
6%Haiti
5%Costa Rica
19%American
10%English
8%German
6%European
5%Irish
4%Jamaican
4%Polish
Year of entry for the foreign-born population
1582010 or later
2212000 to 2009
1151990 to 1999
189Before 1990
Facilities with environmental interests located in this zip code:
ALLIED WOOD PRODUCTS INC (2546-1 MARTINSBURG PIKE in STEPHENSON, VA)
AIR SYNTHETIC MINOR (AIRS/AFS) STATE MASTER (Virginia pollutants databases) - CEDS-81068, AIR PROGRAM CRITERIA AND HAZARDOUS AIR POLLUTANT INVENTORY (Inventory of air pollution sources) Business SIC classification: SAWMILLS AND PLANING MILLS, GENERAL Business NAICS classification: CUT STOCK, RESAWING LUMBER, AND PLANING.
APAC-VIRGINIA INC - STEPHENSON (INTERSECTION OF U.S. 11 & in STEPHENSON, VA)
National Pollutant Discharge Elimination System NON-MAJOR (Tracking pollutant discharge elimination systems) - permit Business SIC classification: SEWERAGE SYSTEMS
APAC VA LF FRANKLIN & SONS (2786 MARTINSBURG PIKE in STEPHENSON, VA)
Conditionally Exempt Small Quantity Generators, less than 100 kg/month of hazardous waste (Resource Conservation and Recovery Act (tracking hazardous waste)) - notification Organizations: APAC VA INC (CONTACT/OWNER)
42.3%Utility gas
39.8%Electricity
7.5%Bottled, tank, or LP gas
5.3%Wood
3.4%Fuel oil, kerosene, etc.
1.9%Other fuel
Population in 1990: 2,721.
Place of birth for U.S.-born residents:
This state: 1,910
Northeast: 529
Midwest: 149
South: 1,194
West: 319
65% of the 22656 zip code residents lived in the same house 5 years ago. Out of people who lived in different houses, 54% lived in this county. Out of people who lived in different counties, 50% lived in Virginia.
93% of the 22656 zip code residents lived in the same house 1 year ago. Out of people who lived in different houses, 36% moved from this county. Out of people who lived in different houses, 49% moved from different county within same state. Out of people who lived in different houses, 17% moved from different state.
Private vs. public school enrollment:
Students in private schools in grades 1 to 8 (elementary and middle school): 58
Here:
11.7%
Virginia:
13.2%
Students in private schools in grades 9 to 12 (high school): 28
Here:
11.4%
Virginia:
10.2%
Students in private undergraduate colleges:
Here:
0.0%
Virginia:
18.7%
Occupation by median earnings in the past 12 months ($)
120,427Law enforcement workers including supervisors
120,002Computer and mathematical occupations
98,465Management occupations
83,640Business and financial operations occupations
73,083Architecture and engineering occupations
71,571Installation, maintenance, and repair occupations
Companies with federal contracts located in this zip code:
IVES EQUIPMENT CORPORATION (566 DEVILS BACKBONE OVLK in STEPHENSON, VA; small business) : $157,441 in 6 contractsfrom 2005 to 2006
Contracts for Liquid and Gas Flow, Liquid Level, and Mechanical Motion Measuring Instruments by Defense Logistics Agency Signed by year:2000: $0; 2001: $0; 2002: $0; 2003: $0; 2004: $0; 2005: $120,634; 2006: $36,807.
Biggest contracts:
$46,460 with Defense Logistics Agency for Liquid and Gas Flow, Liquid Level, and Mechanical Motion Measuring Instruments. Taking place in PA. Signed on 2005-07-06. Completion date: 2005-11-22.
$36,807 with Defense Logistics Agency for Liquid and Gas Flow, Liquid Level, and Mechanical Motion Measuring Instruments. Signed on 2006-04-13. Completion date: 2006-07-04.
$28,200, same as above.Signed on 2005-11-23. Completion date: 2006-02-05.
$21,300, same as above.Signed on 2005-03-10. Completion date: 2005-05-11.
Top industries in this zip code by the number of employees in 2005:
Administrative and Support and Waste Management and Remediation Services: Court Reporting and Stenotype Services (20-49 employees: 1 establishment)
Construction: Site Preparation Contractors (10-19: 1)
Construction: Commercial and Institutional Building Construction (10-19: 1)
Construction: Water and Sewer Line and Related Structures Construction (5-9: 2)
Construction: Painting and Wall Covering Contractors (5-9: 1, 1-4: 2)
Construction: New Single-Family Housing Construction (except Operative Builders) (5-9: 1)
Other Services (except Public Administration): Religious Organizations (1-4: 2)
Construction: Residential Remodelers (1-4: 2)
Fatal accident statistics in 2012:
Fatal accident count: 1
Vehicles involved in fatal accidents: 2
Fatal accidents caused by drunken drivers: 1
Fatalities: 1
Persons involved in fatal accidents: 2
Pedestrians involved in fatal accidents: 0
Home Mortgage Disclosure Act Aggregated Statistics For Year 2009 (Based on 4 partial tracts)
A) FHA, FSA/RHS & VA Home Purchase Loans
B) Conventional Home Purchase Loans
C) Refinancings
D) Home Improvement Loans
F) Non-occupant Loans on < 5 Family Dwellings (A B C & D)
G) Loans On Manufactured Home Dwelling (A B C & D)
Number
Average Value
Number
Average Value
Number
Average Value
Number
Average Value
Number
Average Value
Number
Average Value
LOANS ORIGINATED
46
$211,158
28
$157,906
111
$208,709
6
$65,608
11
$219,897
9
$51,353
APPLICATIONS APPROVED, NOT ACCEPTED
1
$74,790
4
$125,155
6
$195,435
0
$0
2
$67,535
3
$55,330
APPLICATIONS DENIED
6
$244,843
12
$79,477
40
$226,582
4
$62,038
2
$78,440
11
$45,505
APPLICATIONS WITHDRAWN
7
$205,427
3
$210,317
26
$221,656
1
$27,980
2
$224,960
1
$63,920
FILES CLOSED FOR INCOMPLETENESS
1
$110,060
0
$0
4
$204,768
0
$0
0
$0
0
$0
Aggregated Statistics For Year 2008 (Based on 4 partial tracts)
A) FHA, FSA/RHS & VA Home Purchase Loans
B) Conventional Home Purchase Loans
C) Refinancings
D) Home Improvement Loans
F) Non-occupant Loans on < 5 Family Dwellings (A B C & D)
G) Loans On Manufactured Home Dwelling (A B C & D)
Number
Average Value
Number
Average Value
Number
Average Value
Number
Average Value
Number
Average Value
Number
Average Value
LOANS ORIGINATED
34
$263,936
41
$176,800
72
$187,819
12
$82,442
11
$171,458
13
$73,156
APPLICATIONS APPROVED, NOT ACCEPTED
2
$159,680
7
$183,474
10
$185,371
2
$96,035
1
$16,540
4
$68,718
APPLICATIONS DENIED
6
$237,777
17
$149,570
63
$210,023
7
$71,570
4
$162,008
12
$49,239
APPLICATIONS WITHDRAWN
7
$277,837
6
$209,798
22
$256,255
1
$78,680
1
$187,670
2
$85,535
FILES CLOSED FOR INCOMPLETENESS
0
$0
1
$244,590
8
$250,642
1
$16,560
1
$189,950
0
$0
Aggregated Statistics For Year 2007 (Based on 4 partial tracts)
A) FHA, FSA/RHS & VA Home Purchase Loans
B) Conventional Home Purchase Loans
C) Refinancings
D) Home Improvement Loans
F) Non-occupant Loans on < 5 Family Dwellings (A B C & D)
G) Loans On Manufactured Home Dwelling (A B C & D)
Number
Average Value
Number
Average Value
Number
Average Value
Number
Average Value
Number
Average Value
Number
Average Value
LOANS ORIGINATED
3
$303,507
86
$208,524
127
$203,228
22
$64,472
16
$165,721
13
$73,100
APPLICATIONS APPROVED, NOT ACCEPTED
0
$0
15
$192,038
18
$220,022
4
$94,582
2
$226,915
8
$77,851
APPLICATIONS DENIED
1
$125,260
15
$171,719
92
$227,991
11
$86,084
5
$201,370
10
$81,497
APPLICATIONS WITHDRAWN
0
$0
8
$233,591
44
$247,425
3
$204,450
2
$162,960
0
$0
FILES CLOSED FOR INCOMPLETENESS
0
$0
1
$316,510
15
$254,013
0
$0
0
$0
1
$81,190
Aggregated Statistics For Year 2006 (Based on 4 partial tracts)
A) FHA, FSA/RHS & VA Home Purchase Loans
B) Conventional Home Purchase Loans
C) Refinancings
D) Home Improvement Loans
F) Non-occupant Loans on < 5 Family Dwellings (A B C & D)
G) Loans On Manufactured Home Dwelling (A B C & D)
Number
Average Value
Number
Average Value
Number
Average Value
Number
Average Value
Number
Average Value
Number
Average Value
LOANS ORIGINATED
3
$239,700
132
$208,729
179
$198,683
29
$87,574
18
$188,591
9
$81,467
APPLICATIONS APPROVED, NOT ACCEPTED
0
$0
15
$200,713
27
$214,534
3
$137,253
2
$233,565
2
$78,880
APPLICATIONS DENIED
1
$93,690
18
$183,052
81
$233,492
12
$106,155
3
$197,963
9
$61,758
APPLICATIONS WITHDRAWN
0
$0
14
$252,456
66
$215,666
5
$286,752
5
$184,536
2
$154,620
FILES CLOSED FOR INCOMPLETENESS
0
$0
2
$178,700
16
$233,360
1
$40,100
0
$0
0
$0
Aggregated Statistics For Year 2005 (Based on 4 partial tracts)
A) FHA, FSA/RHS & VA Home Purchase Loans
B) Conventional Home Purchase Loans
C) Refinancings
D) Home Improvement Loans
F) Non-occupant Loans on < 5 Family Dwellings (A B C & D)
G) Loans On Manufactured Home Dwelling (A B C & D)
Number
Average Value
Number
Average Value
Number
Average Value
Number
Average Value
Number
Average Value
Number
Average Value
LOANS ORIGINATED
2
$192,565
178
$194,448
233
$186,355
26
$85,581
27
$171,503
16
$56,815
APPLICATIONS APPROVED, NOT ACCEPTED
0
$0
14
$183,609
29
$172,797
3
$55,867
1
$40,090
4
$53,930
APPLICATIONS DENIED
1
$72,210
42
$124,689
69
$182,381
16
$58,134
4
$168,802
28
$64,805
APPLICATIONS WITHDRAWN
1
$78,680
19
$213,357
68
$178,823
8
$130,327
3
$204,367
1
$23,560
FILES CLOSED FOR INCOMPLETENESS
0
$0
5
$163,822
13
$205,108
1
$129,400
1
$116,280
1
$26,920
Aggregated Statistics For Year 2004 (Based on 4 partial tracts)
A) FHA, FSA/RHS & VA Home Purchase Loans
B) Conventional Home Purchase Loans
C) Refinancings
D) Home Improvement Loans
F) Non-occupant Loans on < 5 Family Dwellings (A B C & D)
G) Loans On Manufactured Home Dwelling (A B C & D)
Detailed PMIC statistics for the following Tracts:0501.00
, 0511.00
2002 - 2018 National Fire Incident Reporting System (NFIRS) incidents
Based on the data from the years 2002 - 2018 the average number of fire incidents per year is 7. The highest number of reported fires - 13 took place in 2016, and the least - 3 in 2003. The data has a decreasing trend.
When looking into fire subcategories, the most reports belonged to: Structure Fires (41.3%), and Outside Fires (38.9%).
Fire incident types reported to NFIRS in Zip Code 22656


 Nearest zip codes: 22624, 22601, 25413, 22611, 22603, 25446.


 Based on the data from the years 2002 - 2018 the average number of fire incidents per year is 7. The highest number of reported fires - 13 took place in 2016, and the least - 3 in 2003. The data has a decreasing trend.
 When looking into fire subcategories, the most reports belonged to: Structure Fires (41.3%), and Outside Fires (38.9%).