Estimated zip code population in 2022: 1,083 Zip code population in 2010: 1,536 Zip code population in 2000: 1,783
Houses and condos: 528 Renter-occupied apartments: 88
% of renters here:
21%
State:
33%
March 2022 cost of living index in zip code 22663: 126.3 (high, U.S. average is 100)
Land area: 22.1 sq. mi. Water area: 0.1 sq. mi.
Population density: 49 people per square mile
(very low).
OSM Map
General Map
Google Map
MSN Map
OSM Map
General Map
Google Map
MSN Map
OSM Map
General Map
Google Map
MSN Map
OSM Map
General Map
Google Map
MSN Map
Please wait while loading the map...
Real estate property taxes paid for housing units in 2022:
This zip code:
0.5% ($1,903)
Virginia:
0.7% ($2,617)
Median real estate property taxes paid for housing units with mortgages in 2022: $1,723 (0.4%) Median real estate property taxes paid for housing units with no mortgage in 2022: $2,012 (0.5%)
Business Search- 14 Million verified businesses
Males: 570
(52.6%)
Females: 513
(47.4%)
For population 25 years and over in 22663:
High school or higher: 92.5%
Bachelor's degree or higher: 27.0%
Graduate or professional degree: 9.2%
Unemployed: 3.2%
Mean travel time to work (commute): 28.8 minutes
For population 15 years and over in 22663:
Never married: 26.9%
Now married: 49.2%
Separated: 0.8%
Widowed: 14.9%
Divorced: 8.1%
Zip code 22663 compared to state average:
Black race population percentage significantly below state average.
Median age significantly above state average.
Foreign-born population percentage significantly below state average.
Renting percentage below state average.
Length of stay since moving in significantly above state average.
Averages for the 2020 tax year for zip code 22663, filed in 2021:
Average Adjusted Gross Income (AGI) in 2020: $67,201 (Individual Income Tax Returns)
Here:
$67,201
State:
$86,446
Salary/wage: $56,872 (reported on 69.9% of returns)
Here:
$56,872
State:
$71,185
(% of AGI for various income ranges: 1162.9% for AGIs below $25k, 3594.0% for AGIs $25k-50k, 5407.8% for AGIs $50k-75k, 8342.0% for AGIs $75k-100k, 11447.8% for AGIs $100k-200k)
Taxable interest for individuals: $1,112 (reported on 34.4% of returns)
This zip code:
$1,112
Virginia:
$1,805
(% of AGI for various income ranges: 20.5% for AGIs below $25k, 27.3% for AGIs $25k-50k, 74.4% for AGIs $50k-75k, 82.0% for AGIs $75k-100k, 52.2% for AGIs $100k-200k)
Ordinary dividends: $8,450 (reported on 23.7% of returns)
Here:
$8,450
State:
$8,327
(% of AGI for various income ranges: 54.8% for AGIs below $25k, 72.7% for AGIs $25k-50k, 171.1% for AGIs $50k-75k, 166.0% for AGIs $75k-100k, 593.3% for AGIs $100k-200k)
Net capital gain/loss in AGI: +$15,185 (reported on 21.5% of returns)
Here:
+$15,185
State:
+$24,644
(% of AGI for various income ranges: 41.4% for AGIs below $25k, 95.3% for AGIs $25k-50k, 460.0% for AGIs $75k-100k, 607.8% for AGIs $100k-200k)
Profit/loss from business: +$12,044 (reported on 19.4% of returns)
Here:
+$12,044
State:
+$12,836
(% of AGI for various income ranges: 329.5% for AGIs below $25k, 200.0% for AGIs $25k-50k, 731.1% for AGIs $50k-75k, 575.6% for AGIs $100k-200k)
Taxable individual retirement arrangement distribution: $17,750 (reported on 12.9% of returns)
22663:
$17,750
Virginia:
$21,535
(% of AGI for various income ranges: 165.7% for AGIs below $25k, 496.7% for AGIs $50k-75k, 1483.3% for AGIs $100k-200k)
Total itemized deductions: $29,925 (reported on 12.9% of returns)
Here:
$29,925
State:
$33,287
(% of AGI for various income ranges: 251.4% for AGIs below $25k, 683.3% for AGIs $50k-75k, 1611.1% for AGIs $100k-200k)
Charity contributions: $9,525 (reported on 8.6% of returns)
Here:
$9,525
State:
$10,381
(% of AGI for various income ranges: 145.6% for AGIs $50k-75k, 701.1% for AGIs $100k-200k)
Taxes paid: $7,336 (reported on 11.8% of returns)
22663:
$7,336
State:
$8,284
(% of AGI for various income ranges: 39.0% for AGIs below $25k, 182.2% for AGIs $50k-75k, 401.1% for AGIs $100k-200k)
Earned income credit: $2,227 (reported on 11.8% of returns)
Here:
$2,227
State:
$2,214
(% of AGI for various income ranges: 86.7% for AGIs below $25k, 42.0% for AGIs $25k-50k)
Percentage of individuals using paid preparers for their 2020 taxes: 90.3%
Here:
90%
State:
92%
(% for various income ranges: 85.3% for AGIs below $25k, 95.0% for AGIs $25k-50k, 100.0% for AGIs $50k-75k, 87.5% for AGIs $75k-100k, 92.9% for AGIs $100k-200k, 80.0% for AGIs over 200k)
Averages for the 2012 tax year for zip code 22663, filed in 2013:
Average Adjusted Gross Income (AGI) in 2012: $56,700 (Individual Income Tax Returns)
Here:
$56,700
State:
$71,192
Salary/wage: $47,274 (reported on 82.4% of returns)
Here:
$47,274
State:
$59,229
(% of AGI for various income ranges: 74.3% for AGIs below $25k, 84.0% for AGIs $25k-50k, 71.0% for AGIs $50k-75k, 81.2% for AGIs $75k-100k, 76.2% for AGIs $100k-200k, 46.5% for AGIs over 200k)
Taxable interest for individuals: $995 (reported on 28.4% of returns)
This zip code:
$995
Virginia:
$1,600
(% of AGI for various income ranges: 0.5% for AGIs below $25k, 0.6% for AGIs $25k-50k, 1.5% for AGIs $50k-75k, 0.3% for AGIs $100k-200k, 0.3% for AGIs over 200k)
Ordinary dividends: $6,779 (reported on 18.9% of returns)
Here:
$6,779
State:
$6,959
(% of AGI for various income ranges: 1.5% for AGIs below $25k, 1.1% for AGIs $25k-50k, 2.4% for AGIs $50k-75k, 7.3% for AGIs $100k-200k)
Net capital gain/loss in AGI: +$12,036 (reported on 14.9% of returns)
Here:
+$12,036
State:
+$16,672
(% of AGI for various income ranges: 1.4% for AGIs below $25k, 6.9% for AGIs $50k-75k, 9.3% for AGIs $100k-200k)
Profit/loss from business: +$10,600 (reported on 21.6% of returns)
Here:
+$10,600
State:
+$14,116
(% of AGI for various income ranges: 17.2% for AGIs below $25k, 3.7% for AGIs $25k-50k, 2.1% for AGIs $50k-75k, 7.1% for AGIs $100k-200k)
Taxable individual retirement arrangement distribution: $7,450 (reported on 5.4% of returns)
22663:
$7,450
Virginia:
$16,667
Total itemized deductions: $24,180 (22% of AGI, reported on 33.8% of returns)
Here:
$24,180
State:
$26,596
Here:
21.8% of AGI
State:
20.1% of AGI
(% of AGI for various income ranges: 10.1% for AGIs below $25k, 10.4% for AGIs $25k-50k, 14.8% for AGIs $50k-75k, 16.4% for AGIs $75k-100k, 17.2% for AGIs $100k-200k, 14.7% for AGIs over 200k)
Charity contributions: $5,406 (reported on 24.3% of returns)
Here:
$5,406
State:
$4,443
(% of AGI for various income ranges: 3.0% for AGIs below $25k, 2.6% for AGIs $50k-75k, 2.0% for AGIs $75k-100k, 3.5% for AGIs $100k-200k, 2.4% for AGIs over 200k)
Taxes paid: $7,628 (reported on 33.8% of returns)
22663:
$7,628
State:
$9,951
(% of AGI for various income ranges: 1.4% for AGIs below $25k, 2.0% for AGIs $25k-50k, 4.0% for AGIs $50k-75k, 5.0% for AGIs $75k-100k, 6.2% for AGIs $100k-200k, 5.7% for AGIs over 200k)
Earned income credit: $2,382 (reported on 14.9% of returns)
Here:
$2,382
State:
$2,211
(% of AGI for various income ranges: 4.8% for AGIs below $25k, 1.1% for AGIs $25k-50k)
Percentage of individuals using paid preparers for their 2012 taxes: 62.2%
Here:
62%
State:
46%
(% for various income ranges: 59.4% for AGIs below $25k, 70.6% for AGIs $25k-50k, 66.7% for AGIs $50k-75k, 50.0% for AGIs $75k-100k, 57.1% for AGIs $100k-200k, 66.7% for AGIs over 200k)
Averages for the 2004 tax year for zip code 22663, filed in 2005:
Average Adjusted Gross Income (AGI) in 2004: $48,095 (Individual Income Tax Returns)
Here:
$48,095
State:
$56,704
Salary/wage: $42,262 (reported on 84.4% of returns)
Here:
$42,262
State:
$48,441
(% of AGI for various income ranges: 110.2% for AGIs below $10k, 80.9% for AGIs $10k-25k, 87.4% for AGIs $25k-50k, 77.5% for AGIs $50k-75k, 77.4% for AGIs $75k-100k, 62.4% for AGIs over 100k)
Taxable interest for individuals: $1,573 (reported on 39.7% of returns)
This zip code:
$1,573
Virginia:
$1,688
(% of AGI for various income ranges: 2.4% for AGIs below $10k, 1.8% for AGIs $10k-25k, 1.3% for AGIs $25k-50k, 0.7% for AGIs $50k-75k, 0.9% for AGIs $75k-100k, 1.5% for AGIs over 100k)
Taxable dividends: $3,651 (reported on 23.0% of returns)
Here:
$3,651
State:
$4,028
(% of AGI for various income ranges: 1.3% for AGIs below $10k, 2.7% for AGIs $10k-25k, 1.5% for AGIs $25k-50k, 0.9% for AGIs $50k-75k, 0.7% for AGIs $75k-100k, 2.4% for AGIs over 100k)
Net capital gain/loss: +$28,852 (reported on 16.4% of returns)
Here:
+$28,852
State:
+$14,375
(% of AGI for various income ranges: 0.0% for AGIs $10k-25k, 0.3% for AGIs $25k-50k, 1.9% for AGIs $50k-75k, 1.4% for AGIs $75k-100k, 23.4% for AGIs over 100k)
Profit/loss from business: +$7,190 (reported on 17.6% of returns)
Here:
+$7,190
State:
+$13,342
(% of AGI for various income ranges: 19.7% for AGIs below $10k, 5.3% for AGIs $10k-25k, 2.4% for AGIs $25k-50k, 4.5% for AGIs $50k-75k, 0.9% for AGIs $75k-100k, 1.4% for AGIs over 100k)
IRA payment deduction: $3,882 (reported on 2.6% of returns)
22663:
$3,882
Virginia:
$2,943
Total itemized deductions: $19,332 (21% of AGI, reported on 33.3% of returns)
Here:
$19,332
State:
$21,492
Here:
21.4% of AGI
State:
21.0% of AGI
(% of AGI for various income ranges: 9.2% for AGIs $10k-25k, 10.6% for AGIs $25k-50k, 13.5% for AGIs $50k-75k, 19.7% for AGIs $75k-100k, 13.6% for AGIs over 100k)
Charity contributions deductions: $3,519 (4% of AGI, reported on 27.7% of returns)
Here:
$3,519
State:
$3,794
Here:
3.6% of AGI
State:
3.5% of AGI
(% of AGI for various income ranges: 0.2% for AGIs $10k-25k, 1.1% for AGIs $25k-50k, 1.6% for AGIs $50k-75k, 3.3% for AGIs $75k-100k, 2.6% for AGIs over 100k)
Total tax: $7,333 (reported on 75.0% of returns)
22663:
$7,333
State:
$9,537
(% of AGI for various income ranges: 3.7% for AGIs below $10k, 4.0% for AGIs $10k-25k, 6.7% for AGIs $25k-50k, 8.7% for AGIs $50k-75k, 9.7% for AGIs $75k-100k, 17.5% for AGIs over 100k)
Earned income credit: $1,793 (reported on 13.9% of returns)
Here:
$1,793
State:
$1,734
Percentage of individuals using paid preparers for their 2004 taxes: 62.9%
Here:
63%
State:
52%
(% for various income ranges: 60.8% for AGIs below $10k, 61.7% for AGIs $10k-25k, 62.7% for AGIs $25k-50k, 63.7% for AGIs $50k-75k, 62.7% for AGIs $75k-100k, 69.1% for AGIs over 100k)
Household received Food Stamps/SNAP in the past 12 months: 39 Household did not receive Food Stamps/SNAP in the past 12 months: 392
Women who had a birth in the past 12 months: 57 (39 now married, 17 unmarried) Women who did not have a birth in the past 12 months: 89 (40 now married, 48 unmarried)
Housing units in zip code 22663 with a mortgage: 114 (13 second mortgage, 13 both second mortgage and home equity loan) Median monthly owner costs for units with a mortgage: $1,556 Median monthly owner costs for units without a mortgage: $466
Residents with income below the poverty level in 2022:
This zip code:
19.5%
Whole state:
10.6%
Residents with income below 50% of the poverty level in 2022:
This zip code:
4.4%
Whole state:
5.2%
Median number of rooms in houses and condos:
Here:
6.3
State:
7.0
Median number of rooms in apartments:
Here:
3.1
State:
4.3
Notable locations in this zip code not listed on our city pages
Notable locations in zip code 22663: White Post Dairy (A), Oak Hill Silk Farm (B), Sugar Hill (C), Stone Bridge (D), Double Tollgate (E), State Prison Camp Number 7 (F), Tuleyries Estate (G), Soldiers Retreat Estate (H), Providence Estate (I), Poplar Hill Estate (J), Mountain View Estate (K), Lucky Hit Estate (L), Guilford Estate (M), Federal Hill Estate (N), Farnley Estate (O). Display/hide their locations on the map
Churches in zip code 22663 include: Sacred Heart Monastery (A), Ebenezer Primitive Baptist Church (B), Greenway Southern Baptist Church (C), Mead Memorial Church (D), Mount Olive Baptist Church (E), White Post Methodist Church (F), Old Zion Church (G). Display/hide their locations on the map
In group quarters: 36 (-1 institutionalized population)
Size of family households: 116 2-persons, 59 3-persons, 24 4-persons, 42 5-persons, 10 7-or-more-persons
Size of nonfamily households: 146 1-person, 33 2-persons
42 married couples with children.
82 single-parent households (26 men, 56 women).
89.9% of residents of 22663 zip code speak English at home.
10.4% of residents speak Spanish at home (66% very well, 22% well, 11% not well).
0.1% of residents speak other Indo-European language at home (100% well).
Foreign born population: 45 (4.2%) (18.6% of them are naturalized citizens)
This zip code:
4.2%
Whole state:
12.7%
74%Honduras
9%Chile
6%Sweden
2%Cameroon
28%German
27%English
7%American
4%Irish
3%French
3%French Canadian
3%Italian
Year of entry for the foreign-born population
52010 or later
122000 to 2009
321990 to 1999
16Before 1990
Facilities with environmental interests located in this zip code:
CDA SPIRITUALITY CENTER (125 OLD KITCHEN RD in WHITE POST, VA)
National Pollutant Discharge Elimination System NON-MAJOR (Tracking pollutant discharge elimination systems) - permit Business SIC classification: ORGANIZATION HOTELS AND LODGING HOUSES, ON MEMBERSHIP BASIS Alternative names: FRANCISCAN CENTER, FRANCISCAN FRIARS
7-ELEVEN 32269 (280 STONEWALL JACKSON HIGHWAY in WHITE POST, VA)
Small Quantity Generators, between 100 kg and 1000 kg of hazardous waste/month (Resource Conservation and Recovery Act (tracking hazardous waste)) - notification Organizations: 7 ELEVEN INC (CONTACT/OWNER)
40.2%Electricity
21.3%Fuel oil, kerosene, etc.
16.5%Utility gas
14.4%Bottled, tank, or LP gas
8.4%Wood
Population in 1990: 778. Population change in the 1990s: +1,005 (+129.2%).
Place of birth for U.S.-born residents:
This state: 609
Northeast: 165
Midwest: 25
South: 161
West: 49
50% of the 22663 zip code residents lived in the same house 5 years ago. Out of people who lived in different houses, 19% lived in this county. Out of people who lived in different counties, 50% lived in Virginia.
89% of the 22663 zip code residents lived in the same house 1 year ago. Out of people who lived in different houses, 28% moved from this county. Out of people who lived in different houses, 64% moved from different county within same state. Out of people who lived in different houses, 7% moved from different state.
Private vs. public school enrollment:
Students in private schools in grades 1 to 8 (elementary and middle school): 28
Here:
25.8%
Virginia:
13.2%
Students in private schools in grades 9 to 12 (high school):
Here:
48.0%
Virginia:
10.2%
Students in private undergraduate colleges:
Here:
0.0%
Virginia:
18.7%
Occupation by median earnings in the past 12 months ($)
190,510Health diagnosing and treating practitioners and other technical occupations
61,479Management occupations
60,106Installation, maintenance, and repair occupations
38,528Material moving occupations
26,186Building and grounds cleaning and maintenance occupations
Companies with federal contracts located in this zip code:
THE PRUITT CORPORATION (RT 658 in WHITE POST, VA; small business)
$165,000 with Department of Defense for Maintenance, Repair or Alteration of Real Property -- Office Buildings. Signed on 2000-12-15. Completion date: 2001-04-01.
SHELLY''S TRUCK CAPS INC (5016 FRONT ROYAL PIKE in WHITE POST, VA; small business)
$5,113 with Army for Trailers. Signed on 2003-09-29. Completion date: 2003-10-08.
Top industries in this zip code by the number of employees in 2005:
Administrative and Support and Waste Management and Remediation Services: Landscaping Services (10-19 employees: 1 establishment)
Other Services (except Public Administration): Automotive Body, Paint, and Interior Repair and Maintenance (10-19: 1)
Educational Services: All Other Miscellaneous Schools and Instruction (5-9: 1)
Construction: Residential Remodelers (5-9: 1)
People in group quarters in 2010:
75 people in correctional residential facilities
7 people in group homes for juveniles (non-correctional)
People in group quarters in 2000:
150 people in state prisons
13 people in religious group quarters
Fatal accident statistics in 2010:
Fatal accident count: 2
Vehicles involved in fatal accidents: 2
Fatal accidents caused by drunken drivers: 1
Fatalities: 3
Persons involved in fatal accidents: 4
Pedestrians involved in fatal accidents: 0
Home Mortgage Disclosure Act Aggregated Statistics For Year 2009 (Based on 2 partial tracts)
A) FHA, FSA/RHS & VA Home Purchase Loans
B) Conventional Home Purchase Loans
C) Refinancings
D) Home Improvement Loans
F) Non-occupant Loans on < 5 Family Dwellings (A B C & D)
G) Loans On Manufactured Home Dwelling (A B C & D)
Number
Average Value
Number
Average Value
Number
Average Value
Number
Average Value
Number
Average Value
Number
Average Value
LOANS ORIGINATED
110
$201,399
54
$161,587
203
$187,881
12
$108,998
28
$153,220
2
$51,110
APPLICATIONS APPROVED, NOT ACCEPTED
9
$185,469
5
$140,226
17
$182,806
1
$20,340
1
$178,140
0
$0
APPLICATIONS DENIED
19
$198,611
12
$118,385
81
$210,566
4
$63,638
3
$208,240
8
$62,521
APPLICATIONS WITHDRAWN
9
$179,900
6
$194,842
55
$203,469
1
$208,900
3
$163,580
0
$0
FILES CLOSED FOR INCOMPLETENESS
2
$216,590
1
$152,330
17
$211,089
0
$0
1
$153,820
0
$0
Aggregated Statistics For Year 2008 (Based on 2 partial tracts)
A) FHA, FSA/RHS & VA Home Purchase Loans
B) Conventional Home Purchase Loans
C) Refinancings
D) Home Improvement Loans
F) Non-occupant Loans on < 5 Family Dwellings (A B C & D)
G) Loans On Manufactured Home Dwelling (A B C & D)
Number
Average Value
Number
Average Value
Number
Average Value
Number
Average Value
Number
Average Value
Number
Average Value
LOANS ORIGINATED
89
$219,365
84
$194,694
133
$188,929
17
$76,327
31
$144,202
1
$23,820
APPLICATIONS APPROVED, NOT ACCEPTED
3
$219,487
10
$170,693
21
$210,152
2
$32,750
4
$145,138
0
$0
APPLICATIONS DENIED
8
$229,245
14
$165,447
125
$234,214
8
$100,356
8
$156,985
5
$65,102
APPLICATIONS WITHDRAWN
7
$252,991
13
$204,396
48
$228,552
3
$196,660
5
$162,456
0
$0
FILES CLOSED FOR INCOMPLETENESS
0
$0
3
$226,597
12
$264,847
0
$0
0
$0
0
$0
Aggregated Statistics For Year 2007 (Based on 2 partial tracts)
A) FHA, FSA/RHS & VA Home Purchase Loans
B) Conventional Home Purchase Loans
C) Refinancings
D) Home Improvement Loans
E) Loans on Dwellings For 5+ Families
F) Non-occupant Loans on < 5 Family Dwellings (A B C & D)
G) Loans On Manufactured Home Dwelling (A B C & D)
Number
Average Value
Number
Average Value
Number
Average Value
Number
Average Value
Number
Average Value
Number
Average Value
Number
Average Value
LOANS ORIGINATED
15
$243,932
173
$199,220
235
$180,477
29
$85,278
1
$529,450
37
$179,973
2
$46,890
APPLICATIONS APPROVED, NOT ACCEPTED
0
$0
11
$179,038
32
$220,887
6
$162,837
0
$0
1
$241,650
2
$62,275
APPLICATIONS DENIED
1
$217,830
28
$166,883
176
$220,073
19
$94,304
0
$0
8
$240,099
9
$62,356
APPLICATIONS WITHDRAWN
0
$0
25
$186,730
70
$212,912
8
$124,360
0
$0
3
$188,227
0
$0
FILES CLOSED FOR INCOMPLETENESS
0
$0
2
$256,040
30
$222,248
1
$140,420
0
$0
0
$0
0
$0
Aggregated Statistics For Year 2006 (Based on 2 partial tracts)
A) FHA, FSA/RHS & VA Home Purchase Loans
B) Conventional Home Purchase Loans
C) Refinancings
D) Home Improvement Loans
F) Non-occupant Loans on < 5 Family Dwellings (A B C & D)
G) Loans On Manufactured Home Dwelling (A B C & D)
Number
Average Value
Number
Average Value
Number
Average Value
Number
Average Value
Number
Average Value
Number
Average Value
LOANS ORIGINATED
7
$238,530
379
$185,674
325
$186,486
40
$79,938
51
$159,786
3
$88,323
APPLICATIONS APPROVED, NOT ACCEPTED
0
$0
26
$211,190
42
$200,465
8
$70,399
4
$219,198
1
$56,570
APPLICATIONS DENIED
2
$165,980
54
$182,960
146
$204,737
25
$105,373
10
$166,227
9
$97,256
APPLICATIONS WITHDRAWN
0
$0
38
$202,084
117
$204,829
5
$98,446
8
$204,062
1
$129,010
FILES CLOSED FOR INCOMPLETENESS
0
$0
8
$238,176
23
$212,007
0
$0
0
$0
0
$0
Aggregated Statistics For Year 2005 (Based on 2 partial tracts)
A) FHA, FSA/RHS & VA Home Purchase Loans
B) Conventional Home Purchase Loans
C) Refinancings
D) Home Improvement Loans
F) Non-occupant Loans on < 5 Family Dwellings (A B C & D)
G) Loans On Manufactured Home Dwelling (A B C & D)
Number
Average Value
Number
Average Value
Number
Average Value
Number
Average Value
Number
Average Value
Number
Average Value
LOANS ORIGINATED
11
$202,089
460
$186,535
440
$183,299
46
$88,787
83
$155,006
6
$71,287
APPLICATIONS APPROVED, NOT ACCEPTED
1
$124,550
36
$162,933
45
$169,866
5
$29,276
5
$107,774
3
$65,500
APPLICATIONS DENIED
2
$177,890
43
$163,896
135
$183,888
25
$83,957
7
$167,077
9
$51,274
APPLICATIONS WITHDRAWN
1
$258,520
58
$194,408
122
$177,717
19
$121,203
10
$159,429
1
$128,520
FILES CLOSED FOR INCOMPLETENESS
0
$0
6
$178,715
23
$167,003
4
$159,778
2
$136,705
0
$0
Aggregated Statistics For Year 2004 (Based on 2 partial tracts)
A) FHA, FSA/RHS & VA Home Purchase Loans
B) Conventional Home Purchase Loans
C) Refinancings
D) Home Improvement Loans
F) Non-occupant Loans on < 5 Family Dwellings (A B C & D)
G) Loans On Manufactured Home Dwelling (A B C & D)
Detailed PMIC statistics for the following Tracts:0508.00
2002 - 2018 National Fire Incident Reporting System (NFIRS) incidents
According to the data from the years 2002 - 2018 the average number of fire incidents per year is 13. The highest number of reported fires - 27 took place in 2011, and the least - 4 in 2003. The data has a growing trend.
When looking into fire subcategories, the most reports belonged to: Outside Fires (50.9%), and Structure Fires (32.9%).
Fire incident types reported to NFIRS in Zip Code 22663

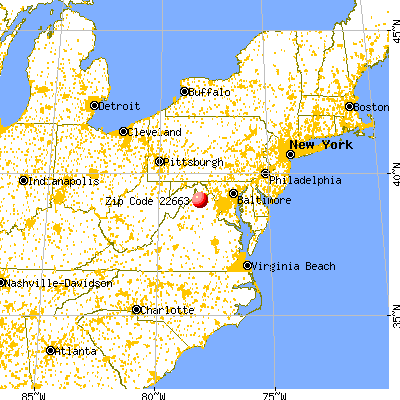


 Nearest zip codes: 22646, 22620, 22655, 22601, 22630, 22642.


 According to the data from the years 2002 - 2018 the average number of fire incidents per year is 13. The highest number of reported fires - 27 took place in 2011, and the least - 4 in 2003. The data has a growing trend.
 When looking into fire subcategories, the most reports belonged to: Outside Fires (50.9%), and Structure Fires (32.9%).