Estimated zip code population in 2022: 11,675 Zip code population in 2010: 11,634 Zip code population in 2000: 11,557
Houses and condos: 6,445 Renter-occupied apartments: 1,520
% of renters here:
30%
State:
33%
March 2022 cost of living index in zip code 22835: 85.5 (less than average, U.S. average is 100)
Land area: 150.7 sq. mi. Water area: 1.7 sq. mi.
Population density: 77 people per square mile
(very low).
OSM Map
General Map
Google Map
MSN Map
OSM Map
General Map
Google Map
MSN Map
OSM Map
General Map
Google Map
MSN Map
OSM Map
General Map
Google Map
MSN Map
Please wait while loading the map...
Real estate property taxes paid for housing units in 2022:
This zip code:
0.7% ($1,796)
Virginia:
0.7% ($2,617)
Median real estate property taxes paid for housing units with mortgages in 2022: $1,656 (0.7%) Median real estate property taxes paid for housing units with no mortgage in 2022: $1,967 (0.8%)
Estimated median house/condo value in 2022: $242,257
22835:
$242,257
Virginia:
$365,700
According to our research of Virginia and other state lists, there were 25 registered sex offenders living in 22835 zip code as of June 07, 2024. The ratio of all residents to sex offenders in zip code 22835 is 469 to 1. The ratio of registered sex offenders to all residents in this zip code is lower than the state average.
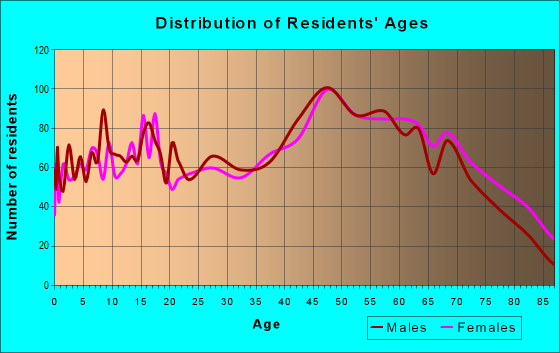
Median resident age:
This zip code:
49.2 years
Virginia median age:
39.0 years
Average household size:
This zip code:
2.2 people
Virginia:
2.5 people
Averages for the 2020 tax year for zip code 22835, filed in 2021:
Average Adjusted Gross Income (AGI) in 2020: $53,786 (Individual Income Tax Returns)
Here:
$53,786
State:
$86,446
Salary/wage: $44,487 (reported on 80.5% of returns)
Here:
$44,487
State:
$71,185
(% of AGI for various income ranges: 1085.5% for AGIs below $25k, 3452.1% for AGIs $25k-50k, 6014.4% for AGIs $50k-75k, 8565.0% for AGIs $75k-100k, 15719.7% for AGIs $100k-200k, 60183.3% for AGIs over 200k)
Taxable interest for individuals: $1,838 (reported on 27.1% of returns)
This zip code:
$1,838
Virginia:
$1,805
(% of AGI for various income ranges: 19.1% for AGIs below $25k, 24.6% for AGIs $25k-50k, 76.0% for AGIs $50k-75k, 71.4% for AGIs $75k-100k, 169.7% for AGIs $100k-200k, 2910.0% for AGIs over 200k)
Ordinary dividends: $4,764 (reported on 16.6% of returns)
Here:
$4,764
State:
$8,327
(% of AGI for various income ranges: 26.5% for AGIs below $25k, 33.0% for AGIs $25k-50k, 123.6% for AGIs $50k-75k, 156.7% for AGIs $75k-100k, 404.3% for AGIs $100k-200k, 2840.0% for AGIs over 200k)
Net capital gain/loss in AGI: +$12,104 (reported on 14.6% of returns)
Here:
+$12,104
State:
+$24,644
(% of AGI for various income ranges: 13.5% for AGIs below $25k, 31.4% for AGIs $25k-50k, 158.4% for AGIs $50k-75k, 276.7% for AGIs $75k-100k, 789.2% for AGIs $100k-200k, 14790.0% for AGIs over 200k)
Profit/loss from business: +$10,193 (reported on 13.2% of returns)
Here:
+$10,193
State:
+$12,836
(% of AGI for various income ranges: 83.9% for AGIs below $25k, 118.8% for AGIs $25k-50k, 164.5% for AGIs $50k-75k, 81.1% for AGIs $75k-100k, 534.9% for AGIs $100k-200k, 5290.0% for AGIs over 200k)
Taxable individual retirement arrangement distribution: $16,709 (reported on 9.8% of returns)
22835:
$16,709
Virginia:
$21,535
(% of AGI for various income ranges: 54.8% for AGIs below $25k, 108.4% for AGIs $25k-50k, 190.2% for AGIs $50k-75k, 372.8% for AGIs $75k-100k, 694.1% for AGIs $100k-200k, 6480.0% for AGIs over 200k)
Total itemized deductions: $29,430 (reported on 5.4% of returns)
Here:
$29,430
State:
$33,287
(% of AGI for various income ranges: 28.2% for AGIs below $25k, 107.4% for AGIs $25k-50k, 209.8% for AGIs $50k-75k, 358.1% for AGIs $75k-100k, 636.5% for AGIs $100k-200k, 7713.3% for AGIs over 200k)
Charity contributions: $10,505 (reported on 4.0% of returns)
Here:
$10,505
State:
$10,381
(% of AGI for various income ranges: 10.5% for AGIs $25k-50k, 43.3% for AGIs $50k-75k, 72.8% for AGIs $75k-100k, 150.8% for AGIs $100k-200k, 3753.3% for AGIs over 200k)
Taxes paid: $6,783 (reported on 5.2% of returns)
22835:
$6,783
State:
$8,284
(% of AGI for various income ranges: 4.0% for AGIs below $25k, 16.0% for AGIs $25k-50k, 36.7% for AGIs $50k-75k, 73.9% for AGIs $75k-100k, 194.9% for AGIs $100k-200k, 1750.0% for AGIs over 200k)
Earned income credit: $2,048 (reported on 17.5% of returns)
Here:
$2,048
State:
$2,214
(% of AGI for various income ranges: 82.0% for AGIs below $25k, 63.9% for AGIs $25k-50k)
Percentage of individuals using paid preparers for their 2020 taxes: 92.6%
Here:
93%
State:
92%
(% for various income ranges: 92.3% for AGIs below $25k, 93.4% for AGIs $25k-50k, 91.0% for AGIs $50k-75k, 94.3% for AGIs $75k-100k, 92.2% for AGIs $100k-200k, 90.9% for AGIs over 200k)
Averages for the 2012 tax year for zip code 22835, filed in 2013:
Average Adjusted Gross Income (AGI) in 2012: $43,820 (Individual Income Tax Returns)
Here:
$43,820
State:
$71,192
Salary/wage: $37,027 (reported on 81.7% of returns)
Here:
$37,027
State:
$59,229
(% of AGI for various income ranges: 71.5% for AGIs below $25k, 75.7% for AGIs $25k-50k, 72.9% for AGIs $50k-75k, 72.0% for AGIs $75k-100k, 66.5% for AGIs $100k-200k, 41.9% for AGIs over 200k)
Taxable interest for individuals: $1,766 (reported on 31.2% of returns)
This zip code:
$1,766
Virginia:
$1,600
(% of AGI for various income ranges: 1.7% for AGIs below $25k, 0.8% for AGIs $25k-50k, 0.9% for AGIs $50k-75k, 1.3% for AGIs $75k-100k, 1.0% for AGIs $100k-200k, 2.9% for AGIs over 200k)
Ordinary dividends: $3,458 (reported on 18.3% of returns)
Here:
$3,458
State:
$6,959
(% of AGI for various income ranges: 1.4% for AGIs below $25k, 0.8% for AGIs $25k-50k, 1.4% for AGIs $50k-75k, 1.7% for AGIs $75k-100k, 1.9% for AGIs $100k-200k, 1.5% for AGIs over 200k)
Net capital gain/loss in AGI: +$7,030 (reported on 13.3% of returns)
Here:
+$7,030
State:
+$16,672
(% of AGI for various income ranges: 0.2% for AGIs below $25k, 0.5% for AGIs $25k-50k, 0.6% for AGIs $50k-75k, 1.1% for AGIs $75k-100k, 3.6% for AGIs $100k-200k, 10.7% for AGIs over 200k)
Profit/loss from business: +$11,659 (reported on 14.1% of returns)
Here:
+$11,659
State:
+$14,116
(% of AGI for various income ranges: 6.9% for AGIs below $25k, 3.6% for AGIs $25k-50k, 1.4% for AGIs $50k-75k, 2.4% for AGIs $75k-100k, 3.0% for AGIs $100k-200k, 8.9% for AGIs over 200k)
Taxable individual retirement arrangement distribution: $10,741 (reported on 10.4% of returns)
22835:
$10,741
Virginia:
$16,667
(% of AGI for various income ranges: 2.9% for AGIs below $25k, 2.5% for AGIs $25k-50k, 2.4% for AGIs $50k-75k, 2.2% for AGIs $75k-100k, 4.1% for AGIs $100k-200k)
Total itemized deductions: $19,005 (23% of AGI, reported on 24.9% of returns)
Here:
$19,005
State:
$26,596
Here:
22.9% of AGI
State:
20.1% of AGI
(% of AGI for various income ranges: 7.1% for AGIs below $25k, 8.4% for AGIs $25k-50k, 11.2% for AGIs $50k-75k, 12.5% for AGIs $75k-100k, 13.5% for AGIs $100k-200k, 11.3% for AGIs over 200k)
Charity contributions: $3,656 (reported on 18.1% of returns)
Here:
$3,656
State:
$4,443
(% of AGI for various income ranges: 0.5% for AGIs below $25k, 0.7% for AGIs $25k-50k, 1.4% for AGIs $50k-75k, 1.9% for AGIs $75k-100k, 2.5% for AGIs $100k-200k, 1.9% for AGIs over 200k)
Taxes paid: $6,348 (reported on 24.7% of returns)
22835:
$6,348
State:
$9,951
(% of AGI for various income ranges: 1.3% for AGIs below $25k, 1.8% for AGIs $25k-50k, 3.0% for AGIs $50k-75k, 4.1% for AGIs $75k-100k, 5.2% for AGIs $100k-200k, 7.5% for AGIs over 200k)
Earned income credit: $2,020 (reported on 20.4% of returns)
Here:
$2,020
State:
$2,211
(% of AGI for various income ranges: 5.7% for AGIs below $25k, 1.1% for AGIs $25k-50k)
Percentage of individuals using paid preparers for their 2012 taxes: 56.5%
Here:
56%
State:
46%
(% for various income ranges: 52.7% for AGIs below $25k, 56.0% for AGIs $25k-50k, 61.3% for AGIs $50k-75k, 58.7% for AGIs $75k-100k, 64.7% for AGIs $100k-200k, 83.3% for AGIs over 200k)
Averages for the 2004 tax year for zip code 22835, filed in 2005:
Average Adjusted Gross Income (AGI) in 2004: $35,985 (Individual Income Tax Returns)
Here:
$35,985
State:
$56,704
Salary/wage: $30,893 (reported on 84.1% of returns)
Here:
$30,893
State:
$48,441
(% of AGI for various income ranges: 92.2% for AGIs below $10k, 76.6% for AGIs $10k-25k, 77.9% for AGIs $25k-50k, 76.2% for AGIs $50k-75k, 75.6% for AGIs $75k-100k, 49.4% for AGIs over 100k)
Taxable interest for individuals: $1,929 (reported on 37.4% of returns)
This zip code:
$1,929
Virginia:
$1,688
(% of AGI for various income ranges: 3.4% for AGIs below $10k, 2.9% for AGIs $10k-25k, 1.7% for AGIs $25k-50k, 1.3% for AGIs $50k-75k, 1.2% for AGIs $75k-100k, 3.1% for AGIs over 100k)
Taxable dividends: $3,248 (reported on 18.9% of returns)
Here:
$3,248
State:
$4,028
(% of AGI for various income ranges: 2.0% for AGIs below $10k, 1.3% for AGIs $10k-25k, 0.9% for AGIs $25k-50k, 1.2% for AGIs $50k-75k, 1.7% for AGIs $75k-100k, 3.9% for AGIs over 100k)
Net capital gain/loss: +$9,685 (reported on 15.1% of returns)
Here:
+$9,685
State:
+$14,375
(% of AGI for various income ranges: 0.1% for AGIs below $10k, 0.7% for AGIs $10k-25k, 0.9% for AGIs $25k-50k, 1.5% for AGIs $50k-75k, 3.2% for AGIs $75k-100k, 16.2% for AGIs over 100k)
Profit/loss from business: +$10,971 (reported on 12.9% of returns)
Here:
+$10,971
State:
+$13,342
(% of AGI for various income ranges: 4.9% for AGIs below $10k, 4.2% for AGIs $10k-25k, 3.4% for AGIs $25k-50k, 2.1% for AGIs $50k-75k, 2.0% for AGIs $75k-100k, 8.3% for AGIs over 100k)
IRA payment deduction: $3,083 (reported on 2.1% of returns)
22835:
$3,083
Virginia:
$2,943
(% of AGI for various income ranges: 0.1% for AGIs $10k-25k, 0.2% for AGIs $25k-50k, 0.2% for AGIs $50k-75k, 0.1% for AGIs $75k-100k, 0.2% for AGIs over 100k)
Self-employed pension: $11,545 (reported on 0.4% of returns)
Here:
$11,545
Virginia:
$17,430
Total itemized deductions: $15,421 (23% of AGI, reported on 21.9% of returns)
Here:
$15,421
State:
$21,492
Here:
22.7% of AGI
State:
21.0% of AGI
(% of AGI for various income ranges: 8.2% for AGIs below $10k, 5.9% for AGIs $10k-25k, 8.0% for AGIs $25k-50k, 10.1% for AGIs $50k-75k, 12.4% for AGIs $75k-100k, 11.2% for AGIs over 100k)
Charity contributions deductions: $2,779 (4% of AGI, reported on 17.1% of returns)
Here:
$2,779
State:
$3,794
Here:
3.8% of AGI
State:
3.5% of AGI
(% of AGI for various income ranges: 0.3% for AGIs below $10k, 0.6% for AGIs $10k-25k, 0.7% for AGIs $25k-50k, 1.4% for AGIs $50k-75k, 1.8% for AGIs $75k-100k, 2.4% for AGIs over 100k)
Total tax: $4,393 (reported on 74.8% of returns)
22835:
$4,393
State:
$9,537
(% of AGI for various income ranges: 2.3% for AGIs below $10k, 4.2% for AGIs $10k-25k, 6.9% for AGIs $25k-50k, 8.8% for AGIs $50k-75k, 10.3% for AGIs $75k-100k, 17.0% for AGIs over 100k)
Earned income credit: $1,606 (reported on 16.5% of returns)
Here:
$1,606
State:
$1,734
Percentage of individuals using paid preparers for their 2004 taxes: 59.1%
Here:
59%
State:
52%
(% for various income ranges: 47.5% for AGIs below $10k, 60.7% for AGIs $10k-25k, 61.0% for AGIs $25k-50k, 62.3% for AGIs $50k-75k, 63.0% for AGIs $75k-100k, 72.6% for AGIs over 100k)
Likely homosexual households (counted as self-reported same-sex unmarried-partner households)
Lesbian couples: 0.0% of all households
Gay men: 0.3% of all households
Household received Food Stamps/SNAP in the past 12 months: 552 Household did not receive Food Stamps/SNAP in the past 12 months: 4,566
Women who had a birth in the past 12 months: 141 (74 now married, 64 unmarried) Women who did not have a birth in the past 12 months: 2,137 (700 now married, 1,445 unmarried)
Housing units in zip code 22835 with a mortgage: 1,736 (218 second mortgage, 167 both second mortgage and home equity loan) Houses without a mortgage: 42
Median monthly owner costs for units with a mortgage: $1,345 Median monthly owner costs for units without a mortgage: $464
Residents with income below the poverty level in 2022:
This zip code:
9.6%
Whole state:
10.6%
Residents with income below 50% of the poverty level in 2022:
This zip code:
6.1%
Whole state:
5.2%
Median number of rooms in houses and condos:
Here:
6.6
State:
7.0
Median number of rooms in apartments:
Here:
5.2
State:
4.3
Notable locations in this zip code not listed on our city pages
In group quarters: 213 (-1 institutionalized population)
Size of family households: 1,850 2-persons, 510 3-persons, 389 4-persons, 202 5-persons, 93 6-persons
Size of nonfamily households: 1,822 1-person, 238 2-persons, 17 5-persons
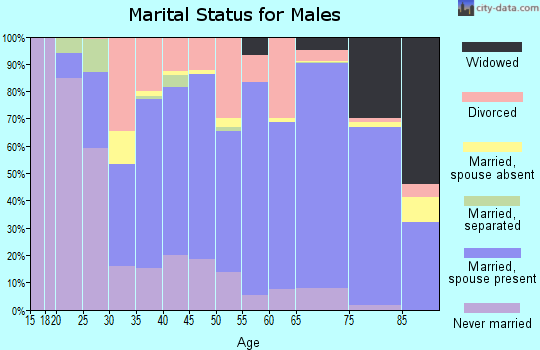
1,172 married couples with children.
382 single-parent households (65 men, 317 women).
97.1% of residents of 22835 zip code speak English at home.
1.2% of residents speak Spanish at home (41% very well, 21% well, 38% not well).
0.4% of residents speak other Indo-European language at home (100% very well).
0.4% of residents speak Asian or Pacific Island language at home (74% very well, 26% well).
1.2% of residents speak other language at home (41% very well, 59% not at all).
Foreign born population: 141 (1.2%) (32.2% of them are naturalized citizens)
This zip code:
1.2%
Whole state:
12.7%
57%United Arab Emirates
18%Bhutan
8%Czechoslovakia (includes Czech Republic and Slovakia)
7%France
7%Iraq
5%Malaysia
2%China, excluding Hong Kong and Taiwan
30%American
28%German
17%English
4%Irish
1%European
1%Norwegian
0%Polish
Year of entry for the foreign-born population
912010 or later
612000 to 2009
281990 to 1999
63Before 1990
Facilities with environmental interests located in this zip code:
BUDDY V. GOOD COMPANY, INC. (741 E MAIN STREET in LURAY, VA)
AIR MINOR (AIRS/AFS) STATE MASTER (Virginia pollutants databases) - CEDS-81400, AIR PROGRAM Business SIC classification: BROILER, FRYER, AND ROASTER CHICKENS Business NAICS classification: BROILERS AND OTHER MEAT TYPE CHICKEN PRODUCTION.
CEDAR KNOLL POULTRY (2135 MILL CREEK ROAD in LURAY, VA)
AIR MINOR (AIRS/AFS) STATE MASTER (Virginia pollutants databases) - CEDS-81419, AIR PROGRAM Business SIC classification: CHICKEN EGGS Business NAICS classification: CHICKEN EGG PRODUCTION.
BIG MEADOWS STP (SKYLINE DRIVE, MILE POST 51 in SKYLINE DRIVE, VA) . Federal Facility. NATIONAL PARK SERVICE
National Pollutant Discharge Elimination System NON-MAJOR (Tracking pollutant discharge elimination systems) - permit National Pollutant Discharge Elimination System NON-MAJOR (Tracking pollutant discharge elimination systems) - permit Business SIC classification: SEWERAGE SYSTEMS Organizations: PANORAMA SEWAGE TREATMENT PLAN (CONTACT/OWNER)
Alternative names: BIG MEADOWS WAYSIDE, PANORAMA SEWAGE TREATMENT PLAN, PANORAMA STP, PANORAMA WASTEWATER TREATMENT, U.S. SHENADOAH NATIONAL PARK
7-ELEVEN #15904 (610 EAST MAIN ST in LURAY, VA)
Small Quantity Generators, between 100 kg and 1000 kg of hazardous waste/month (Resource Conservation and Recovery Act (tracking hazardous waste)) - notification Organizations: OPERNAME (CONTACT/OPERATOR)
, SOUTHLAND CORPORATION THE (CONTACT/OWNER)
AIR CANE (RT 2 BOX 351 in LURAY, VA)
AIR MINOR (AIRS/AFS) Business SIC classification: REFRIGERATION AND AIR-CONDITIONING SERVICE AND REPAIR SHOPS
BLUE RIDGE CLNRS (13 E LURAY SHOPPING CTR in LURAY, VA)
Conditionally Exempt Small Quantity Generators, less than 100 kg/month of hazardous waste (Resource Conservation and Recovery Act (tracking hazardous waste)) Organizations: OPERNAME (CONTACT/OPERATOR)
Housing units lacking complete plumbing facilities: 3.5% Housing units lacking complete kitchen facilities: 3.8%
54.1%Electricity
20.0%Fuel oil, kerosene, etc.
11.2%Wood
10.1%Bottled, tank, or LP gas
3.7%Utility gas
0.5%Other fuel
Population in 1990: 10,559. Population change in the 1990s: +998 (+9.5%).
Place of birth for U.S.-born residents:
This state: 8,400
Northeast: 710
Midwest: 322
South: 1,577
West: 367
64% of the 22835 zip code residents lived in the same house 5 years ago. Out of people who lived in different houses, 64% lived in this county. Out of people who lived in different counties, 50% lived in Virginia.
93% of the 22835 zip code residents lived in the same house 1 year ago. Out of people who lived in different houses, 58% moved from this county. Out of people who lived in different houses, 19% moved from different county within same state. Out of people who lived in different houses, 23% moved from different state.
Private vs. public school enrollment:
Students in private schools in grades 1 to 8 (elementary and middle school): 112
Here:
15.9%
Virginia:
13.2%
Students in private schools in grades 9 to 12 (high school): 11
Here:
3.0%
Virginia:
10.2%
Students in private undergraduate colleges: 43
Here:
18.8%
Virginia:
18.7%
Occupation by median earnings in the past 12 months ($)
82,857Computer and mathematical occupations
65,975Health diagnosing and treating practitioners and other technical occupations
64,347Community and social service occupations
63,788Architecture and engineering occupations
62,134Management occupations
56,550Law enforcement workers including supervisors
Companies with federal contracts located in this zip code:
SHENANDOAH VALLEY BINDERY, LLC (320 NORTH HAWKSBILL STREET in LURAY, VA; small business) : $11,482 in 2 contractsfrom 2004 to 2005
$5,741 with Army for Library Services. Signed on 2005-02-03. Completion date: 2005-12-31.
$5,741 with Army for Print/Binding Services. Signed on 2004-03-01. Completion date: 2004-12-31.
SHENANDOAH RIVER OUTFITTERS IN (6502 S PAGE VALLEY RD in LURAY, VA; small business) : $7,200 in 2 contractsin 2004
$4,050 with Army for Chaplain Services. Signed on 2004-07-30. Completion date: 2004-07-30.
$3,150 with Army for Recreational Services. Signed on 2004-06-04. Completion date: 2004-06-01.
Top industries in this zip code by the number of employees in 2005:
Accommodation and Food Services: Hotels (except Casino Hotels) and Motels (50-99: 1, 20-49: 3, 10-19: 1, 5-9: 1, 1-4: 5)
Administrative and Support and Waste Management and Remediation Services: Landscaping Services (100-249: 1, 1-4: 8)
Arts, Entertainment, and Recreation: Nature Parks and Other Similar Institutions (100-249: 1, 1-4: 1)
Construction: Highway, Street, and Bridge Construction (100-249: 1, 1-4: 1)
Health Care and Social Assistance: General Medical and Surgical Hospitals (100-249: 1)
Health Care and Social Assistance: Nursing Care Facilities (100-249: 1)
People in group quarters in 2010:
107 people in nursing facilities/skilled-nursing facilities
75 people in local jails and other municipal confinement facilities
6 people in other noninstitutional facilities
People in group quarters in 2000:
96 people in wards in general hospitals for patients who have no usual home elsewhere
95 people in nursing homes
36 people in local jails and other confinement facilities (including police lockups)
19 people in other noninstitutional group quarters
2002 - 2018 National Fire Incident Reporting System (NFIRS) incidents
Based on the data from the years 2002 - 2018 the average number of fires per year is 32. The highest number of reported fires - 93 took place in 2007, and the least - 1 in 2004. The data has a rising trend.
When looking into fire subcategories, the most incidents belonged to: Structure Fires (41.5%), and Outside Fires (40.1%).
Fire incident types reported to NFIRS in Zip Code 22835


 Nearest zip codes: 22851, 22650, 22743, 22740, 22652, 22844.


 Based on the data from the years 2002 - 2018 the average number of fires per year is 32. The highest number of reported fires - 93 took place in 2007, and the least - 1 in 2004. The data has a rising trend.
 When looking into fire subcategories, the most incidents belonged to: Structure Fires (41.5%), and Outside Fires (40.1%).