Page County, Virginia (VA)
County owner-occupied free and clear houses and condos in 2010: 3,031
County owner-occupied houses and condos in 2000: 6,877
Renter-occupied apartments: 2,661 (it was 2,428 in 2000)
| % of renters here: | 26% |
| State: | 33% |
Land area: 311 sq. mi.
Water area: 3.0 sq. mi.
Population density: 77 people per square mile (average).
Industries providing employment: Educational, health and social services (21.5%), Manufacturing (14.6%), Retail trade (12.0%), Construction (11.3%), Arts, entertainment, recreation, accommodation and food services (10.2%).
Type of workers:
- Private wage or salary: 78%
- Government: 17%
- Self-employed, not incorporated: 5%
- Unpaid family work: 0%
- OSM Map
- General Map
- Google Map
- MSN Map

- 21,67291.8%White Non-Hispanic Alone
- 6082.6%Two or more races
- 5882.5%Hispanic or Latino
- 4211.8%Black Non-Hispanic Alone
- 2190.9%Some other race alone
- 810.3%Asian alone
- 290.1%American Indian and Alaska Native alone

| Median resident age: | 45.7 years |
| Virginia median age: | 39.0 years |
| Males: 12,072 | |
| Females: 11,843 |

 | Why Hasn't Lee Highway Been Renamed Yet? (139 replies) |
| Is This An Accurate Map of Virginia's Regions? (53 replies) |
| Worst county in Virginia *drum roll* (51 replies) |
| Best Mountain Views in Virginia (22 replies) |
| Please help with relocating (9 replies) |
| Thoughts about living in these places in Virginia ? (16 replies) |
| Page County: | 2.0 people |
| Virginia: | 3 people |
Estimated median household income in 2022: $55,864 ($33,359 in 1999)
| This county: | $55,864 |
| Virginia: | $85,873 |
Median contract rent in 2022 for apartments: $627 (lower quartile is $516, upper quartile is $806)
| This county: | $627 |
| State: | $1270 |
Estimated median house or condo value in 2022: $213,092 (it was $85,900 in 2000)
| Page: | $213,092 |
| Virginia: | $365,700 |
Median monthly housing costs for homes and condos with a mortgage: $1,247
Median monthly housing costs for units without a mortgage: $431
Institutionalized population: 182
Crime in 2021 (reported by the sheriff's office or county police, not the county total):
- Murders: 0
- Rapes: 5
- Robberies: 0
- Assaults: 2
- Burglaries: 12
- Thefts: 136
- Auto thefts: 13
Crime in 2020 (reported by the sheriff's office or county police, not the county total):
- Murders: 0
- Rapes: 1
- Robberies: 0
- Assaults: 5
- Burglaries: 27
- Thefts: 105
- Auto thefts: 8
Single-family new house construction building permits:
- 2022: 169 buildings, average cost: $151,300
- 2021: 87 buildings, average cost: $190,100
- 2020: 80 buildings, average cost: $145,900
- 2019: 71 buildings, average cost: $119,700
- 2018: 59 buildings, average cost: $123,400
- 2017: 66 buildings, average cost: $148,700
- 2016: 57 buildings, average cost: $135,800
- 2015: 44 buildings, average cost: $137,500
- 2014: 39 buildings, average cost: $118,800
- 2013: 39 buildings, average cost: $123,700
- 2012: 46 buildings, average cost: $120,200
- 2011: 37 buildings, average cost: $146,400
- 2010: 37 buildings, average cost: $107,800
- 2009: 44 buildings, average cost: $120,600
- 2008: 76 buildings, average cost: $19,100
- 2007: 114 buildings, average cost: $121,300
- 2006: 155 buildings, average cost: $108,800
- 2005: 220 buildings, average cost: $92,900
- 2004: 158 buildings, average cost: $118,600
- 2003: 121 buildings, average cost: $101,300
- 2002: 97 buildings, average cost: $98,000
- 2001: 97 buildings, average cost: $89,300
- 2000: 78 buildings, average cost: $81,400
- 1999: 77 buildings, average cost: $86,000
- 1998: 68 buildings, average cost: $68,200
- 1997: 106 buildings, average cost: $55,600


Median real estate property taxes paid for housing units with mortgages in 2022: $1,449 (0.6%)
Median real estate property taxes paid for housing units with no mortgage in 2022: $1,514 (0.8%)


| Page County: | 10.6% |
| Virginia: | 10.6% |
Median age of residents in 2022: 45.7 years old
(Males: 43.2 years old, Females: 47.3 years old)
(Median age for: White residents: 46.3 years old, Black residents: 42.7 years old, Asian residents: 47.5 years old, Hispanic or Latino residents: 30.0 years old, Other race residents: 41.4 years old)
Fair market rent in 2006 for a 1-bedroom apartment in Page County is $382 a month.
Fair market rent for a 2-bedroom apartment is $501 a month.
Fair market rent for a 3-bedroom apartment is $646 a month.
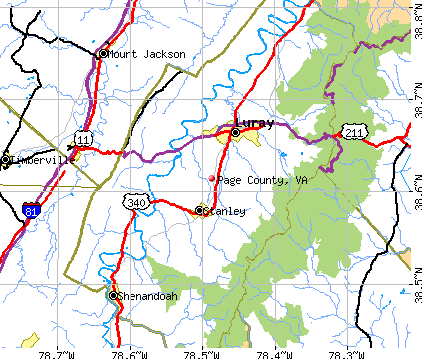
Cities in this county include: Luray, Shenandoah, Stanley.
Neighboring counties: Calvert County, Maryland  , Gunnison County, Colorado
  , Highland County
  , Tucker County, West Virginia
  , Marion County, Kansas , St. Louis County, Missouri .
| Here: | 3.9% |
| Virginia: | 2.7% |


Current college students: 373
People 25 years of age or older with a high school degree or higher: 82.4%
People 25 years of age or older with a bachelor's degree or higher: 14.7%
Number of foreign born residents: 526 (54.3% naturalized citizens)
| Page County: | 2.2% |
| Whole state: | 12.7% |

- Year of entry for the foreign-born population
- 2062010 or later
- 1532000 to 2009
- 401990 to 1999
- 591980 to 1989
- 571970 to 1979
- 106Before 1970
Mean travel time to work (commute): minutes
Percentage of county residents living and working in this county: 100.6%
Housing units in structures:
- One, detached: 9,974
- One, attached: 282
- Two: 91
- 3 or 4: 171
- 5 to 9: 155
- 10 to 19: 27
- 20 to 49: 43
- 50 or more: 111
- Mobile homes: 1,085
Housing units in Page County with a mortgage: 3,437 (349 second mortgage, 20 home equity loan, 243 both second mortgage and home equity loan)
Houses without a mortgage: 132
| Here: | 2.2% with mortgage |
| State: | 97.2% with mortgage |
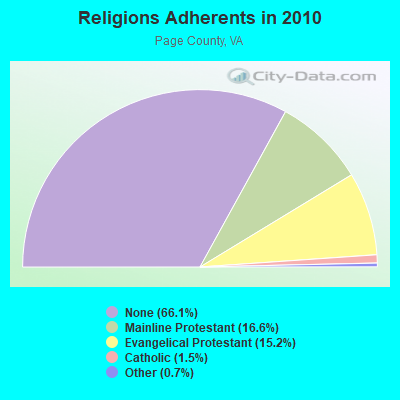
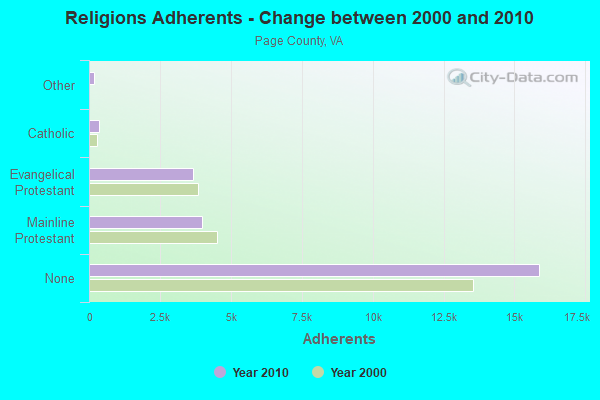
Religion statistics for Page County
| Religion | Adherents | Congregations |
|---|---|---|
| Mainline Protestant | 3,987 | 24 |
| Evangelical Protestant | 3,650 | 26 |
| Catholic | 350 | 1 |
| Other | 175 | 4 |
| None | 15,880 | - |
Source: Clifford Grammich, Kirk Hadaway, Richard Houseal, Dale E.Jones, Alexei Krindatch, Richie Stanley and Richard H.Taylor. 2012. 2010 U.S.Religion Census: Religious Congregations & Membership Study. Association of Statisticians of American Religious Bodies. Jones, Dale E., et al. 2002. Congregations and Membership in the United States 2000. Nashville, TN: Glenmary Research Center.
Food Environment Statistics:
| Page County: | 1.66 / 10,000 pop. |
| State: | 2.03 / 10,000 pop. |
| Here: | 0.41 / 10,000 pop. |
| Virginia: | 0.17 / 10,000 pop. |
| This county: | 2.07 / 10,000 pop. |
| Virginia: | 1.43 / 10,000 pop. |
| Page County: | 4.97 / 10,000 pop. |
| Virginia: | 4.03 / 10,000 pop. |
| This county: | 8.29 / 10,000 pop. |
| State: | 7.65 / 10,000 pop. |
| Page County: | 9.3% |
| Virginia: | 9.3% |
| Page County: | 28.0% |
| State: | 26.7% |
| Here: | 17.9% |
| State: | 18.6% |
Agriculture in Page County:
Average size of farms: 117 acresAverage value of agricultural products sold per farm: $198,033
Average value of crops sold per acre for harvested cropland: $62.67
The value of nursery, greenhouse, floriculture, and sod as a percentage of the total market value of agricultural products sold: 0.28%
The value of livestock, poultry, and their products as a percentage of the total market value of agricultural products sold: 98.83%
Average total farm production expenses per farm: $133,515
Harvested cropland as a percentage of land in farms: 31.62%
Irrigated harvested cropland as a percentage of land in farms: 1.18%
Average market value of all machinery and equipment per farm: $47,675
The percentage of farms operated by a family or individual: 88.52%
Average age of principal farm operators: 57 years
Average number of cattle and calves per 100 acres of all land in farms: 36.56
Milk cows as a percentage of all cattle and calves: 1.08%
Corn for grain: 2614 harvested acres
All wheat for grain: 44 harvested acres
Soybeans for beans: 439 harvested acres
Vegetables: 35 harvested acres
Land in orchards: 11 acres
Earthquake activity:
Page County-area historical earthquake activity is significantly above Virginia state average. It is 48% smaller than the overall U.S. average.On 8/23/2011 at 17:51:04, a magnitude 5.8 (5.8 MW, Depth: 3.7 mi, Class: Moderate, Intensity: VI - VII) earthquake occurred 57.2 miles away from Page County center
On 8/25/2011 at 05:07:52, a magnitude 4.5 (4.5 ML, Depth: 4.2 mi, Class: Light, Intensity: IV - V) earthquake occurred 54.1 miles away from the county center
On 12/9/2003 at 20:59:18, a magnitude 4.5 (4.5 ML, Depth: 6.2 mi) earthquake occurred 61.8 miles away from the county center
On 12/9/2003 at 20:59:14, a magnitude 4.5 (4.5 MB, 4.5 LG) earthquake occurred 77.8 miles away from the county center
On 9/25/1998 at 19:52:52, a magnitude 5.2 (4.8 MB, 4.3 MS, 5.2 LG, 4.5 MW, Depth: 3.1 mi) earthquake occurred 223.2 miles away from Page County center
On 8/9/2020 at 12:07:37, a magnitude 5.1 (5.1 MW, Depth: 4.7 mi) earthquake occurred 205.6 miles away from the county center
Magnitude types: regional Lg-wave magnitude (LG), body-wave magnitude (MB), local magnitude (ML), surface-wave magnitude (MS), moment magnitude (MW)
Most recent natural disasters:
- Virginia Covid-19 Pandemic, Incident Period: January 20, 2020, Major Disaster (Presidential) Declared DR-4512-VA: April 2, 2020, FEMA Id: 4512, Natural disaster type: Other
- Virginia Severe Winter Storm And Snowstorm, Incident Period: January 22, 2016 to January 23, 2016, Major Disaster (Presidential) Declared DR-4262: March 07, 2016, FEMA Id: 4262, Natural disaster type: Snowstorm, Winter Storm
- Virginia Hurricane Sandy, Incident Period: October 26, 2012 to November 01, 2012, Emergency Declared EM-3359: October 29, 2012, FEMA Id: 3359, Natural disaster type: Hurricane
- Virginia Severe Storms and Straight-line Winds, Incident Period: June 29, 2012 to July 01, 2012, Major Disaster (Presidential) Declared DR-4072: July 27, 2012, FEMA Id: 4072, Natural disaster type: Storm, Wind
- Virginia Severe Winter Storms and Snowstorms, Incident Period: February 05, 2010 to February 11, 2010, Major Disaster (Presidential) Declared DR-1905: April 27, 2010, FEMA Id: 1905, Natural disaster type: Snowstorm, Winter Storm
- Virginia Severe Winter Storm and Snowstorm, Incident Period: December 18, 2009 to December 20, 2009, Major Disaster (Presidential) Declared DR-1874: February 16, 2010, FEMA Id: 1874, Natural disaster type: Snowstorm, Winter Storm
- Virginia Hurricane Katrina Evacuation, Incident Period: August 29, 2005 to October 01, 2005, Emergency Declared EM-3240: September 12, 2005, FEMA Id: 3240, Natural disaster type: Hurricane
- Virginia Hurricane Isabel, Incident Period: September 18, 2003 to October 01, 2003, Major Disaster (Presidential) Declared DR-1491: September 18, 2003, FEMA Id: 1491, Natural disaster type: Hurricane
- Virginia Fultz Run Fire, Incident Period: February 27, 2002 to March 02, 2002, Fire Management Assistance Declared: February 28, 2002, FEMA Id: 2397, Natural disaster type: Fire
- Virginia Winter Storm, Incident Period: January 25, 2000 to January 30, 2000, Major Disaster (Presidential) Declared DR-1318: February 28, 2000, FEMA Id: 1318, Natural disaster type: Winter Storm
- 10 other natural disasters have been reported since 1953.
The number of natural disasters in Page County (20) is greater than the US average (15).
Major Disasters (Presidential) Declared: 14
Emergencies Declared: 5
Causes of natural disasters: Winter Storms: 5, Floods: 4, Hurricanes: 4, Storms: 4, Snowstorms: 3, Droughts: 2, Blizzard: 1, Fire: 1, Tropical Storm: 1, Wind: 1, Other: 1 (Note: some incidents may be assigned to more than one category).

Means of transportation to work:
- Drove a car alone: 4,904 (73.1%)
- Carpooled: 756 (11.3%)
- Bus: 9 (0.1%)
- Ferryboat: 17 (0.3%)
- Taxicab, motorcycle, or other means: 77 (1.1%)
- Walked: 107 (1.6%)
- Worked at home: 745 (11.1%)


- Health care and social assistance (23%)
- Retail trade (12%)
- Educational services (12%)
- Manufacturing (7%)
- Accommodation and food services (7%)
- Other services, except public administration (6%)
- Public administration (4%)

- Health care and social assistance (26%)
- Retail trade (13%)
- Educational services (13%)
- Manufacturing (8%)
- Accommodation and food services (7%)
- Other services, except public administration (6%)
- Public administration (5%)

- Construction and extraction occupations (17%)
- Production occupations (12%)
- Management occupations (10%)
- Installation, maintenance, and repair occupations (9%)
- Building and grounds cleaning and maintenance occupations (6%)
- Sales and related occupations (6%)
- Material moving occupations (6%)

- Office and administrative support occupations (17%)
- Sales and related occupations (13%)
- Healthcare support occupations (12%)
- Educational instruction, and library occupations (12%)
- Production occupations (6%)
- Management occupations (6%)
- Food preparation and serving related occupations (4%)

- Mexico (25%)
- Yemen (16%)
- England (14%)
- United Kingdom, excluding England and Scotland (11%)
- Philippines (6%)
- Honduras (6%)
- India (5%)

- American (26%)
- German (25%)
- English (16%)
- Irish (5%)
- European (3%)
- Italian (2%)
- Scottish (1%)


People in group quarters in Page County, Virginia in 2010:
- 107 people in nursing facilities/skilled-nursing facilities
- 75 people in local jails and other municipal confinement facilities
- 12 people in other noninstitutional facilities
People in group quarters in Page County, Virginia in 2000:
- 96 people in wards in general hospitals for patients who have no usual home elsewhere
- 95 people in nursing homes
- 36 people in local jails and other confinement facilities (including police lockups)
- 27 people in other noninstitutional group quarters
- 6 people in other workers' dormitories
5.51% of this county's 2021 resident taxpayers lived in other counties in 2020 ($53,388 average adjusted gross income)
| Here: | 5.51% |
| Virginia average: | 10.16% |
10 or fewer of this county's residents moved from foreign countries.
4.04% relocated from other counties in Virginia ($37,394 average AGI)
1.46% relocated from other states ($15,994 average AGI)
Page County: 1.46% Virginia average: 3.91%

Top counties from which taxpayers relocated into this county between 2020 and 2021:
| from Rockingham County, VA | |
| from Warren County, VA | |
| from Shenandoah County, VA | |
| from Harrisonburg city, VA |
4.42% of this county's 2020 resident taxpayers moved to other counties in 2021 ($45,794 average adjusted gross income)
| Here: | 4.42% |
| Virginia average: | 10.20% |
10 or fewer of this county's residents moved to foreign countries.
3.46% relocated to other counties in Virginia ($35,935 average AGI)
0.95% relocated to other states ($9,859 average AGI)
Page County: 0.95% Virginia average: 3.98%

Top counties to which taxpayers relocated from this county between 2020 and 2021:
| to Rockingham County, VA | |
| to Shenandoah County, VA | |
| to Harrisonburg city, VA | |
| to Warren County, VA |
Births per 1000 population from 1990 to 1999: 11.2
Births per 1000 population from 2000 to 2006: 11.6

Deaths per 1000 population from 1990 to 1999: 10.3
Deaths per 1000 population from 2000 to 2009: 10.5
Deaths per 1000 population from 2010 to 2020: 12.6

Infant deaths per 1000 live births from 1990 to 1999: 5.9
Infant deaths per 1000 live births from 2000 to 2006: 6.2

Persons under 19 years old without health insurance coverage in 2018: 6.7%


Persons enrolled in hospital insurance and/or supplemental medical insurance (Medicare) in July 1, 2007: 4,890 (3,956 aged, 934 disabled)
Children under 18 without health insurance coverage in 2007: 459 (8%)


Most common underlying causes of death in Page County, Virginia in 1999 - 2019:
- Acute myocardial infarction, unspecified (516)
- Bronchus or lung, unspecified - Malignant neoplasms (377)
- Atherosclerotic heart disease (297)
- Alzheimer disease, unspecified (127)
- Stroke, not specified as haemorrhage or infarction (103)
- Chronic obstructive pulmonary disease, unspecified (87)
- Unspecified dementia (86)
- Septicaemia, unspecified (35)
- Congestive heart failure (11)
- Pneumonia, unspecified (11)
Population without health insurance coverage in 2000: 11%
Children under 18 without health insurance coverage in 2000: 8%
Short term general hospital admissions per 100,000 population in 2004: 4,454
Short term general hospital beds per 100,000 population in 2004: 63
Emergency room visits per 100,000 population in 2004: 32,882
General practice office based MDs per 100,000 population in 2005: 1,137
Medical specialist MDs per 100,000 population in 2005: 1,112
Dentists per 100,000 population in 1998: 8
Total births per 100,000 population, July 2005 - July 2006 : 22
Total deaths per 100,000 population, July 2005 - July 2006: 80
Limited-service eating places per 100,000 population in 2005 : 13
Beer, wine & liquor stores per 100,000 population in 2005: 1
Crimes per 100,000 population in 1996: 1
Suicides per 1,000,000 population from 2000 to 2006: 145.9. This is more than state average.
Household type by relationship:
Households: 23,915- Male householders: 4,540 (1,386 living alone), Female householders: 5,072 (1,629 living alone)
4,718 spouses (4,680 opposite-sex spouses), 693 unmarried partners, (672 opposite-sex unmarried partners), 6,528 children (5,999 natural, 62 adopted, 472 stepchildren), 591 grandchildren, 335 brothers or sisters, 224 parents, 4 foster children, 593 other relatives, 394 non-relatives
- In group quarters: 237
Size of family households: 3,407 2-persons, 1,123 3-persons, 897 4-persons, 449 5-persons, 299 6-persons, 39 7-or-more-persons.
Size of nonfamily households: 3,015 1-person, 374 2-persons, 6 3-persons, 17 5-persons.
3,196 married couples with children.
913 single-parent households (293 men, 620 women).
96.8% of residents of Page speak English at home.
2.1% of residents speak Spanish at home (57% speak English very well, 29% speak English well, 14% speak English not well).
0.2% of residents speak other Indo-European language at home (100% speak English very well).
0.3% of residents speak Asian or Pacific Island language at home (62% speak English very well, 38% speak English well).
0.6% of residents speak other language at home (42% speak English very well, 58% don't speak English at all).
In fiscal year 2004:
Federal Government expenditure: $119,032,000 ($5,016 per capita)
Department of Defense expenditure: $1,657,000
Federal direct payments to individuals for retirement and disability: $67,412,000
Federal other direct payments to individuals: $26,259,000
Federal direct payments not to individuals: $642,000
Federal grants: $16,717,000
Federal procurement contracts: $-675,000 ($-1,976,000 Department of Defense)
Federal salaries and wages: $8,676,000 ($0,000 Department of Defense)
Federal Government direct loans: $428,000
Federal guaranteed/insured loans: $12,336,000
Federal Government insurance: $23,626,000
Population change from April 1, 2000 to July 1, 2005:
Births: 1,439| Here: | 60 per 1000 residents |
| State: | 70 per 1000 residents |
Deaths: 1,281
| Here: | 54 per 1000 residents |
| State: | 40 per 1000 residents |
Net international migration: +26
| Here: | +1 per 1000 residents |
| State: | +18 per 1000 residents |
Net internal migration: +506
| Here: | +21 per 1000 residents |
| State: | +14 per 1000 residents |

Total withdrawal of fresh water for public supply: 1.60 millions of gallons per day (all from ground)
| Here: | 6.4 |
| State: | 7.0 |
| Here: | 5.2 |
| State: | 4.3 |

- Year house built in Page County, Virginia
- 822020 or later
- 6212010 to 2019
- 1,3302000 to 2009
- 1,2411990 to 1999
- 1,7551980 to 1989
- 1,6431970 to 1979
- 8751960 to 1969
- 1,1491950 to 1959
- 7011940 to 1949
- 2,3871939 or earlier

- Rooms in owner-occupied houses in Page County, Virginia
- 1071 room
- 442 rooms
- 423 rooms
- 6744 rooms
- 1,2565 rooms
- 1,5436 rooms
- 1,1217 rooms
- 1,0148 rooms
- 1,1469+ rooms

- Rooms in renter-occupied apartments in Page County, Virginia
- 1101 room
- 492 rooms
- 2173 rooms
- 4884 rooms
- 5855 rooms
- 4946 rooms
- 3787 rooms
- 2118 rooms
- 1169+ rooms

- Bedrooms in owner-occupied houses in Page County, Virginia
- 118no bedroom
- 1031 bedroom
- 1,4372 bedrooms
- 3,9473 bedrooms
- 1,0694 bedrooms
- 2525+ bedrooms

- Bedrooms in renter-occupied apartments in Page County, Virginia
- 110no bedroom
- 2241 bedroom
- 8932 bedrooms
- 1,0563 bedrooms
- 2744 bedrooms
- 1065+ bedrooms

- Cars and other vehicles available in Page County in owner-occupied houses/condos
- 329no vehicle
- 1,3441 vehicle
- 2,6532 vehicles
- 1,2463 vehicles
- 8344 vehicles
- 5245+ vehicles

- Cars and other vehicles available in Page County in renter-occupied apartments
- 351no vehicle
- 1,0741 vehicle
- 6862 vehicles
- 4313 vehicles
- 1014 vehicles
- 185+ vehicles
92.8% of Page County residents lived in the same house 1 years ago.
Out of people who lived in different houses, 33% lived in this county.
Out of people who lived in different counties, 62% lived in Virginia.
| Page County: | 92.8% |
| State average: | 86.6% |
Place of birth for U.S.-born residents:
- This state: 18,173
- Other state: 4,928
- Northeast: 1,106
- Midwest: 571
- South: 2,609
- West: 643


- 50.9%Electricity
- 21.6%Fuel oil, kerosene, etc.
- 11.6%Wood
- 11.6%Bottled, tank, or LP gas
- 2.7%Utility gas
- 0.6%Coal or coke
- 0.6%No fuel used
- 0.2%Other fuel
- 0.2%Solar energy

- 63.1%Electricity
- 14.5%Fuel oil, kerosene, etc.
- 12.2%Wood
- 6.1%Bottled, tank, or LP gas
- 3.2%Utility gas
- 0.7%Other fuel
- 0.2%No fuel used
Private vs. public school enrollment:
| Here: | 16.7% |
| Virginia: | 13.2% |
| Here: | 1.8% |
| Virginia: | 10.2% |
| Here: | 16.0% |
| Virginia: | 18.7% |


Page County government finances - Expenditure in 2017:
- Charges - Solid Waste Management: $1,453,000
Elementary and Secondary Education School Lunch: $642,000
Other: $607,000
Elementary and Secondary Education School Tuition and Transportation: $475,000
Elementary and Secondary Education - Other: $38,000
- Construction - Police Protection: $14,643,000
Solid Waste Management: $1,258,000
Elementary and Secondary Education: $62,000
- Current Operations - Elementary and Secondary Education: $35,199,000
Public Welfare - Other: $3,501,000
General - Other: $3,408,000
Police Protection: $2,926,000
Correctional Institutions: $2,788,000
Solid Waste Management: $1,704,000
Health - Other: $1,557,000
Central Staff Services: $1,542,000
Financial Administration: $1,229,000
Corrections - Other: $1,022,000
Judicial and Legal Services: $709,000
Protective Inspection and Regulation - Other: $357,000
General Public Buildings: $343,000
Libraries: $224,000
Natural Resources - Other: $3,000
- Federal Intergovernmental - Public Welfare: $1,018,000
General Local Government Support: $150,000
- General - Interest on Debt: $2,417,000
- Intergovernmental to Local - Other - Elementary and Secondary Education: $915,000
- Local Intergovernmental - Education: $1,811,000
- Long Term Debt - Beginning Outstanding - Unspecified Public Purpose: $60,417,000
Outstanding Unspecified Public Purpose: $57,818,000
Retired Unspecified Public Purpose: $2,599,000
- Miscellaneous - General Revenue - Other: $375,000
Fines and Forfeits: $82,000
Rents: $39,000
Donations From Private Sources: $10,000
Interest Earnings: $8,000
Sale of Property: $3,000
- Other Capital Outlay - Elementary and Secondary Education: $1,149,000
- Sinking Funds - Cash and Securities: $816,000
- State Intergovernmental - Education: $24,256,000
General Local Government Support: $5,573,000
Public Welfare: $1,372,000
- Tax - Property: $19,415,000
General Sales and Gross Receipts: $1,606,000
Other: $1,323,000
Public Utilities Sales: $681,000
Motor Vehicle License: $443,000
Occupation and Business License - Other: $394,000
Other License: $9,000
- Total Salaries and Wages: $22,182,000
Page County government finances - Revenue in 2017:
- Charges - Solid Waste Management: $1,453,000
Elementary and Secondary Education School Lunch: $642,000
Other: $607,000
Elementary and Secondary Education School Tuition and Transportation: $475,000
Elementary and Secondary Education - Other: $38,000
- Construction - Police Protection: $14,643,000
Solid Waste Management: $1,258,000
Elementary and Secondary Education: $62,000
- Current Operations - Elementary and Secondary Education: $35,199,000
Public Welfare - Other: $3,501,000
General - Other: $3,408,000
Police Protection: $2,926,000
Correctional Institutions: $2,788,000
Solid Waste Management: $1,704,000
Health - Other: $1,557,000
Central Staff Services: $1,542,000
Financial Administration: $1,229,000
Corrections - Other: $1,022,000
Judicial and Legal Services: $709,000
Protective Inspection and Regulation - Other: $357,000
General Public Buildings: $343,000
Libraries: $224,000
Natural Resources - Other: $3,000
- Federal Intergovernmental - Public Welfare: $1,018,000
General Local Government Support: $150,000
- General - Interest on Debt: $2,417,000
- Intergovernmental to Local - Other - Elementary and Secondary Education: $915,000
- Local Intergovernmental - Education: $1,811,000
- Long Term Debt - Beginning Outstanding - Unspecified Public Purpose: $60,417,000
Outstanding Unspecified Public Purpose: $57,818,000
Retired Unspecified Public Purpose: $2,599,000
- Miscellaneous - General Revenue - Other: $375,000
Fines and Forfeits: $82,000
Rents: $39,000
Donations From Private Sources: $10,000
Interest Earnings: $8,000
Sale of Property: $3,000
- Other Capital Outlay - Elementary and Secondary Education: $1,149,000
- Sinking Funds - Cash and Securities: $816,000
- State Intergovernmental - Education: $24,256,000
General Local Government Support: $5,573,000
Public Welfare: $1,372,000
- Tax - Property: $19,415,000
General Sales and Gross Receipts: $1,606,000
Other: $1,323,000
Public Utilities Sales: $681,000
Motor Vehicle License: $443,000
Occupation and Business License - Other: $394,000
Other License: $9,000
- Total Salaries and Wages: $22,182,000
Page County government finances - Debt in 2017:
- Charges - Solid Waste Management: $1,453,000
Elementary and Secondary Education School Lunch: $642,000
Other: $607,000
Elementary and Secondary Education School Tuition and Transportation: $475,000
Elementary and Secondary Education - Other: $38,000
- Construction - Police Protection: $14,643,000
Solid Waste Management: $1,258,000
Elementary and Secondary Education: $62,000
- Current Operations - Elementary and Secondary Education: $35,199,000
Public Welfare - Other: $3,501,000
General - Other: $3,408,000
Police Protection: $2,926,000
Correctional Institutions: $2,788,000
Solid Waste Management: $1,704,000
Health - Other: $1,557,000
Central Staff Services: $1,542,000
Financial Administration: $1,229,000
Corrections - Other: $1,022,000
Judicial and Legal Services: $709,000
Protective Inspection and Regulation - Other: $357,000
General Public Buildings: $343,000
Libraries: $224,000
Natural Resources - Other: $3,000
- Federal Intergovernmental - Public Welfare: $1,018,000
General Local Government Support: $150,000
- General - Interest on Debt: $2,417,000
- Intergovernmental to Local - Other - Elementary and Secondary Education: $915,000
- Local Intergovernmental - Education: $1,811,000
- Long Term Debt - Beginning Outstanding - Unspecified Public Purpose: $60,417,000
Outstanding Unspecified Public Purpose: $57,818,000
Retired Unspecified Public Purpose: $2,599,000
- Miscellaneous - General Revenue - Other: $375,000
Fines and Forfeits: $82,000
Rents: $39,000
Donations From Private Sources: $10,000
Interest Earnings: $8,000
Sale of Property: $3,000
- Other Capital Outlay - Elementary and Secondary Education: $1,149,000
- Sinking Funds - Cash and Securities: $816,000
- State Intergovernmental - Education: $24,256,000
General Local Government Support: $5,573,000
Public Welfare: $1,372,000
- Tax - Property: $19,415,000
General Sales and Gross Receipts: $1,606,000
Other: $1,323,000
Public Utilities Sales: $681,000
Motor Vehicle License: $443,000
Occupation and Business License - Other: $394,000
Other License: $9,000
- Total Salaries and Wages: $22,182,000
Page County government finances - Cash and Securities in 2017:
- Charges - Solid Waste Management: $1,453,000
Elementary and Secondary Education School Lunch: $642,000
Other: $607,000
Elementary and Secondary Education School Tuition and Transportation: $475,000
Elementary and Secondary Education - Other: $38,000
- Construction - Police Protection: $14,643,000
Solid Waste Management: $1,258,000
Elementary and Secondary Education: $62,000
- Current Operations - Elementary and Secondary Education: $35,199,000
Public Welfare - Other: $3,501,000
General - Other: $3,408,000
Police Protection: $2,926,000
Correctional Institutions: $2,788,000
Solid Waste Management: $1,704,000
Health - Other: $1,557,000
Central Staff Services: $1,542,000
Financial Administration: $1,229,000
Corrections - Other: $1,022,000
Judicial and Legal Services: $709,000
Protective Inspection and Regulation - Other: $357,000
General Public Buildings: $343,000
Libraries: $224,000
Natural Resources - Other: $3,000
- Federal Intergovernmental - Public Welfare: $1,018,000
General Local Government Support: $150,000
- General - Interest on Debt: $2,417,000
- Intergovernmental to Local - Other - Elementary and Secondary Education: $915,000
- Local Intergovernmental - Education: $1,811,000
- Long Term Debt - Beginning Outstanding - Unspecified Public Purpose: $60,417,000
Outstanding Unspecified Public Purpose: $57,818,000
Retired Unspecified Public Purpose: $2,599,000
- Miscellaneous - General Revenue - Other: $375,000
Fines and Forfeits: $82,000
Rents: $39,000
Donations From Private Sources: $10,000
Interest Earnings: $8,000
Sale of Property: $3,000
- Other Capital Outlay - Elementary and Secondary Education: $1,149,000
- Sinking Funds - Cash and Securities: $816,000
- State Intergovernmental - Education: $24,256,000
General Local Government Support: $5,573,000
Public Welfare: $1,372,000
- Tax - Property: $19,415,000
General Sales and Gross Receipts: $1,606,000
Other: $1,323,000
Public Utilities Sales: $681,000
Motor Vehicle License: $443,000
Occupation and Business License - Other: $394,000
Other License: $9,000
- Total Salaries and Wages: $22,182,000
Supplemental Security Income (SSI) in 2006:
- Total number of recipients: 576
- Number of aged recipients: 93
- Number of blind and disabled recipients: 483
- Number of recipients under 18: 46
- Number of recipients between 18 and 64: 353
- Number of recipients older than 64: 177
- Number of recipients also receiving OASDI: 307
- Amount of payments (thousands of dollars): 237
| Most common first names in Page County, VA among deceased individuals | ||
| Name | Count | Lived (average) |
|---|---|---|
| William | 171 | 74.2 years |
| James | 168 | 71.5 years |
| John | 165 | 72.4 years |
| Mary | 151 | 80.3 years |
| Charles | 139 | 72.9 years |
| Robert | 103 | 70.4 years |
| George | 90 | 75.1 years |
| Harry | 69 | 75.8 years |
| Ruth | 67 | 79.4 years |
| Virginia | 64 | 78.9 years |
| Most common last names in Page County, VA among deceased individuals | ||
| Last name | Count | Lived (average) |
|---|---|---|
| Good | 145 | 74.5 years |
| Campbell | 119 | 70.7 years |
| Comer | 115 | 74.8 years |
| Painter | 109 | 76.5 years |
| Jenkins | 98 | 74.2 years |
| Cubbage | 92 | 74.1 years |
| Miller | 86 | 77.4 years |
| Cave | 86 | 72.7 years |
| Smith | 84 | 75.4 years |
| Gray | 77 | 74.8 years |
| Businesses in Page County, VA | ||||
| Name | Count | Name | Count | |
|---|---|---|---|---|
| 7-Eleven | 2 | La-Z-Boy | 1 | |
| AutoZone | 1 | Lane Furniture | 1 | |
| Best Western | 1 | Long John Silver's | 1 | |
| Burger King | 1 | McDonald's | 1 | |
| CVS | 1 | Nike | 1 | |
| Curves | 1 | Pizza Hut | 1 | |
| Days Inn | 1 | Sprint Nextel | 1 | |
| Domino's Pizza | 1 | Subway | 1 | |
| FedEx | 3 | Taco Bell | 1 | |
| Ford | 1 | U-Haul | 1 | |
| H&R Block | 1 | UPS | 1 | |
| Hardee's | 1 | Walmart | 1 | |
| KFC | 1 | |||
Page County on our top lists:
- #97 on the list of "Top 101 counties with the lowest percentage of residents relocating to other counties in 2011"