Estimated zip code population in 2022: 2,654 Zip code population in 2010: 2,458 Zip code population in 2000: 2,694
Houses and condos: 1,063 Renter-occupied apartments: 179
% of renters here:
18%
State:
33%
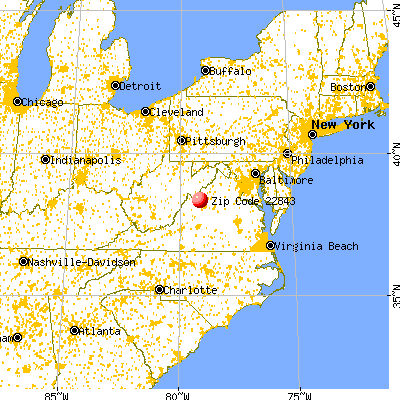
March 2022 cost of living index in zip code 22843: 84.3 (less than average, U.S. average is 100)
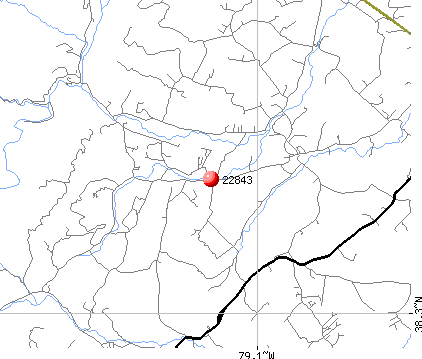
Land area: 113.2 sq. mi. Water area: 0.4 sq. mi.
Population density: 23 people per square mile
(very low).
OSM Map
General Map
Google Map
MSN Map
OSM Map
General Map
Google Map
MSN Map
OSM Map
General Map
Google Map
MSN Map
OSM Map
General Map
Google Map
MSN Map
Please wait while loading the map...
Real estate property taxes paid for housing units in 2022:
This zip code:
0.5% ($1,157)
Virginia:
0.7% ($2,617)
Median real estate property taxes paid for housing units with mortgages in 2022: $1,117 (0.4%) Median real estate property taxes paid for housing units with no mortgage in 2022: $1,236 (0.5%)
Business Search- 14 Million verified businesses
Males: 1,399
(52.7%)
Females: 1,254
(47.3%)
For population 25 years and over in 22843:
High school or higher: 77.4%
Bachelor's degree or higher: 22.1%
Graduate or professional degree: 9.7%
Unemployed: 0.4%
Mean travel time to work (commute): 27.3 minutes
For population 15 years and over in 22843:
Never married: 25.2%
Now married: 62.8%
Separated: 1.5%
Widowed: 3.6%
Divorced: 6.8%
Zip code 22843 compared to state average:
Unemployed percentage significantly below state average.
Black race population percentage significantly below state average.
Renting percentage below state average.
Length of stay since moving in significantly above state average.
Number of college students below state average.
Percentage of population with a bachelor's degree or higher below state average.
Averages for the 2020 tax year for zip code 22843, filed in 2021:
Average Adjusted Gross Income (AGI) in 2020: $53,640 (Individual Income Tax Returns)
Here:
$53,640
State:
$86,446
Salary/wage: $45,860 (reported on 80.7% of returns)
Here:
$45,860
State:
$71,185
(% of AGI for various income ranges: 1270.0% for AGIs below $25k, 3870.0% for AGIs $25k-50k, 6467.1% for AGIs $50k-75k, 10611.4% for AGIs $75k-100k, 14280.0% for AGIs $100k-200k)
Taxable interest for individuals: $1,626 (reported on 33.3% of returns)
This zip code:
$1,626
Virginia:
$1,805
(% of AGI for various income ranges: 51.2% for AGIs below $25k, 35.7% for AGIs $25k-50k, 28.6% for AGIs $50k-75k, 104.3% for AGIs $75k-100k, 297.0% for AGIs $100k-200k)
Ordinary dividends: $2,411 (reported on 16.7% of returns)
Here:
$2,411
State:
$8,327
(% of AGI for various income ranges: 19.6% for AGIs below $25k, 25.2% for AGIs $25k-50k, 43.6% for AGIs $50k-75k, 90.0% for AGIs $75k-100k, 230.0% for AGIs $100k-200k)
Net capital gain/loss in AGI: +$7,530 (reported on 17.5% of returns)
Here:
+$7,530
State:
+$24,644
(% of AGI for various income ranges: 38.5% for AGIs below $25k, 62.4% for AGIs $25k-50k, 52.9% for AGIs $50k-75k, 181.4% for AGIs $75k-100k, 1074.0% for AGIs $100k-200k)
Profit/loss from business: +$10,424 (reported on 14.9% of returns)
Here:
+$10,424
State:
+$12,836
(% of AGI for various income ranges: 161.5% for AGIs below $25k, 224.3% for AGIs $25k-50k, 505.0% for AGIs $50k-75k, 174.0% for AGIs $100k-200k)
Taxable individual retirement arrangement distribution: $13,020 (reported on 8.8% of returns)
22843:
$13,020
Virginia:
$21,535
(% of AGI for various income ranges: 79.6% for AGIs below $25k, 94.8% for AGIs $25k-50k, 302.9% for AGIs $50k-75k, 472.0% for AGIs $100k-200k)
Total itemized deductions: $28,386 (reported on 6.1% of returns)
Here:
$28,386
State:
$33,287
(% of AGI for various income ranges: 587.9% for AGIs $50k-75k, 1164.0% for AGIs $100k-200k)
Charity contributions: $16,725 (reported on 3.5% of returns)
Here:
$16,725
State:
$10,381
(% of AGI for various income ranges: 130.0% for AGIs $50k-75k, 487.0% for AGIs $100k-200k)
Taxes paid: $5,186 (reported on 6.1% of returns)
22843:
$5,186
State:
$8,284
(% of AGI for various income ranges: 102.9% for AGIs $50k-75k, 219.0% for AGIs $100k-200k)
Earned income credit: $2,075 (reported on 14.0% of returns)
Here:
$2,075
State:
$2,214
(% of AGI for various income ranges: 79.6% for AGIs below $25k, 59.5% for AGIs $25k-50k)
Percentage of individuals using paid preparers for their 2020 taxes: 92.1%
Here:
92%
State:
92%
(% for various income ranges: 92.1% for AGIs below $25k, 92.9% for AGIs $25k-50k, 90.0% for AGIs $50k-75k, 91.7% for AGIs $75k-100k, 93.8% for AGIs $100k-200k)
Averages for the 2012 tax year for zip code 22843, filed in 2013:
Average Adjusted Gross Income (AGI) in 2012: $45,476 (Individual Income Tax Returns)
Here:
$45,476
State:
$71,192
Salary/wage: $37,635 (reported on 83.5% of returns)
Here:
$37,635
State:
$59,229
(% of AGI for various income ranges: 72.4% for AGIs below $25k, 79.5% for AGIs $25k-50k, 79.2% for AGIs $50k-75k, 77.6% for AGIs $75k-100k, 42.8% for AGIs $100k-200k)
Taxable interest for individuals: $968 (reported on 38.8% of returns)
This zip code:
$968
Virginia:
$1,600
(% of AGI for various income ranges: 2.3% for AGIs below $25k, 0.6% for AGIs $25k-50k, 0.6% for AGIs $50k-75k, 0.5% for AGIs $75k-100k, 0.9% for AGIs $100k-200k)
Ordinary dividends: $4,100 (reported on 19.4% of returns)
Here:
$4,100
State:
$6,959
(% of AGI for various income ranges: 1.2% for AGIs below $25k, 1.1% for AGIs $25k-50k, 1.1% for AGIs $50k-75k, 0.7% for AGIs $75k-100k, 3.9% for AGIs $100k-200k)
Net capital gain/loss in AGI: +$4,267 (reported on 17.5% of returns)
Here:
+$4,267
State:
+$16,672
(% of AGI for various income ranges: 0.3% for AGIs $25k-50k, 1.6% for AGIs $50k-75k, 1.7% for AGIs $75k-100k, 3.7% for AGIs $100k-200k)
Profit/loss from business: +$9,329 (reported on 16.5% of returns)
Here:
+$9,329
State:
+$14,116
(% of AGI for various income ranges: 7.0% for AGIs below $25k, 5.4% for AGIs $25k-50k, 4.5% for AGIs $50k-75k, 2.1% for AGIs $75k-100k)
Taxable individual retirement arrangement distribution: $10,218 (reported on 10.7% of returns)
22843:
$10,218
Virginia:
$16,667
(% of AGI for various income ranges: 3.6% for AGIs below $25k, 2.9% for AGIs $25k-50k, 6.9% for AGIs $75k-100k)
Total itemized deductions: $18,681 (25% of AGI, reported on 25.2% of returns)
Here:
$18,681
State:
$26,596
Here:
25.1% of AGI
State:
20.1% of AGI
(% of AGI for various income ranges: 7.5% for AGIs below $25k, 10.0% for AGIs $25k-50k, 8.8% for AGIs $50k-75k, 10.8% for AGIs $75k-100k, 12.8% for AGIs $100k-200k)
Charity contributions: $4,550 (reported on 17.5% of returns)
Here:
$4,550
State:
$4,443
(% of AGI for various income ranges: 1.5% for AGIs $25k-50k, 1.0% for AGIs $50k-75k, 1.4% for AGIs $75k-100k, 3.6% for AGIs $100k-200k)
Taxes paid: $4,504 (reported on 25.2% of returns)
22843:
$4,504
State:
$9,951
(% of AGI for various income ranges: 0.9% for AGIs below $25k, 1.5% for AGIs $25k-50k, 2.2% for AGIs $50k-75k, 2.8% for AGIs $75k-100k, 4.2% for AGIs $100k-200k)
Earned income credit: $2,094 (reported on 17.5% of returns)
Here:
$2,094
State:
$2,211
(% of AGI for various income ranges: 4.9% for AGIs below $25k, 1.2% for AGIs $25k-50k)
Percentage of individuals using paid preparers for their 2012 taxes: 66.0%
Here:
66%
State:
46%
(% for various income ranges: 59.5% for AGIs below $25k, 65.6% for AGIs $25k-50k, 68.8% for AGIs $50k-75k, 80.0% for AGIs $75k-100k, 75.0% for AGIs $100k-200k)
Averages for the 2004 tax year for zip code 22843, filed in 2005:
Average Adjusted Gross Income (AGI) in 2004: $35,813 (Individual Income Tax Returns)
Here:
$35,813
State:
$56,704
Salary/wage: $33,316 (reported on 83.9% of returns)
Here:
$33,316
State:
$48,441
(% of AGI for various income ranges: 102.0% for AGIs below $10k, 80.5% for AGIs $10k-25k, 82.8% for AGIs $25k-50k, 84.1% for AGIs $50k-75k, 81.1% for AGIs $75k-100k, 49.8% for AGIs over 100k)
Taxable interest for individuals: $1,240 (reported on 42.1% of returns)
This zip code:
$1,240
Virginia:
$1,688
(% of AGI for various income ranges: 5.4% for AGIs below $10k, 1.9% for AGIs $10k-25k, 1.1% for AGIs $25k-50k, 0.5% for AGIs $50k-75k, 0.7% for AGIs $75k-100k, 3.7% for AGIs over 100k)
Taxable dividends: $1,693 (reported on 19.9% of returns)
Here:
$1,693
State:
$4,028
(% of AGI for various income ranges: 3.5% for AGIs below $10k, 0.5% for AGIs $10k-25k, 0.8% for AGIs $25k-50k, 0.5% for AGIs $50k-75k, 0.7% for AGIs $75k-100k, 2.3% for AGIs over 100k)
Net capital gain/loss: +$5,847 (reported on 16.3% of returns)
Here:
+$5,847
State:
+$14,375
(% of AGI for various income ranges: -1.7% for AGIs below $10k, 0.5% for AGIs $10k-25k, 1.1% for AGIs $25k-50k, 1.6% for AGIs $50k-75k, 0.0% for AGIs $75k-100k, 12.2% for AGIs over 100k)
Profit/loss from business: +$6,542 (reported on 14.2% of returns)
Here:
+$6,542
State:
+$13,342
(% of AGI for various income ranges: 9.6% for AGIs below $10k, 7.0% for AGIs $10k-25k, 2.4% for AGIs $25k-50k, 2.3% for AGIs $50k-75k, 1.1% for AGIs $75k-100k)
IRA payment deduction: $2,474 (reported on 1.8% of returns)
22843:
$2,474
Virginia:
$2,943
Total itemized deductions: $14,255 (22% of AGI, reported on 21.8% of returns)
Here:
$14,255
State:
$21,492
Here:
22.3% of AGI
State:
21.0% of AGI
(% of AGI for various income ranges: 7.8% for AGIs $10k-25k, 6.7% for AGIs $25k-50k, 9.3% for AGIs $50k-75k, 13.5% for AGIs $75k-100k, 9.8% for AGIs over 100k)
Charity contributions deductions: $3,828 (6% of AGI, reported on 17.3% of returns)
Here:
$3,828
State:
$3,794
Here:
5.6% of AGI
State:
3.5% of AGI
(% of AGI for various income ranges: 1.1% for AGIs $10k-25k, 1.2% for AGIs $25k-50k, 1.7% for AGIs $50k-75k, 3.0% for AGIs $75k-100k, 3.4% for AGIs over 100k)
Total tax: $3,817 (reported on 79.7% of returns)
22843:
$3,817
State:
$9,537
(% of AGI for various income ranges: 6.9% for AGIs below $10k, 4.9% for AGIs $10k-25k, 6.8% for AGIs $25k-50k, 8.0% for AGIs $50k-75k, 10.0% for AGIs $75k-100k, 15.0% for AGIs over 100k)
Earned income credit: $1,631 (reported on 13.8% of returns)
Here:
$1,631
State:
$1,734
Percentage of individuals using paid preparers for their 2004 taxes: 64.7%
Here:
65%
State:
52%
(% for various income ranges: 54.5% for AGIs below $10k, 63.3% for AGIs $10k-25k, 67.5% for AGIs $25k-50k, 67.6% for AGIs $50k-75k, 70.4% for AGIs $75k-100k, 82.9% for AGIs over 100k)
Household received Food Stamps/SNAP in the past 12 months: 21 Household did not receive Food Stamps/SNAP in the past 12 months: 954
Women who had a birth in the past 12 months: 25 (25 now married, 0 unmarried) Women who did not have a birth in the past 12 months: 592 (293 now married, 296 unmarried)
Housing units in zip code 22843 with a mortgage: 445 (29 second mortgage, 29 both second mortgage and home equity loan) Houses without a mortgage: 47
Median monthly owner costs for units with a mortgage: $1,071 Median monthly owner costs for units without a mortgage: $398
Residents with income below the poverty level in 2022:
This zip code:
3.2%
Whole state:
10.6%
Residents with income below 50% of the poverty level in 2022:
This zip code:
1.9%
Whole state:
5.2%
Median number of rooms in houses and condos:
Here:
6.3
State:
7.0
Median number of rooms in apartments:
Here:
5.8
State:
4.3
Notable locations in this zip code not listed on our city pages
Notable locations in zip code 22843: North River Campground (A), North River Picnic Area (B), Towers (C), Todd Lake Camp Site (D), Todd Lake Recreation Area (E), Briery Branch Overlook (F), Camp Flather (G), Camp Todd (H), Mossy Creek Poultry Farm (I), Michaels Poultry Farm (J), Gardner's Dairy and Poultry Farm (K), Bear Trap Farm (L), Delta Springs Farm (M), Hidden Acres Farm (N), Faber Volunteer Fire Department (O), Montebello Volunteer Fire Department and Rescue Squad (P), Mount Solon Volunteer Fire Department and Rescue Department (Q), Mount Solon Volunteer Rescue Squad (R). Display/hide their locations on the map
Churches in zip code 22843 include: Saint Pauls Church (A), Emmanuel Church (B), Mossy Creek Church (C), Mount Olivet Church (D), Mount Solon Church (E). Display/hide their locations on the map
Streams, rivers, and creeks: Whites Run (A), Trout Run (B), Stony Run (C), Skidmore Fork (D), Freemason Run (E), Earhart Creek (F), Lick Run (G), Coal Run (H), Broad Run (I). Display/hide their locations on the map
Size of family households: 353 2-persons, 153 3-persons, 135 4-persons, 67 5-persons, 38 6-persons, 8 7-or-more-persons
Size of nonfamily households: 178 1-person, 51 2-persons
429 married couples with children.
65 single-parent households (27 men, 38 women).
87.7% of residents of 22843 zip code speak English at home.
11.9% of residents speak Spanish at home (47% very well, 5% well, 34% not well, 15% not at all).
0.3% of residents speak other Indo-European language at home (100% very well).
Foreign born population: 239 (9.0%) (28.0% of them are naturalized citizens)
This zip code:
9.0%
Whole state:
12.7%
83%Honduras
8%Mexico
3%Greece
28%German
19%American
6%Irish
5%English
2%Italian
2%Swiss
1%British
Year of entry for the foreign-born population
02010 or later
1622000 to 2009
201990 to 1999
61Before 1990
Facilities with environmental interests located in this zip code:
CARGILL TURKEY PRODUCTION LLC-NASH RD (550 NASH RD in MT SOLON, VA)
AIR MINOR (AIRS/AFS) Business SIC classification: TURKEYS AND TURKEY EGGS
Housing units lacking complete plumbing facilities: 1.8% Housing units lacking complete kitchen facilities: 1.3%
51.5%Electricity
16.6%Wood
14.5%Bottled, tank, or LP gas
12.4%Fuel oil, kerosene, etc.
2.4%Utility gas
2.2%Other fuel
0.7%Solar energy
Population in 1990: 1,995. Population change in the 1990s: +699 (+35.0%).
Place of birth for U.S.-born residents:
This state: 1,859
Northeast: 246
Midwest: 30
South: 234
West: 11
70% of the 22843 zip code residents lived in the same house 5 years ago. Out of people who lived in different houses, 34% lived in this county. Out of people who lived in different counties, 50% lived in Virginia.
95% of the 22843 zip code residents lived in the same house 1 year ago. Out of people who lived in different houses, 61% moved from this county. Out of people who lived in different houses, 27% moved from different county within same state. Out of people who lived in different houses, 10% moved from different state. Out of people who lived in different houses, 4% moved from abroad.
Private vs. public school enrollment:
Students in private schools in grades 1 to 8 (elementary and middle school): 25
Here:
10.9%
Virginia:
13.2%
Students in private schools in grades 9 to 12 (high school): 120
Here:
57.6%
Virginia:
10.2%
Students in private undergraduate colleges: 20
Here:
43.1%
Virginia:
18.7%
Occupation by median earnings in the past 12 months ($)
63,373Health diagnosing and treating practitioners and other technical occupations
55,848Material moving occupations
50,199Management occupations
47,846Installation, maintenance, and repair occupations
43,106Life, physical, and social science occupations
42,494Building and grounds cleaning and maintenance occupations
Top industries in this zip code by the number of employees in 2005:
Other Services (except Public Administration): General Automotive Repair (10-19 employees: 1 establishment)
Construction: Commercial and Institutional Building Construction (10-19: 1)
Construction: Site Preparation Contractors (5-9: 1)
Construction: New Single-Family Housing Construction (except Operative Builders) (1-4: 2)
Construction: Land Subdivision (1-4: 1)
Other Services (except Public Administration): Religious Organizations (1-4: 1)
Health Care and Social Assistance: Other Individual and Family Services (1-4: 1)
People in group quarters in 2000:
6 people in agriculture workers' dormitories on farms
2002 - 2018 National Fire Incident Reporting System (NFIRS) incidents
According to the data from the years 2002 - 2018 the average number of fire incidents per year is 19. The highest number of fire incidents - 32 took place in 2002, and the least - 7 in 2003. The data has a dropping trend.
When looking into fire subcategories, the most incidents belonged to: Structure Fires (48.6%), and Outside Fires (34.9%).
Fire incident types reported to NFIRS in Zip Code 22843


 Nearest zip codes: 22821, 22812, 24421, 24467, 24485, 22831.


 According to the data from the years 2002 - 2018 the average number of fire incidents per year is 19. The highest number of fire incidents - 32 took place in 2002, and the least - 7 in 2003. The data has a dropping trend.
 When looking into fire subcategories, the most incidents belonged to: Structure Fires (48.6%), and Outside Fires (34.9%).