Estimated zip code population in 2022: 3,358 Zip code population in 2010: 3,868 Zip code population in 2000: 3,840
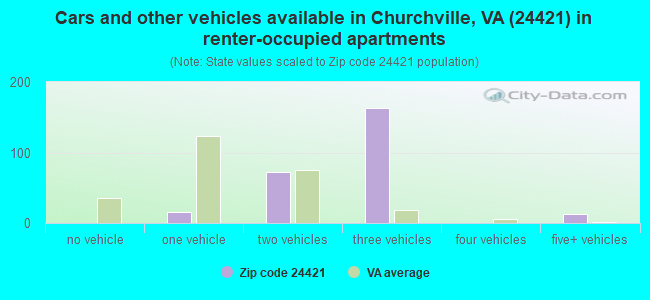
Houses and condos: 1,637 Renter-occupied apartments: 271
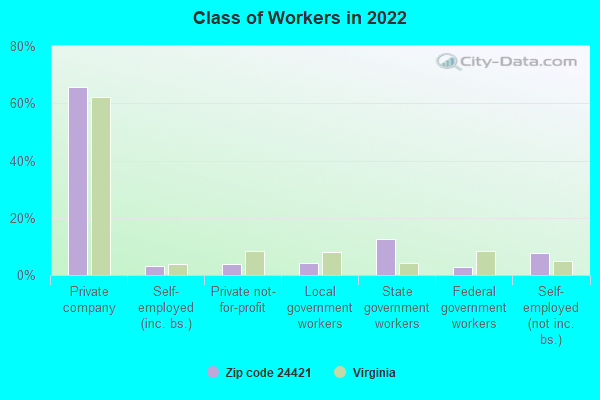
% of renters here:
19%
State:
33%
March 2022 cost of living index in zip code 24421: 85.6 (less than average, U.S. average is 100)
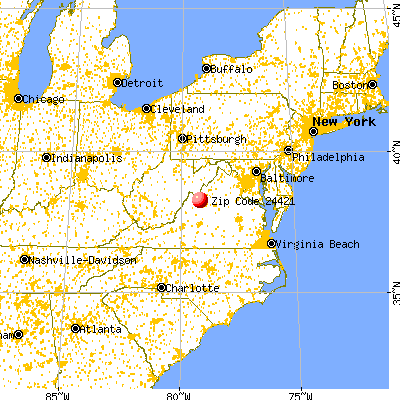
Land area: 76.6 sq. mi. Water area: 0.2 sq. mi.
Population density: 44 people per square mile
(very low).
OSM Map
General Map
Google Map
MSN Map
OSM Map
General Map
Google Map
MSN Map
OSM Map
General Map
Google Map
MSN Map
OSM Map
General Map
Google Map
MSN Map
Please wait while loading the map...
Real estate property taxes paid for housing units in 2022:
This zip code:
0.4% ($1,462)
Virginia:
0.7% ($2,617)
Median real estate property taxes paid for housing units with mortgages in 2022: $1,313 (0.4%) Median real estate property taxes paid for housing units with no mortgage in 2022: $2,435 (0.6%)
Business Search- 14 Million verified businesses
Males: 1,704
(50.7%)
Females: 1,654
(49.3%)
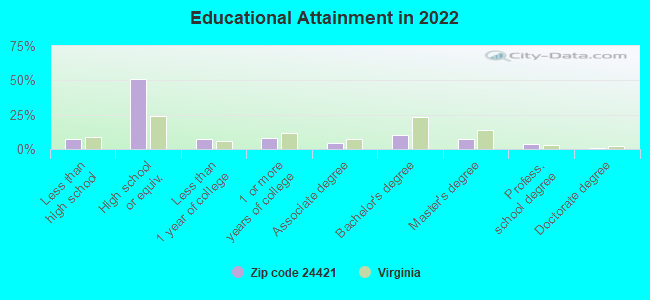
For population 25 years and over in 24421:
High school or higher: 92.1%
Bachelor's degree or higher: 21.4%
Graduate or professional degree: 11.2%
Unemployed: 2.8%
Mean travel time to work (commute): 26.8 minutes
For population 15 years and over in 24421:
Never married: 22.1%
Now married: 58.1%
Separated: 0.0%
Widowed: 2.9%
Divorced: 16.9%
Zip code 24421 compared to state average:
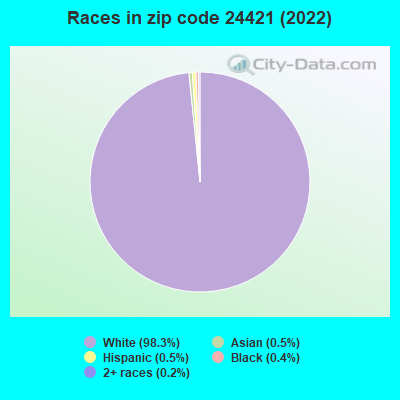
Black race population percentage significantly below state average.
Hispanic race population percentage significantly below state average.
Median age significantly above state average.
Foreign-born population percentage significantly below state average.
Renting percentage below state average.
Length of stay since moving in significantly above state average.
Number of college students below state average.
Percentage of population with a bachelor's degree or higher below state average.
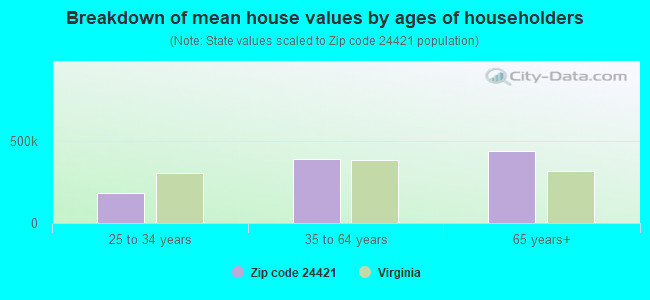
Estimated median house/condo value in 2022: $361,180
24421:
$361,180
Virginia:
$365,700
According to our research of Virginia and other state lists, there were 9 registered sex offenders living in 24421 zip code as of May 28, 2024. The ratio of all residents to sex offenders in zip code 24421 is 436 to 1. The ratio of registered sex offenders to all residents in this zip code is lower than the state average.
Median resident age:
This zip code:
48.2 years
Virginia median age:
39.0 years
Average household size:
This zip code:
2.3 people
Virginia:
2.5 people
Averages for the 2020 tax year for zip code 24421, filed in 2021:
Average Adjusted Gross Income (AGI) in 2020: $60,328 (Individual Income Tax Returns)
Here:
$60,328
State:
$86,446
Salary/wage: $50,999 (reported on 81.1% of returns)
Here:
$50,999
State:
$71,185
(% of AGI for various income ranges: 1142.8% for AGIs below $25k, 3415.7% for AGIs $25k-50k, 6273.8% for AGIs $50k-75k, 9507.3% for AGIs $75k-100k, 14381.8% for AGIs $100k-200k)
Taxable interest for individuals: $1,027 (reported on 35.0% of returns)
This zip code:
$1,027
Virginia:
$1,805
(% of AGI for various income ranges: 13.8% for AGIs below $25k, 21.6% for AGIs $25k-50k, 69.5% for AGIs $50k-75k, 74.7% for AGIs $75k-100k, 107.6% for AGIs $100k-200k)
Ordinary dividends: $4,544 (reported on 18.9% of returns)
Here:
$4,544
State:
$8,327
(% of AGI for various income ranges: 25.1% for AGIs below $25k, 24.3% for AGIs $25k-50k, 103.3% for AGIs $50k-75k, 177.3% for AGIs $75k-100k, 301.2% for AGIs $100k-200k)
Net capital gain/loss in AGI: +$11,417 (reported on 16.7% of returns)
Here:
+$11,417
State:
+$24,644
(% of AGI for various income ranges: 2.6% for AGIs below $25k, 35.1% for AGIs $25k-50k, 62.4% for AGIs $50k-75k, 242.7% for AGIs $75k-100k, 510.6% for AGIs $100k-200k)
Profit/loss from business: +$10,450 (reported on 12.2% of returns)
Here:
+$10,450
State:
+$12,836
(% of AGI for various income ranges: 81.5% for AGIs below $25k, 140.5% for AGIs $25k-50k, 278.6% for AGIs $50k-75k, 196.7% for AGIs $75k-100k, 341.8% for AGIs $100k-200k)
Taxable individual retirement arrangement distribution: $13,957 (reported on 11.7% of returns)
24421:
$13,957
Virginia:
$21,535
(% of AGI for various income ranges: 73.1% for AGIs below $25k, 78.6% for AGIs $25k-50k, 205.7% for AGIs $50k-75k, 388.0% for AGIs $75k-100k, 788.8% for AGIs $100k-200k)
Total itemized deductions: $26,533 (reported on 6.7% of returns)
Here:
$26,533
State:
$33,287
(% of AGI for various income ranges: 615.2% for AGIs $50k-75k, 1112.9% for AGIs $100k-200k)
Charity contributions: $9,275 (reported on 4.4% of returns)
Here:
$9,275
State:
$10,381
(% of AGI for various income ranges: 91.0% for AGIs $50k-75k, 324.1% for AGIs $100k-200k)
Taxes paid: $6,008 (reported on 6.7% of returns)
24421:
$6,008
State:
$8,284
(% of AGI for various income ranges: 109.0% for AGIs $50k-75k, 289.4% for AGIs $100k-200k)
Earned income credit: $2,029 (reported on 13.3% of returns)
Here:
$2,029
State:
$2,214
(% of AGI for various income ranges: 68.2% for AGIs below $25k, 59.7% for AGIs $25k-50k)
Percentage of individuals using paid preparers for their 2020 taxes: 93.3%
Here:
93%
State:
92%
(% for various income ranges: 92.2% for AGIs below $25k, 95.6% for AGIs $25k-50k, 93.3% for AGIs $50k-75k, 95.7% for AGIs $75k-100k, 92.6% for AGIs $100k-200k, 75.0% for AGIs over 200k)
Averages for the 2012 tax year for zip code 24421, filed in 2013:
Average Adjusted Gross Income (AGI) in 2012: $48,570 (Individual Income Tax Returns)
Here:
$48,570
State:
$71,192
Salary/wage: $40,565 (reported on 85.5% of returns)
Here:
$40,565
State:
$59,229
(% of AGI for various income ranges: 76.1% for AGIs below $25k, 78.0% for AGIs $25k-50k, 73.9% for AGIs $50k-75k, 78.6% for AGIs $75k-100k, 58.2% for AGIs $100k-200k)
Taxable interest for individuals: $949 (reported on 39.0% of returns)
This zip code:
$949
Virginia:
$1,600
(% of AGI for various income ranges: 1.4% for AGIs below $25k, 0.7% for AGIs $25k-50k, 0.7% for AGIs $50k-75k, 0.5% for AGIs $75k-100k, 0.9% for AGIs $100k-200k)
Ordinary dividends: $3,273 (reported on 19.2% of returns)
Here:
$3,273
State:
$6,959
(% of AGI for various income ranges: 1.6% for AGIs below $25k, 0.6% for AGIs $25k-50k, 1.1% for AGIs $50k-75k, 1.1% for AGIs $75k-100k, 2.0% for AGIs $100k-200k)
Net capital gain/loss in AGI: +$5,550 (reported on 12.8% of returns)
Here:
+$5,550
State:
+$16,672
(% of AGI for various income ranges: 0.2% for AGIs below $25k, 0.2% for AGIs $25k-50k, 0.4% for AGIs $50k-75k, 4.6% for AGIs $100k-200k)
Profit/loss from business: +$9,135 (reported on 15.1% of returns)
Here:
+$9,135
State:
+$14,116
(% of AGI for various income ranges: 5.0% for AGIs below $25k, 4.2% for AGIs $25k-50k, 2.9% for AGIs $50k-75k, 0.6% for AGIs $75k-100k, 2.7% for AGIs $100k-200k)
Taxable individual retirement arrangement distribution: $9,961 (reported on 10.5% of returns)
24421:
$9,961
Virginia:
$16,667
(% of AGI for various income ranges: 2.4% for AGIs below $25k, 2.0% for AGIs $25k-50k, 1.7% for AGIs $50k-75k, 2.6% for AGIs $75k-100k, 2.2% for AGIs $100k-200k)
Total itemized deductions: $18,323 (23% of AGI, reported on 30.2% of returns)
Here:
$18,323
State:
$26,596
Here:
23.4% of AGI
State:
20.1% of AGI
(% of AGI for various income ranges: 8.6% for AGIs below $25k, 9.5% for AGIs $25k-50k, 12.0% for AGIs $50k-75k, 12.2% for AGIs $75k-100k, 12.6% for AGIs $100k-200k)
Charity contributions: $3,579 (reported on 22.7% of returns)
Here:
$3,579
State:
$4,443
(% of AGI for various income ranges: 1.6% for AGIs $25k-50k, 1.6% for AGIs $50k-75k, 1.9% for AGIs $75k-100k, 2.1% for AGIs $100k-200k)
Taxes paid: $5,058 (reported on 30.2% of returns)
24421:
$5,058
State:
$9,951
(% of AGI for various income ranges: 1.1% for AGIs below $25k, 1.8% for AGIs $25k-50k, 3.1% for AGIs $50k-75k, 3.6% for AGIs $75k-100k, 4.5% for AGIs $100k-200k)
Earned income credit: $2,052 (reported on 15.7% of returns)
Here:
$2,052
State:
$2,211
(% of AGI for various income ranges: 5.1% for AGIs below $25k, 1.1% for AGIs $25k-50k)
Percentage of individuals using paid preparers for their 2012 taxes: 56.4%
Here:
56%
State:
46%
(% for various income ranges: 48.3% for AGIs below $25k, 54.3% for AGIs $25k-50k, 58.1% for AGIs $50k-75k, 63.2% for AGIs $75k-100k, 81.2% for AGIs $100k-200k)
Averages for the 2004 tax year for zip code 24421, filed in 2005:
Average Adjusted Gross Income (AGI) in 2004: $39,356 (Individual Income Tax Returns)
Here:
$39,356
State:
$56,704
Salary/wage: $36,187 (reported on 85.0% of returns)
Here:
$36,187
State:
$48,441
(% of AGI for various income ranges: 89.0% for AGIs below $10k, 76.5% for AGIs $10k-25k, 83.0% for AGIs $25k-50k, 79.4% for AGIs $50k-75k, 76.1% for AGIs $75k-100k, 69.6% for AGIs over 100k)
Taxable interest for individuals: $1,096 (reported on 47.6% of returns)
This zip code:
$1,096
Virginia:
$1,688
(% of AGI for various income ranges: 7.4% for AGIs below $10k, 2.5% for AGIs $10k-25k, 0.8% for AGIs $25k-50k, 1.0% for AGIs $50k-75k, 1.0% for AGIs $75k-100k, 1.7% for AGIs over 100k)
Taxable dividends: $2,202 (reported on 20.5% of returns)
Here:
$2,202
State:
$4,028
(% of AGI for various income ranges: 4.2% for AGIs below $10k, 1.4% for AGIs $10k-25k, 0.8% for AGIs $25k-50k, 1.3% for AGIs $50k-75k, 0.6% for AGIs $75k-100k, 1.5% for AGIs over 100k)
Net capital gain/loss: +$3,384 (reported on 14.7% of returns)
Here:
+$3,384
State:
+$14,375
(% of AGI for various income ranges: -2.0% for AGIs below $10k, 0.0% for AGIs $10k-25k, 0.5% for AGIs $25k-50k, 1.1% for AGIs $50k-75k, 3.0% for AGIs $75k-100k, 2.2% for AGIs over 100k)
Profit/loss from business: +$10,776 (reported on 13.1% of returns)
Here:
+$10,776
State:
+$13,342
(% of AGI for various income ranges: 7.8% for AGIs below $10k, 5.1% for AGIs $10k-25k, 4.8% for AGIs $25k-50k, 3.8% for AGIs $50k-75k, 0.3% for AGIs $75k-100k, 3.5% for AGIs over 100k)
IRA payment deduction: $2,805 (reported on 2.5% of returns)
24421:
$2,805
Virginia:
$2,943
Total itemized deductions: $15,401 (23% of AGI, reported on 28.4% of returns)
Here:
$15,401
State:
$21,492
Here:
23.1% of AGI
State:
21.0% of AGI
(% of AGI for various income ranges: 8.9% for AGIs $10k-25k, 8.4% for AGIs $25k-50k, 11.4% for AGIs $50k-75k, 14.1% for AGIs $75k-100k, 14.6% for AGIs over 100k)
Charity contributions deductions: $3,365 (5% of AGI, reported on 23.6% of returns)
Here:
$3,365
State:
$3,794
Here:
4.8% of AGI
State:
3.5% of AGI
(% of AGI for various income ranges: 1.2% for AGIs $10k-25k, 1.3% for AGIs $25k-50k, 1.9% for AGIs $50k-75k, 2.7% for AGIs $75k-100k, 3.5% for AGIs over 100k)
Total tax: $4,519 (reported on 78.9% of returns)
24421:
$4,519
State:
$9,537
(% of AGI for various income ranges: 3.3% for AGIs below $10k, 4.6% for AGIs $10k-25k, 7.0% for AGIs $25k-50k, 8.6% for AGIs $50k-75k, 10.2% for AGIs $75k-100k, 16.3% for AGIs over 100k)
Earned income credit: $1,764 (reported on 12.5% of returns)
Here:
$1,764
State:
$1,734
Percentage of individuals using paid preparers for their 2004 taxes: 53.7%
Here:
54%
State:
52%
(% for various income ranges: 45.6% for AGIs below $10k, 51.7% for AGIs $10k-25k, 53.1% for AGIs $25k-50k, 57.1% for AGIs $50k-75k, 62.4% for AGIs $75k-100k, 70.3% for AGIs over 100k)
Household received Food Stamps/SNAP in the past 12 months: 43 Household did not receive Food Stamps/SNAP in the past 12 months: 1,382
Women who had a birth in the past 12 months: 10 (10 now married, 0 unmarried) Women who did not have a birth in the past 12 months: 835 (338 now married, 498 unmarried)
Housing units in zip code 24421 with a mortgage: 681 (127 second mortgage, 94 both second mortgage and home equity loan) Houses without a mortgage: 18
Median monthly owner costs for units with a mortgage: $1,435 Median monthly owner costs for units without a mortgage: $533
Residents with income below the poverty level in 2022:
This zip code:
5.8%
Whole state:
10.6%
Residents with income below 50% of the poverty level in 2022:
This zip code:
1.0%
Whole state:
5.2%
Median number of rooms in houses and condos:
Here:
6.6
State:
7.0
Median number of rooms in apartments:
Here:
5.8
State:
4.3
Notable locations in this zip code not listed on our city pages
Notable locations in zip code 24421: Jennings Gap Dairy (A), Whites Store (B), Churchville Volunteer Fire Department and Rescue (C). Display/hide their locations on the map
Churches in zip code 24421 include: Zetta Chapel (A), Elk Run Church (B), Jerusalem Church (C), Lock Willow Presbyterian Church (D), Paynes Chapel (E), Union Church (F). Display/hide their locations on the map
Streams, rivers, and creeks: White Oak Run (A), Whisky Creek (B), Swoope Run (C), Stoutameyer Branch (D), Stillhouse Run (E), Spruce Lick Branch (F), Sixteenmile Branch (G), Shingle Run (H), Rattlesnake Run (I). Display/hide their locations on the map
In group quarters: 4 (-1 institutionalized population)
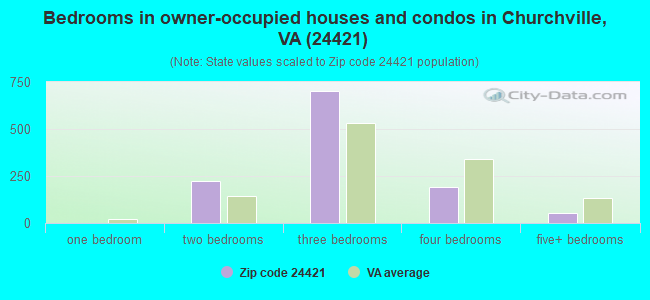
Size of family households: 412 2-persons, 335 3-persons, 201 4-persons, 15 5-persons, 13 7-or-more-persons
Size of nonfamily households: 279 1-person, 183 2-persons
422 married couples with children.
67 single-parent households (67 women).
99.3% of residents of 24421 zip code speak English at home.
0.6% of residents speak Asian or Pacific Island language at home (100% very well).
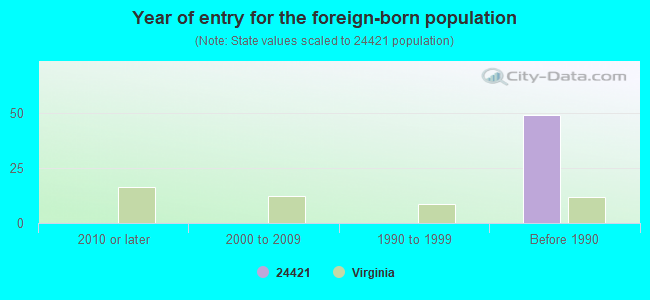
Foreign born population: 35 (1.0%) (100.0% of them are naturalized citizens)
This zip code:
1.0%
Whole state:
12.7%
58%Singapore
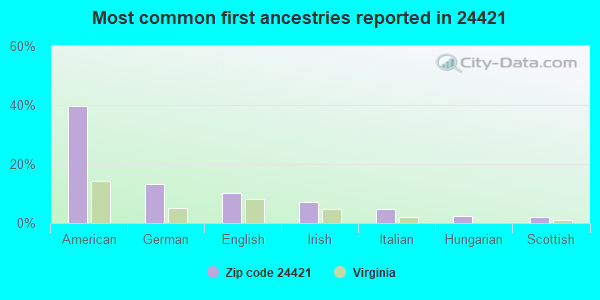
40%American
13%German
10%English
7%Irish
5%Italian
2%Hungarian
2%Scottish
Year of entry for the foreign-born population
02010 or later
02000 to 2009
01990 to 1999
49Before 1990
Facilities with environmental interests located in this zip code:
CHURCHVILLE ELEM. (3710 CHURCHVILLE AVE in CHURCHVILLE, VA)
(National Center for Education Statistics) - STATE ID-0080140 Organizations: AUGUSTA COUNTY PUBLIC SCHOOLS (SCHOOL DISTRICT)
CHURCHVILLE WTP (ROUTE 42 in CHURCHVILLE, VA)
National Pollutant Discharge Elimination System NON-MAJOR (Tracking pollutant discharge elimination systems) - permit Business SIC classification: WATER SUPPLY
CARGILL TURKEY PRODUCTS TURKEY BREEDER-P (239 HINER LANE in CHURCHVILLE, VA)
AIR MINOR (AIRS/AFS) Business SIC classification: TURKEYS AND TURKEY EGGS
Housing units lacking complete kitchen facilities: 3.3%
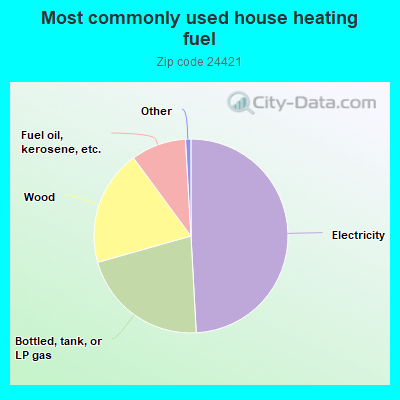
49.2%Electricity
21.5%Bottled, tank, or LP gas
19.3%Wood
9.2%Fuel oil, kerosene, etc.
Population in 1990: 3,411. Population change in the 1990s: +429 (+12.6%).
Place of birth for U.S.-born residents:
This state: 2,501
Northeast: 361
Midwest: 94
South: 205
West: 128
70% of the 24421 zip code residents lived in the same house 5 years ago. Out of people who lived in different houses, 56% lived in this county. Out of people who lived in different counties, 50% lived in Virginia.
93% of the 24421 zip code residents lived in the same house 1 year ago. Out of people who lived in different houses, 31% moved from this county. Out of people who lived in different houses, 66% moved from different county within same state. Out of people who lived in different houses, 4% moved from different state. Out of people who lived in different houses, 2% moved from abroad.
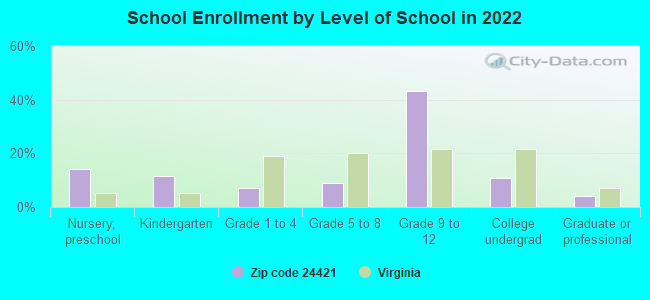
Private vs. public school enrollment:
Students in private schools in grades 1 to 8 (elementary and middle school): 19
Here:
24.3%
Virginia:
13.2%
Students in private schools in grades 9 to 12 (high school): 61
Here:
28.3%
Virginia:
10.2%
Students in private undergraduate colleges: 20
Here:
38.7%
Virginia:
18.7%
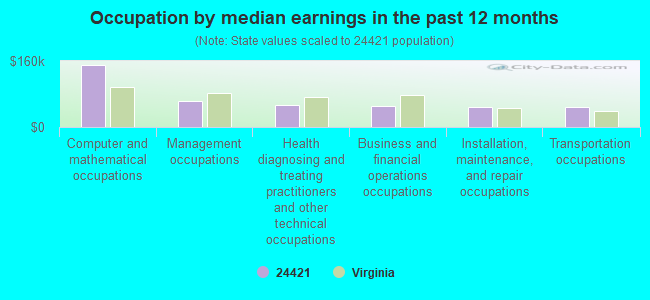
Occupation by median earnings in the past 12 months ($)
149,177Computer and mathematical occupations
63,387Management occupations
54,061Health diagnosing and treating practitioners and other technical occupations
50,981Business and financial operations occupations
49,404Installation, maintenance, and repair occupations
47,357Transportation occupations
Top industries in this zip code by the number of employees in 2005:
Construction: All Other Specialty Trade Contractors (50-99 employees: 1 establishment)
Construction: Framing Contractors (20-49: 1)
Other Services (except Public Administration): Religious Organizations (5-9: 2, 1-4: 5)
Construction: New Single-Family Housing Construction (except Operative Builders) (5-9: 2, 1-4: 2)
Accommodation and Food Services: Limited-Service Restaurants (10-19: 1, 1-4: 1)
Accommodation and Food Services: Full-Service Restaurants (5-9: 2)
Construction: Commercial and Institutional Building Construction (5-9: 1, 1-4: 1)
People in group quarters in 2010:
6 people in group homes intended for adults
Fatal accident statistics in 2013:
Fatal accident count: 1
Vehicles involved in fatal accidents: 1
Fatal accidents caused by drunken drivers: 1
Fatalities: 1
Persons involved in fatal accidents: 2
Pedestrians involved in fatal accidents: 0
Fatal accident statistics in 2011:
Fatal accident count: 1
Vehicles involved in fatal accidents: 1
Fatal accidents caused by drunken drivers: 1
Fatalities: 1
Persons involved in fatal accidents: 2
Pedestrians involved in fatal accidents: 0
2002 - 2018 National Fire Incident Reporting System (NFIRS) incidents
According to the data from the years 2002 - 2018 the average number of fires per year is 40. The highest number of fire incidents - 69 took place in 2015, and the least - 18 in 2003. The data has a declining trend.
When looking into fire subcategories, the most reports belonged to: Structure Fires (60.2%), and Outside Fires (29.2%).
Fire incident types reported to NFIRS in Zip Code 24421


 Nearest zip codes: 24479, 24485, 24411, 22843, 24442, 24430.


 According to the data from the years 2002 - 2018 the average number of fires per year is 40. The highest number of fire incidents - 69 took place in 2015, and the least - 18 in 2003. The data has a declining trend.
 When looking into fire subcategories, the most reports belonged to: Structure Fires (60.2%), and Outside Fires (29.2%).