Estimated zip code population in 2022: 6,453 Zip code population in 2010: 5,035 Zip code population in 2000: 3,501
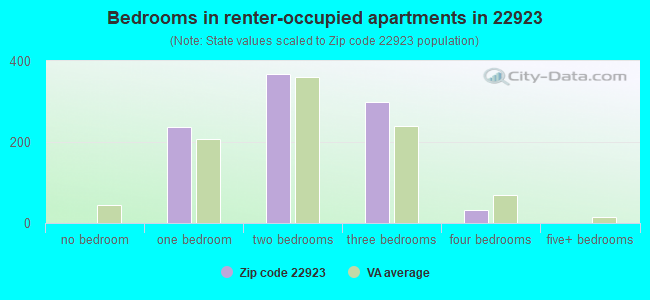
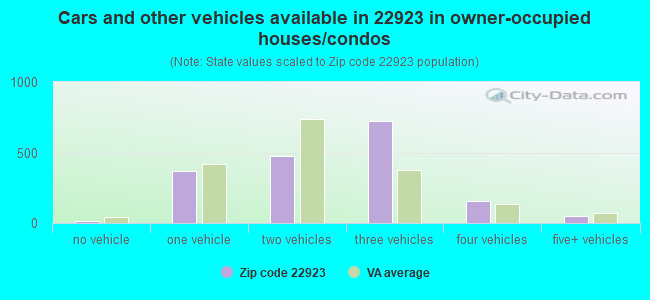
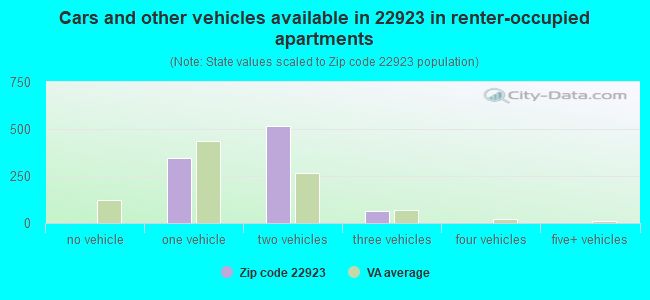
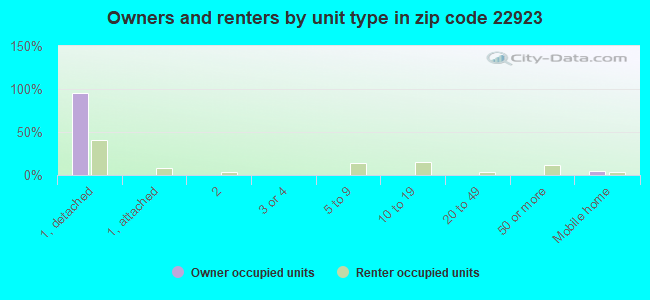
Houses and condos: 2,910 Renter-occupied apartments: 939
% of renters here:
34%
State:
33%
March 2022 cost of living index in zip code 22923: 86.4 (less than average, U.S. average is 100)
Land area: 50.3 sq. mi. Water area: 0.2 sq. mi.
Population density: 128 people per square mile
(very low).
OSM Map
General Map
Google Map
MSN Map
OSM Map
General Map
Google Map
MSN Map
OSM Map
General Map
Google Map
MSN Map
OSM Map
General Map
Google Map
MSN Map
Please wait while loading the map...
Real estate property taxes paid for housing units in 2022:
This zip code:
0.6% ($2,357)
Virginia:
0.7% ($2,617)
Median real estate property taxes paid for housing units with mortgages in 2022: $2,271 (0.6%) Median real estate property taxes paid for housing units with no mortgage in 2022: $2,651 (0.7%)
Business Search- 14 Million verified businesses
Males: 3,265
(50.6%)
Females: 3,188
(49.4%)
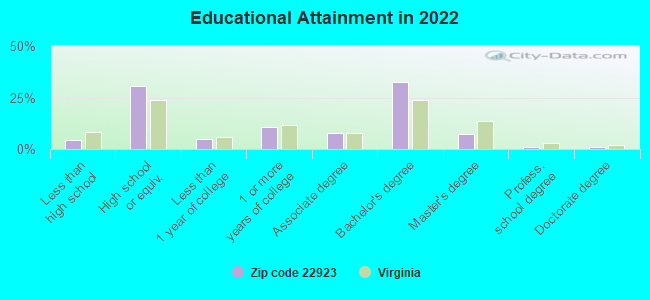
For population 25 years and over in 22923:
High school or higher: 95.6%
Bachelor's degree or higher: 41.6%
Graduate or professional degree: 9.1%
Unemployed: 2.9%
Mean travel time to work (commute): 28.6 minutes
For population 15 years and over in 22923:
Never married: 28.1%
Now married: 59.9%
Separated: 0.6%
Widowed: 2.8%
Divorced: 8.5%
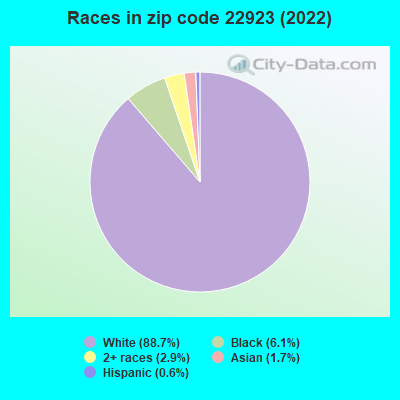
Zip code 22923 compared to state average:
Black race population percentage significantly below state average.
Hispanic race population percentage significantly below state average.
Foreign-born population percentage significantly below state average.
Length of stay since moving in above state average.
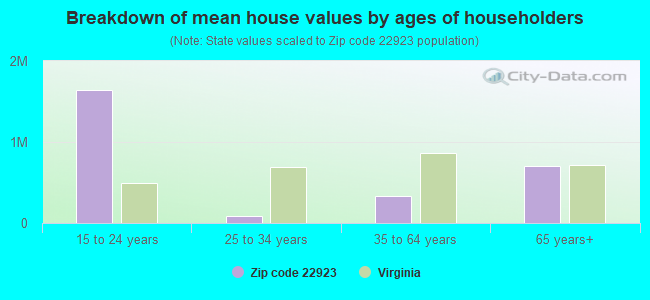
Estimated median house/condo value in 2022: $382,381
22923:
$382,381
Virginia:
$365,700
According to our research of Virginia and other state lists, there were 11 registered sex offenders living in 22923 zip code as of May 23, 2024. The ratio of all residents to sex offenders in zip code 22923 is 455 to 1. The ratio of registered sex offenders to all residents in this zip code is lower than the state average.
Median resident age:
This zip code:
36.2 years
Virginia median age:
39.0 years
Average household size:
This zip code:
2.4 people
Virginia:
2.5 people
Averages for the 2020 tax year for zip code 22923, filed in 2021:
Average Adjusted Gross Income (AGI) in 2020: $94,974 (Individual Income Tax Returns)
Here:
$94,974
State:
$86,446
Salary/wage: $66,231 (reported on 84.4% of returns)
Here:
$66,231
State:
$71,185
(% of AGI for various income ranges: 1178.7% for AGIs below $25k, 3799.8% for AGIs $25k-50k, 6554.5% for AGIs $50k-75k, 9667.1% for AGIs $75k-100k, 19027.3% for AGIs $100k-200k, 83867.5% for AGIs over 200k)
Taxable interest for individuals: $1,562 (reported on 31.2% of returns)
This zip code:
$1,562
Virginia:
$1,805
(% of AGI for various income ranges: 12.7% for AGIs below $25k, 15.4% for AGIs $25k-50k, 44.8% for AGIs $50k-75k, 95.2% for AGIs $75k-100k, 108.8% for AGIs $100k-200k, 1452.5% for AGIs over 200k)
Ordinary dividends: $8,721 (reported on 23.1% of returns)
Here:
$8,721
State:
$8,327
(% of AGI for various income ranges: 19.8% for AGIs below $25k, 69.4% for AGIs $25k-50k, 138.5% for AGIs $50k-75k, 254.8% for AGIs $75k-100k, 448.5% for AGIs $100k-200k, 7450.0% for AGIs over 200k)
Net capital gain/loss in AGI: +$50,811 (reported on 20.7% of returns)
Here:
+$50,811
State:
+$24,644
(% of AGI for various income ranges: 16.3% for AGIs below $25k, 37.4% for AGIs $25k-50k, 136.4% for AGIs $50k-75k, 165.7% for AGIs $75k-100k, 553.9% for AGIs $100k-200k, 70205.0% for AGIs over 200k)
Profit/loss from business: +$15,912 (reported on 16.3% of returns)
Here:
+$15,912
State:
+$12,836
(% of AGI for various income ranges: 116.5% for AGIs below $25k, 168.1% for AGIs $25k-50k, 198.2% for AGIs $50k-75k, 139.0% for AGIs $75k-100k, 827.3% for AGIs $100k-200k, 6120.0% for AGIs over 200k)
Taxable individual retirement arrangement distribution: $15,516 (reported on 8.5% of returns)
22923:
$15,516
Virginia:
$21,535
(% of AGI for various income ranges: 34.8% for AGIs below $25k, 63.1% for AGIs $25k-50k, 158.5% for AGIs $50k-75k, 243.3% for AGIs $75k-100k, 416.7% for AGIs $100k-200k, 2370.0% for AGIs over 200k)
Total itemized deductions: $29,597 (reported on 11.2% of returns)
Here:
$29,597
State:
$33,287
(% of AGI for various income ranges: 238.0% for AGIs $25k-50k, 257.3% for AGIs $50k-75k, 520.0% for AGIs $75k-100k, 1127.6% for AGIs $100k-200k, 7050.0% for AGIs over 200k)
Charity contributions: $10,312 (reported on 8.5% of returns)
Here:
$10,312
State:
$10,381
(% of AGI for various income ranges: 38.7% for AGIs $25k-50k, 33.9% for AGIs $50k-75k, 57.1% for AGIs $75k-100k, 252.7% for AGIs $100k-200k, 3257.5% for AGIs over 200k)
Taxes paid: $7,562 (reported on 10.8% of returns)
22923:
$7,562
State:
$8,284
(% of AGI for various income ranges: 37.2% for AGIs $25k-50k, 60.9% for AGIs $50k-75k, 134.3% for AGIs $75k-100k, 355.2% for AGIs $100k-200k, 1410.0% for AGIs over 200k)
Earned income credit: $2,003 (reported on 10.2% of returns)
Here:
$2,003
State:
$2,214
(% of AGI for various income ranges: 66.5% for AGIs below $25k, 47.2% for AGIs $25k-50k)
Percentage of individuals using paid preparers for their 2020 taxes: 91.2%
Here:
91%
State:
92%
(% for various income ranges: 88.9% for AGIs below $25k, 91.3% for AGIs $25k-50k, 91.5% for AGIs $50k-75k, 90.6% for AGIs $75k-100k, 93.3% for AGIs $100k-200k, 93.3% for AGIs over 200k)
Averages for the 2012 tax year for zip code 22923, filed in 2013:
Average Adjusted Gross Income (AGI) in 2012: $63,725 (Individual Income Tax Returns)
Here:
$63,725
State:
$71,192
Salary/wage: $56,036 (reported on 87.1% of returns)
Here:
$56,036
State:
$59,229
(% of AGI for various income ranges: 77.6% for AGIs below $25k, 81.6% for AGIs $25k-50k, 78.7% for AGIs $50k-75k, 80.5% for AGIs $75k-100k, 84.2% for AGIs $100k-200k, 54.2% for AGIs over 200k)
Taxable interest for individuals: $848 (reported on 37.5% of returns)
This zip code:
$848
Virginia:
$1,600
(% of AGI for various income ranges: 1.7% for AGIs below $25k, 0.9% for AGIs $25k-50k, 0.5% for AGIs $50k-75k, 0.2% for AGIs $75k-100k, 0.4% for AGIs $100k-200k, 0.3% for AGIs over 200k)
Ordinary dividends: $4,765 (reported on 21.8% of returns)
Here:
$4,765
State:
$6,959
(% of AGI for various income ranges: 2.4% for AGIs below $25k, 1.1% for AGIs $25k-50k, 1.6% for AGIs $50k-75k, 0.6% for AGIs $75k-100k, 1.1% for AGIs $100k-200k, 3.6% for AGIs over 200k)
Net capital gain/loss in AGI: +$4,908 (reported on 15.3% of returns)
Here:
+$4,908
State:
+$16,672
(% of AGI for various income ranges: 0.6% for AGIs $25k-50k, 0.1% for AGIs $50k-75k, 0.5% for AGIs $75k-100k, 0.5% for AGIs $100k-200k, 4.7% for AGIs over 200k)
Profit/loss from business: +$13,786 (reported on 17.7% of returns)
Here:
+$13,786
State:
+$14,116
(% of AGI for various income ranges: 9.2% for AGIs below $25k, 4.9% for AGIs $25k-50k, 4.0% for AGIs $50k-75k, 3.0% for AGIs $75k-100k, 1.6% for AGIs $100k-200k, 5.7% for AGIs over 200k)
Taxable individual retirement arrangement distribution: $15,262 (reported on 8.5% of returns)
22923:
$15,262
Virginia:
$16,667
(% of AGI for various income ranges: 3.2% for AGIs below $25k, 1.7% for AGIs $25k-50k, 2.0% for AGIs $50k-75k, 2.2% for AGIs $75k-100k, 3.0% for AGIs $100k-200k)
Total itemized deductions: $21,877 (20% of AGI, reported on 40.3% of returns)
Here:
$21,877
State:
$26,596
Here:
20.1% of AGI
State:
20.1% of AGI
(% of AGI for various income ranges: 11.0% for AGIs below $25k, 11.7% for AGIs $25k-50k, 13.4% for AGIs $50k-75k, 14.6% for AGIs $75k-100k, 16.1% for AGIs $100k-200k, 11.9% for AGIs over 200k)
Charity contributions: $3,392 (reported on 31.0% of returns)
Here:
$3,392
State:
$4,443
(% of AGI for various income ranges: 0.6% for AGIs below $25k, 1.1% for AGIs $25k-50k, 1.5% for AGIs $50k-75k, 1.7% for AGIs $75k-100k, 2.0% for AGIs $100k-200k, 1.9% for AGIs over 200k)
Taxes paid: $7,642 (reported on 39.9% of returns)
22923:
$7,642
State:
$9,951
(% of AGI for various income ranges: 1.7% for AGIs below $25k, 2.7% for AGIs $25k-50k, 3.9% for AGIs $50k-75k, 4.8% for AGIs $75k-100k, 6.2% for AGIs $100k-200k, 5.5% for AGIs over 200k)
Earned income credit: $2,168 (reported on 13.7% of returns)
Here:
$2,168
State:
$2,211
(% of AGI for various income ranges: 5.2% for AGIs below $25k, 1.1% for AGIs $25k-50k)
Percentage of individuals using paid preparers for their 2012 taxes: 40.7%
Here:
41%
State:
46%
(% for various income ranges: 40.5% for AGIs below $25k, 39.2% for AGIs $25k-50k, 39.5% for AGIs $50k-75k, 36.7% for AGIs $75k-100k, 42.1% for AGIs $100k-200k, 71.4% for AGIs over 200k)
Averages for the 2004 tax year for zip code 22923, filed in 2005:
Average Adjusted Gross Income (AGI) in 2004: $52,144 (Individual Income Tax Returns)
Here:
$52,144
State:
$56,704
Salary/wage: $45,417 (reported on 88.3% of returns)
Here:
$45,417
State:
$48,441
(% of AGI for various income ranges: 118.9% for AGIs below $10k, 78.8% for AGIs $10k-25k, 85.4% for AGIs $25k-50k, 83.2% for AGIs $50k-75k, 86.6% for AGIs $75k-100k, 63.3% for AGIs over 100k)
Taxable interest for individuals: $1,486 (reported on 46.0% of returns)
This zip code:
$1,486
Virginia:
$1,688
(% of AGI for various income ranges: 4.6% for AGIs below $10k, 1.8% for AGIs $10k-25k, 1.2% for AGIs $25k-50k, 0.6% for AGIs $50k-75k, 0.8% for AGIs $75k-100k, 1.8% for AGIs over 100k)
Taxable dividends: $3,171 (reported on 25.0% of returns)
Here:
$3,171
State:
$4,028
(% of AGI for various income ranges: 9.7% for AGIs below $10k, 1.6% for AGIs $10k-25k, 1.0% for AGIs $25k-50k, 1.1% for AGIs $50k-75k, 1.2% for AGIs $75k-100k, 1.9% for AGIs over 100k)
Net capital gain/loss: +$14,442 (reported on 20.8% of returns)
Here:
+$14,442
State:
+$14,375
(% of AGI for various income ranges: -0.9% for AGIs below $10k, 1.4% for AGIs $10k-25k, 0.8% for AGIs $25k-50k, 1.5% for AGIs $50k-75k, 1.0% for AGIs $75k-100k, 13.7% for AGIs over 100k)
Profit/loss from business: +$10,232 (reported on 15.4% of returns)
Here:
+$10,232
State:
+$13,342
(% of AGI for various income ranges: -11.2% for AGIs below $10k, 6.3% for AGIs $10k-25k, 2.9% for AGIs $25k-50k, 4.5% for AGIs $50k-75k, 2.8% for AGIs $75k-100k, 2.2% for AGIs over 100k)
IRA payment deduction: $3,324 (reported on 3.6% of returns)
22923:
$3,324
Virginia:
$2,943
(% of AGI for various income ranges: 0.5% for AGIs $25k-50k, 0.3% for AGIs $50k-75k, 0.2% for AGIs $75k-100k, 0.1% for AGIs over 100k)
Total itemized deductions: $18,465 (21% of AGI, reported on 41.1% of returns)
Here:
$18,465
State:
$21,492
Here:
21.4% of AGI
State:
21.0% of AGI
(% of AGI for various income ranges: 11.8% for AGIs below $10k, 7.7% for AGIs $10k-25k, 12.4% for AGIs $25k-50k, 15.0% for AGIs $50k-75k, 17.6% for AGIs $75k-100k, 15.1% for AGIs over 100k)
Charity contributions deductions: $3,882 (4% of AGI, reported on 33.8% of returns)
Here:
$3,882
State:
$3,794
Here:
4.2% of AGI
State:
3.5% of AGI
(% of AGI for various income ranges: 0.8% for AGIs $10k-25k, 1.2% for AGIs $25k-50k, 1.9% for AGIs $50k-75k, 1.9% for AGIs $75k-100k, 4.1% for AGIs over 100k)
Total tax: $7,408 (reported on 79.1% of returns)
22923:
$7,408
State:
$9,537
(% of AGI for various income ranges: 3.7% for AGIs below $10k, 4.4% for AGIs $10k-25k, 6.8% for AGIs $25k-50k, 8.6% for AGIs $50k-75k, 9.6% for AGIs $75k-100k, 16.9% for AGIs over 100k)
Earned income credit: $1,672 (reported on 10.0% of returns)
Here:
$1,672
State:
$1,734
Percentage of individuals using paid preparers for their 2004 taxes: 47.1%
Here:
47%
State:
52%
(% for various income ranges: 38.8% for AGIs below $10k, 48.6% for AGIs $10k-25k, 49.6% for AGIs $25k-50k, 47.4% for AGIs $50k-75k, 45.0% for AGIs $75k-100k, 54.4% for AGIs over 100k)
Household received Food Stamps/SNAP in the past 12 months: 123 Household did not receive Food Stamps/SNAP in the past 12 months: 2,588
Women who had a birth in the past 12 months: 69 (38 now married, 29 unmarried) Women who did not have a birth in the past 12 months: 1,501 (720 now married, 778 unmarried)
Housing units in zip code 22923 with a mortgage: 1,319 (182 second mortgage, 178 both second mortgage and home equity loan) Houses without a mortgage: 160
Median monthly owner costs for units with a mortgage: $1,858 Median monthly owner costs for units without a mortgage: $536
Residents with income below the poverty level in 2022:
This zip code:
11.1%
Whole state:
10.6%
Residents with income below 50% of the poverty level in 2022:
This zip code:
9.8%
Whole state:
5.2%
Median number of rooms in houses and condos:
Here:
7.1
State:
7.0
Median number of rooms in apartments:
Here:
4.5
State:
4.3
Notable locations in this zip code not listed on our city pages
Notable locations in zip code 22923: Barbour Ruins (A), Burnleys Vineyard (B), Three Forks (C), Barboursville Winery (D), Sandy Branch Resort Farm (E), Red Horse Farm (F), Piedmont Manor (G). Display/hide their locations on the map
Churches in zip code 22923 include: Preddy Creek Church (A), Chestnut Grove Church (B), Union Grove Church (C), Full Gospel Church (D), Holy Trinity Church (E), Knights Chapel (F), Mount Lebanon Church (G), Mountain Chapel (H), Pleasant Grove Church (I). Display/hide their locations on the map
Cemeteries: Thomas Cemetery (1), Goss Cemetery (2), Johns Cemetery (3), Mount Lebanon Cemetery (4), Eheart Cemetery (5), Knights Chapel Cemetery (6). Display/hide their locations on the map
Reservoirs: Harlow Farm Pond (A), Word Farm Pond (B), Lake Saponi (C), Aldrich Pond (D), Bishops Lake (E), Smiths Lake (F). Display/hide their locations on the map
Streams, rivers, and creeks: White Run (A), Turkey Run (B), Sandy Branch (C), Rippin Run (D), Marshall Creek (E), Marsh Run (F), Hinson Hollow Branch (G), County Line Branch (H), Colvin Creek (I). Display/hide their locations on the map
Size of family households: 852 2-persons, 468 3-persons, 288 4-persons, 277 5-persons, 40 6-persons
Size of nonfamily households: 479 1-person, 322 2-persons
610 married couples with children.
371 single-parent households (35 men, 336 women).
95.5% of residents of 22923 zip code speak English at home.
0.3% of residents speak Spanish at home (100% well).
1.6% of residents speak other Indo-European language at home (80% very well, 15% well, 5% not well).
1.5% of residents speak Asian or Pacific Island language at home (29% very well, 71% well).
0.4% of residents speak other language at home (52% very well, 48% well).
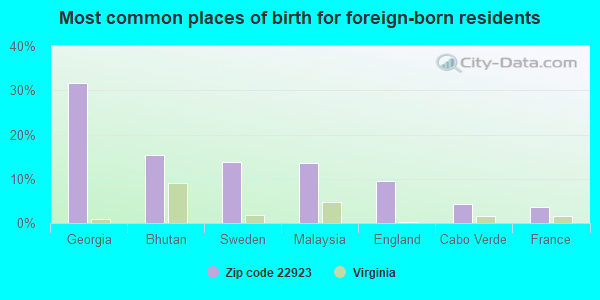
Foreign born population: 263 (4.1%) (96.0% of them are naturalized citizens)
This zip code:
4.1%
Whole state:
12.7%
32%Georgia
15%Bhutan
14%Sweden
13%Malaysia
10%England
4%Cabo Verde
4%France
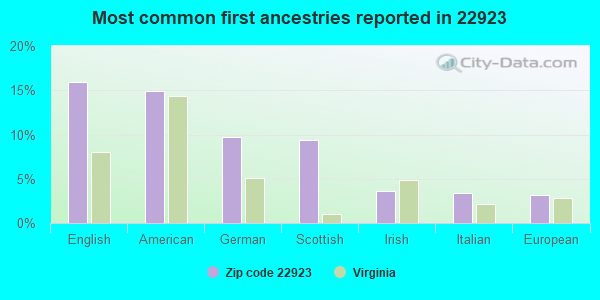
16%English
15%American
10%German
9%Scottish
4%Irish
3%Italian
3%European
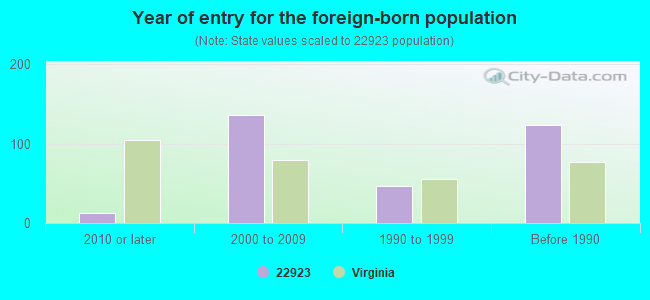
Year of entry for the foreign-born population
122010 or later
1362000 to 2009
461990 to 1999
123Before 1990
Facilities with environmental interests located in this zip code:
AT & T-BARBOURSVILLE-VA2970 (POLE 1970 ST RTE 640 in BARBOURSVILLE, VA)
Conditionally Exempt Small Quantity Generators, less than 100 kg/month of hazardous waste (Resource Conservation and Recovery Act (tracking hazardous waste)) - notification Organizations: OPERNAME (CONTACT/OPERATOR)
, AT & T COMMUNICATIONS OF VA (CONTACT/OWNER)
Housing units lacking complete plumbing facilities: 2.0% Housing units lacking complete kitchen facilities: 0.3%
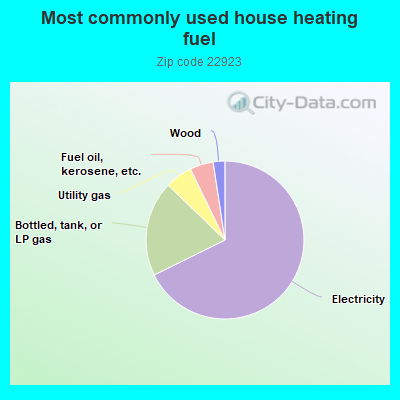
67.7%Electricity
19.5%Bottled, tank, or LP gas
5.6%Utility gas
4.8%Fuel oil, kerosene, etc.
2.4%Wood
Population in 1990: 1,389. Population change in the 1990s: +2,112 (+152.1%).
Place of birth for U.S.-born residents:
This state: 2,995
Northeast: 1,305
Midwest: 429
South: 969
West: 425
53% of the 22923 zip code residents lived in the same house 5 years ago. Out of people who lived in different houses, 31% lived in this county. Out of people who lived in different counties, 50% lived in Virginia.
92% of the 22923 zip code residents lived in the same house 1 year ago. Out of people who lived in different houses, 50% moved from this county. Out of people who lived in different houses, 46% moved from different county within same state. Out of people who lived in different houses, 3% moved from different state.
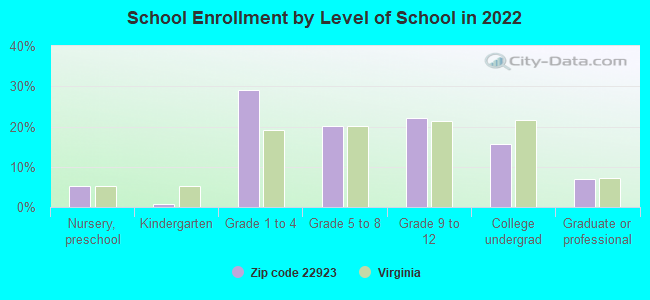
Private vs. public school enrollment:
Students in private schools in grades 1 to 8 (elementary and middle school): 36
Here:
6.3%
Virginia:
13.2%
Students in private schools in grades 9 to 12 (high school): 7
Here:
2.9%
Virginia:
10.2%
Students in private undergraduate colleges: 72
Here:
41.2%
Virginia:
18.7%
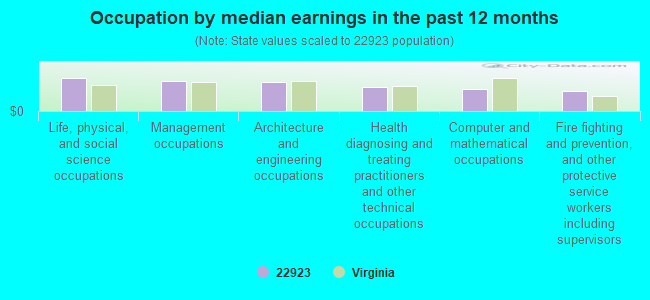
Occupation by median earnings in the past 12 months ($)
111,720Life, physical, and social science occupations
99,890Management occupations
98,609Architecture and engineering occupations
79,086Health diagnosing and treating practitioners and other technical occupations
74,327Computer and mathematical occupations
67,005Fire fighting and prevention, and other protective service workers including supervisors
Companies with federal contracts located in this zip code:
FRENCH JAMES A (6129 Spotswood Trail, Rt. 33E in Barboursville, VA; small business)
$219,980 with Departmental Offices for Personal Services Contracts. Taking place in DC. Signed on 2006-02-17. Completion date: 2011-02-16.
WIMSATT, JEFFREY H (3190 PRIDDY CT in BARBOURSVILLE, VA; small business)
$40,140 with Army for Physical Sciences -- Basic Research (R&D). Signed on 2004-09-29. Completion date: 2005-05-31.
Top industries in this zip code by the number of employees in 2005:
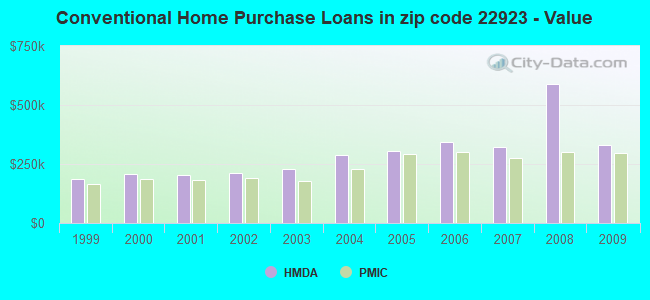
Detailed PMIC statistics for the following Tracts:0102.00
, 0104.00
2002 - 2018 National Fire Incident Reporting System (NFIRS) incidents
According to the data from the years 2002 - 2018 the average number of fire incidents per year is 15. The highest number of reported fire incidents - 47 took place in 2015, and the least - 2 in 2005. The data has a decreasing trend.
When looking into fire subcategories, the most reports belonged to: Structure Fires (46.4%), and Outside Fires (41.3%).
Fire incident types reported to NFIRS in Zip Code 22923

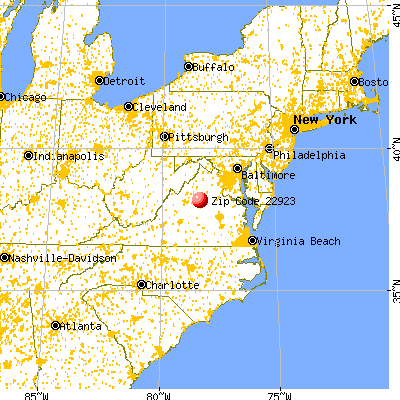


 Nearest zip codes: 22972, 22968, 22738, 22911, 22947, 22942.


 According to the data from the years 2002 - 2018 the average number of fire incidents per year is 15. The highest number of reported fire incidents - 47 took place in 2015, and the least - 2 in 2005. The data has a decreasing trend.
 When looking into fire subcategories, the most reports belonged to: Structure Fires (46.4%), and Outside Fires (41.3%).