Estimated zip code population in 2022: 10,993 Zip code population in 2010: 9,815 Zip code population in 2000: 8,536
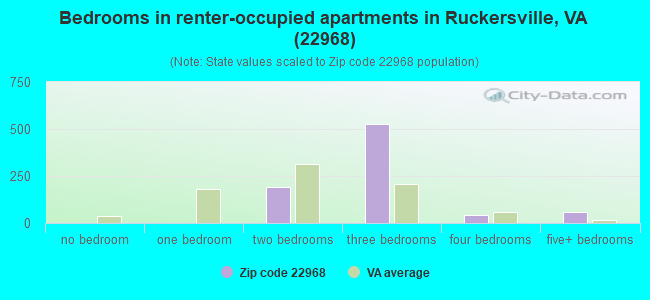
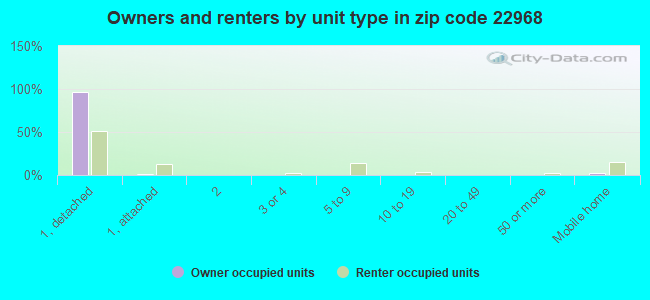
Houses and condos: 3,940 Renter-occupied apartments: 831
% of renters here:
22%
State:
33%
March 2022 cost of living index in zip code 22968: 92.1 (less than average, U.S. average is 100)
Land area: 38.6 sq. mi. Water area: 0.3 sq. mi.
Population density: 285 people per square mile
(very low).
OSM Map
General Map
Google Map
MSN Map
OSM Map
General Map
Google Map
MSN Map
OSM Map
General Map
Google Map
MSN Map
OSM Map
General Map
Google Map
MSN Map
Please wait while loading the map...
Real estate property taxes paid for housing units in 2022:
This zip code:
0.6% ($1,945)
Virginia:
0.7% ($2,617)
Median real estate property taxes paid for housing units with mortgages in 2022: $1,910 (0.6%) Median real estate property taxes paid for housing units with no mortgage in 2022: $2,106 (0.6%)
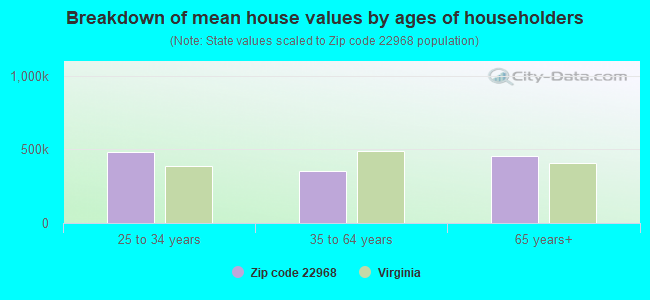
Estimated median house/condo value in 2022: $323,943
22968:
$323,943
Virginia:
$365,700
According to our research of Virginia and other state lists, there were 24 registered sex offenders living in 22968 zip code as of May 28, 2024. The ratio of all residents to sex offenders in zip code 22968 is 426 to 1. The ratio of registered sex offenders to all residents in this zip code is lower than the state average.
Median resident age:
This zip code:
40.8 years
Virginia median age:
39.0 years
Average household size:
This zip code:
2.9 people
Virginia:
2.5 people
Averages for the 2020 tax year for zip code 22968, filed in 2021:
Average Adjusted Gross Income (AGI) in 2020: $67,763 (Individual Income Tax Returns)
Here:
$67,763
State:
$86,446
Salary/wage: $57,646 (reported on 84.2% of returns)
Here:
$57,646
State:
$71,185
(% of AGI for various income ranges: 1231.1% for AGIs below $25k, 3567.5% for AGIs $25k-50k, 6208.4% for AGIs $50k-75k, 9424.2% for AGIs $75k-100k, 17504.9% for AGIs $100k-200k, 42335.0% for AGIs over 200k)
Taxable interest for individuals: $1,358 (reported on 27.0% of returns)
This zip code:
$1,358
Virginia:
$1,805
(% of AGI for various income ranges: 15.2% for AGIs below $25k, 13.6% for AGIs $25k-50k, 38.2% for AGIs $50k-75k, 73.0% for AGIs $75k-100k, 113.6% for AGIs $100k-200k, 606.2% for AGIs over 200k)
Ordinary dividends: $4,417 (reported on 18.4% of returns)
Here:
$4,417
State:
$8,327
(% of AGI for various income ranges: 15.8% for AGIs below $25k, 28.2% for AGIs $25k-50k, 83.0% for AGIs $50k-75k, 148.4% for AGIs $75k-100k, 250.5% for AGIs $100k-200k, 1697.5% for AGIs over 200k)
Net capital gain/loss in AGI: +$18,168 (reported on 15.9% of returns)
Here:
+$18,168
State:
+$24,644
(% of AGI for various income ranges: 3.9% for AGIs below $25k, 22.2% for AGIs $25k-50k, 65.8% for AGIs $50k-75k, 233.0% for AGIs $75k-100k, 522.2% for AGIs $100k-200k, 13632.5% for AGIs over 200k)
Profit/loss from business: +$14,578 (reported on 16.9% of returns)
Here:
+$14,578
State:
+$12,836
(% of AGI for various income ranges: 130.7% for AGIs below $25k, 196.6% for AGIs $25k-50k, 221.6% for AGIs $50k-75k, 337.2% for AGIs $75k-100k, 568.7% for AGIs $100k-200k, 4622.5% for AGIs over 200k)
Taxable individual retirement arrangement distribution: $20,181 (reported on 8.8% of returns)
22968:
$20,181
Virginia:
$21,535
(% of AGI for various income ranges: 35.8% for AGIs below $25k, 79.9% for AGIs $25k-50k, 224.4% for AGIs $50k-75k, 402.6% for AGIs $75k-100k, 552.2% for AGIs $100k-200k, 2710.0% for AGIs over 200k)
Self-employed (Keogh) retirement plans: $23,850 (reported on 0.4% of returns)
22968:
$23,850
Virginia:
$31,172
(% of AGI for various income ranges: 86.7% for AGIs $100k-200k)
Total itemized deductions: $30,135 (reported on 9.6% of returns)
Here:
$30,135
State:
$33,287
(% of AGI for various income ranges: 139.5% for AGIs $25k-50k, 306.7% for AGIs $50k-75k, 511.9% for AGIs $75k-100k, 1053.8% for AGIs $100k-200k, 5095.0% for AGIs over 200k)
Charity contributions: $9,362 (reported on 7.3% of returns)
Here:
$9,362
State:
$10,381
(% of AGI for various income ranges: 20.1% for AGIs $25k-50k, 48.9% for AGIs $50k-75k, 88.4% for AGIs $75k-100k, 261.1% for AGIs $100k-200k, 1666.3% for AGIs over 200k)
Taxes paid: $7,350 (reported on 9.4% of returns)
22968:
$7,350
State:
$8,284
(% of AGI for various income ranges: 19.9% for AGIs $25k-50k, 69.8% for AGIs $50k-75k, 139.8% for AGIs $75k-100k, 318.4% for AGIs $100k-200k, 880.0% for AGIs over 200k)
Earned income credit: $2,197 (reported on 14.4% of returns)
Here:
$2,197
State:
$2,214
(% of AGI for various income ranges: 86.5% for AGIs below $25k, 69.0% for AGIs $25k-50k)
Percentage of individuals using paid preparers for their 2020 taxes: 91.7%
Here:
92%
State:
92%
(% for various income ranges: 89.6% for AGIs below $25k, 93.4% for AGIs $25k-50k, 92.0% for AGIs $50k-75k, 90.6% for AGIs $75k-100k, 92.6% for AGIs $100k-200k, 95.0% for AGIs over 200k)
Averages for the 2012 tax year for zip code 22968, filed in 2013:
Average Adjusted Gross Income (AGI) in 2012: $57,061 (Individual Income Tax Returns)
Here:
$57,061
State:
$71,192
Salary/wage: $51,147 (reported on 86.3% of returns)
Here:
$51,147
State:
$59,229
(% of AGI for various income ranges: 79.3% for AGIs below $25k, 81.7% for AGIs $25k-50k, 80.0% for AGIs $50k-75k, 81.3% for AGIs $75k-100k, 78.7% for AGIs $100k-200k, 56.7% for AGIs over 200k)
Taxable interest for individuals: $1,080 (reported on 34.6% of returns)
This zip code:
$1,080
Virginia:
$1,600
(% of AGI for various income ranges: 1.0% for AGIs below $25k, 0.7% for AGIs $25k-50k, 0.8% for AGIs $50k-75k, 0.6% for AGIs $75k-100k, 0.4% for AGIs $100k-200k, 1.0% for AGIs over 200k)
Ordinary dividends: $3,233 (reported on 19.3% of returns)
Here:
$3,233
State:
$6,959
(% of AGI for various income ranges: 1.5% for AGIs below $25k, 0.7% for AGIs $25k-50k, 1.0% for AGIs $50k-75k, 1.0% for AGIs $75k-100k, 1.3% for AGIs $100k-200k, 1.2% for AGIs over 200k)
Net capital gain/loss in AGI: +$5,178 (reported on 14.0% of returns)
Here:
+$5,178
State:
+$16,672
(% of AGI for various income ranges: 0.4% for AGIs $25k-50k, 0.4% for AGIs $50k-75k, 0.4% for AGIs $75k-100k, 1.3% for AGIs $100k-200k, 5.8% for AGIs over 200k)
Profit/loss from business: +$10,438 (reported on 14.6% of returns)
Here:
+$10,438
State:
+$14,116
(% of AGI for various income ranges: 6.5% for AGIs below $25k, 3.1% for AGIs $25k-50k, 3.2% for AGIs $50k-75k, 1.5% for AGIs $75k-100k, 1.5% for AGIs $100k-200k, 4.1% for AGIs over 200k)
Taxable individual retirement arrangement distribution: $13,940 (reported on 10.0% of returns)
22968:
$13,940
Virginia:
$16,667
(% of AGI for various income ranges: 2.7% for AGIs below $25k, 2.2% for AGIs $25k-50k, 2.1% for AGIs $50k-75k, 1.8% for AGIs $75k-100k, 2.9% for AGIs $100k-200k, 2.9% for AGIs over 200k)
Self-employment retirement plans: $11,650 (reported on 0.4% of returns)
22968:
$11,650
Virginia:
$25,373
Total itemized deductions: $20,978 (22% of AGI, reported on 39.0% of returns)
Here:
$20,978
State:
$26,596
Here:
21.9% of AGI
State:
20.1% of AGI
(% of AGI for various income ranges: 8.3% for AGIs below $25k, 11.8% for AGIs $25k-50k, 13.8% for AGIs $50k-75k, 16.5% for AGIs $75k-100k, 16.7% for AGIs $100k-200k, 12.5% for AGIs over 200k)
Charity contributions: $3,583 (reported on 29.5% of returns)
Here:
$3,583
State:
$4,443
(% of AGI for various income ranges: 0.4% for AGIs below $25k, 1.1% for AGIs $25k-50k, 1.4% for AGIs $50k-75k, 1.8% for AGIs $75k-100k, 2.6% for AGIs $100k-200k, 2.6% for AGIs over 200k)
Taxes paid: $6,720 (reported on 39.0% of returns)
22968:
$6,720
State:
$9,951
(% of AGI for various income ranges: 1.3% for AGIs below $25k, 2.6% for AGIs $25k-50k, 3.7% for AGIs $50k-75k, 5.0% for AGIs $75k-100k, 6.1% for AGIs $100k-200k, 5.6% for AGIs over 200k)
Earned income credit: $2,133 (reported on 16.2% of returns)
Here:
$2,133
State:
$2,211
(% of AGI for various income ranges: 6.1% for AGIs below $25k, 1.1% for AGIs $25k-50k)
Percentage of individuals using paid preparers for their 2012 taxes: 37.9%
Here:
38%
State:
46%
(% for various income ranges: 36.2% for AGIs below $25k, 37.3% for AGIs $25k-50k, 40.0% for AGIs $50k-75k, 37.5% for AGIs $75k-100k, 36.1% for AGIs $100k-200k, 70.0% for AGIs over 200k)
Averages for the 2004 tax year for zip code 22968, filed in 2005:
Average Adjusted Gross Income (AGI) in 2004: $43,766 (Individual Income Tax Returns)
Here:
$43,766
State:
$56,704
Salary/wage: $40,335 (reported on 90.1% of returns)
Here:
$40,335
State:
$48,441
(% of AGI for various income ranges: 114.0% for AGIs below $10k, 83.1% for AGIs $10k-25k, 85.9% for AGIs $25k-50k, 87.4% for AGIs $50k-75k, 86.4% for AGIs $75k-100k, 69.0% for AGIs over 100k)
Taxable interest for individuals: $976 (reported on 41.6% of returns)
This zip code:
$976
Virginia:
$1,688
(% of AGI for various income ranges: 4.4% for AGIs below $10k, 1.4% for AGIs $10k-25k, 0.9% for AGIs $25k-50k, 0.5% for AGIs $50k-75k, 0.7% for AGIs $75k-100k, 1.2% for AGIs over 100k)
Taxable dividends: $2,158 (reported on 19.5% of returns)
Here:
$2,158
State:
$4,028
(% of AGI for various income ranges: 2.9% for AGIs below $10k, 0.7% for AGIs $10k-25k, 0.9% for AGIs $25k-50k, 0.4% for AGIs $50k-75k, 0.5% for AGIs $75k-100k, 2.2% for AGIs over 100k)
Net capital gain/loss: +$8,137 (reported on 14.8% of returns)
Here:
+$8,137
State:
+$14,375
(% of AGI for various income ranges: -0.6% for AGIs below $10k, 0.5% for AGIs $10k-25k, 0.5% for AGIs $25k-50k, 1.0% for AGIs $50k-75k, 1.3% for AGIs $75k-100k, 9.9% for AGIs over 100k)
Profit/loss from business: +$11,130 (reported on 15.5% of returns)
Here:
+$11,130
State:
+$13,342
(% of AGI for various income ranges: 3.7% for AGIs below $10k, 5.6% for AGIs $10k-25k, 4.3% for AGIs $25k-50k, 2.5% for AGIs $50k-75k, 1.5% for AGIs $75k-100k, 7.0% for AGIs over 100k)
IRA payment deduction: $2,842 (reported on 2.6% of returns)
22968:
$2,842
Virginia:
$2,943
(% of AGI for various income ranges: 0.3% for AGIs $10k-25k, 0.3% for AGIs $25k-50k, 0.1% for AGIs $50k-75k, 0.1% for AGIs $75k-100k, 0.1% for AGIs over 100k)
Self-employed pension: $8,143 (reported on 0.4% of returns)
Here:
$8,143
Virginia:
$17,430
Total itemized deductions: $15,306 (22% of AGI, reported on 40.4% of returns)
Here:
$15,306
State:
$21,492
Here:
22.3% of AGI
State:
21.0% of AGI
(% of AGI for various income ranges: 8.1% for AGIs below $10k, 8.9% for AGIs $10k-25k, 12.6% for AGIs $25k-50k, 15.9% for AGIs $50k-75k, 15.9% for AGIs $75k-100k, 14.5% for AGIs over 100k)
Charity contributions deductions: $2,492 (3% of AGI, reported on 31.1% of returns)
Here:
$2,492
State:
$3,794
Here:
3.4% of AGI
State:
3.5% of AGI
(% of AGI for various income ranges: 0.4% for AGIs below $10k, 1.1% for AGIs $10k-25k, 1.2% for AGIs $25k-50k, 1.7% for AGIs $50k-75k, 1.7% for AGIs $75k-100k, 2.9% for AGIs over 100k)
Total tax: $5,266 (reported on 78.6% of returns)
22968:
$5,266
State:
$9,537
(% of AGI for various income ranges: 3.2% for AGIs below $10k, 4.2% for AGIs $10k-25k, 6.8% for AGIs $25k-50k, 8.1% for AGIs $50k-75k, 9.9% for AGIs $75k-100k, 16.2% for AGIs over 100k)
Earned income credit: $1,783 (reported on 14.2% of returns)
Here:
$1,783
State:
$1,734
Percentage of individuals using paid preparers for their 2004 taxes: 43.6%
Here:
44%
State:
52%
(% for various income ranges: 37.4% for AGIs below $10k, 46.1% for AGIs $10k-25k, 44.8% for AGIs $25k-50k, 41.4% for AGIs $50k-75k, 43.7% for AGIs $75k-100k, 51.5% for AGIs over 100k)
Household received Food Stamps/SNAP in the past 12 months: 539 Household did not receive Food Stamps/SNAP in the past 12 months: 3,338
Women who had a birth in the past 12 months: 176 (154 now married, 24 unmarried) Women who did not have a birth in the past 12 months: 2,685 (1,337 now married, 1,340 unmarried)
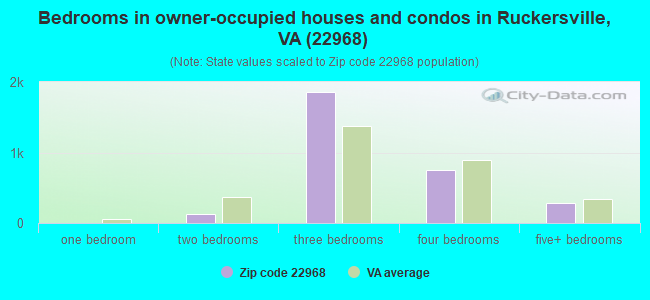
Housing units in zip code 22968 with a mortgage: 1,970 (134 second mortgage, 93 both second mortgage and home equity loan) Median monthly owner costs for units with a mortgage: $1,630 Median monthly owner costs for units without a mortgage: $535
Residents with income below the poverty level in 2022:
This zip code:
11.5%
Whole state:
10.6%
Residents with income below 50% of the poverty level in 2022:
This zip code:
8.3%
Whole state:
5.2%
Median number of rooms in houses and condos:
Here:
7.2
State:
7.0
Median number of rooms in apartments:
Here:
6.0
State:
4.3
Notable locations in this zip code not listed on our city pages
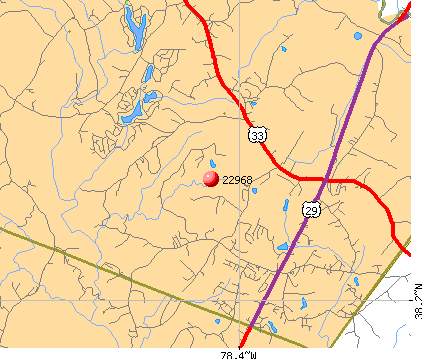
Notable locations in zip code 22968: Midway (A), Dunns Shop (B), North Fork Farms (C), Ruckersville Volunteer Fire Department (D). Display/hide their locations on the map
Churches in zip code 22968 include: Bethany Church (A), Cedar Grove Church (B), Spring Hill Church (C), Swift Run Church (D), First Bible Church (E), Westover Church (F), Mount Paran Church (G), Mount Zion Baptist Church (H), Mountain View Church (I). Display/hide their locations on the map
Cemeteries: Dundee Cemetery (1), Westover Cemetery (2), Spring Hill Cemetery (3), Mount Zion Cemetery (4), Ruckersville Cemetery (5). Display/hide their locations on the map
Reservoirs: Wildwood Valley Lake (A), Lower Lake Shenandoah (B), Lake Skyline (C), Lake Shenandoah (D), Reynolds Farm Pond (E), John Rucker Lake (F). Display/hide their locations on the map
Streams, rivers, and creeks: Welsh Run (A), Swift Run (B), Stanardsville Run (C), South River (D), Quarter Creek (E), Oil Creek (F), Marsh Run (G), Long Run (H), Elk Run (I). Display/hide their locations on the map
Size of family households: 1,317 2-persons, 501 3-persons, 597 4-persons, 414 5-persons, 134 6-persons, 40 7-or-more-persons
Size of nonfamily households: 616 1-person, 158 2-persons, 52 3-persons
1,845 married couples with children.
600 single-parent households (176 men, 424 women).
90.8% of residents of 22968 zip code speak English at home.
4.1% of residents speak Spanish at home (63% very well, 9% well, 7% not well, 21% not at all).
4.0% of residents speak other Indo-European language at home (70% very well, 29% well, 1% not well).
0.5% of residents speak Asian or Pacific Island language at home (27% very well, 73% well).
0.5% of residents speak other language at home (100% very well).
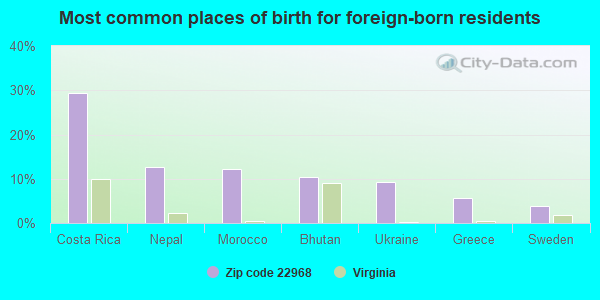
Foreign born population: 630 (5.7%) (51.4% of them are naturalized citizens)
This zip code:
5.7%
Whole state:
12.7%
29%Costa Rica
13%Nepal
12%Morocco
10%Bhutan
9%Ukraine
6%Greece
4%Sweden
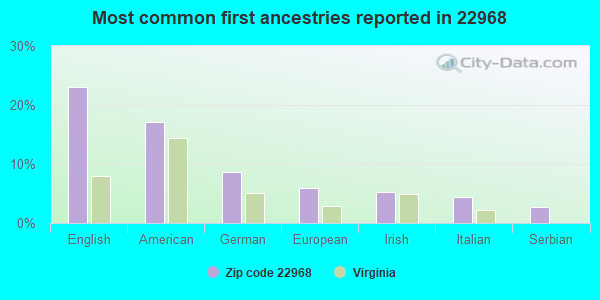
23%English
17%American
9%German
6%European
5%Irish
4%Italian
3%Serbian
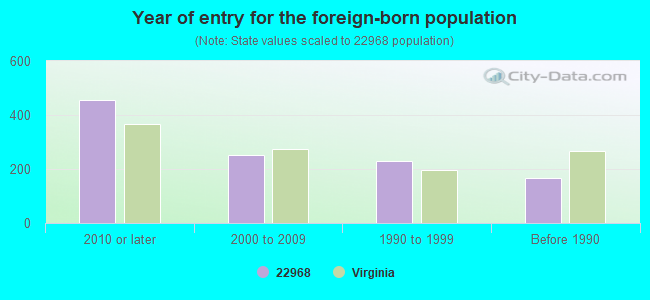
Year of entry for the foreign-born population
4572010 or later
2512000 to 2009
2301990 to 1999
166Before 1990
Facilities with environmental interests located in this zip code:
ALLIED CONCRETE COMPANY - RUCKERSVILLE (221 S LUCK STONE RD - RT 29 in RUCKERSVILLE, VA)
AIR MINOR (AIRS/AFS) STATE MASTER (Virginia pollutants databases) - CEDS-40733, AIR PROGRAM ENFORCEMENT/COMPLIANCE ACTIVITY (Integrated Compliance Information System) Business SIC classification: READY-MIXED CONCRETE Business NAICS classification: READY-MIX CONCRETE MANUFACTURING.
AMERICAN TOWER CORPORATION (ATC) (NW OF RTE 606 - PINEY MOUNTAIN in ADVANCE MILLS, VA)
AIR MINOR (AIRS/AFS) STATE MASTER (Virginia pollutants databases) - CEDS-40869, AIR PROGRAM Business SIC classification: TELEPHONE COMMUNICATIONS, EXCEPT RADIOTELEPHONE Business NAICS classification: WIRED TELECOMMUNICATIONS CARRIERS.
CARR SERVICE CENTER (994 CARPENTER MILL ROAD in RUCKERSVILLE, VA)
AIR MINOR (AIRS/AFS) Business SIC classification: MOTOR VEHICLE PARTS, USED; TOP, BODY, AND UPHOLSTERY REPAIR SHOPS AND PAINT SHOPS; AUTOMOTIVE REPAIR SHOPS
Housing units lacking complete plumbing facilities: 1.2% Housing units lacking complete kitchen facilities: 1.3%
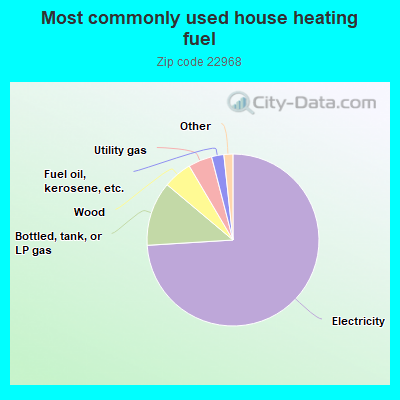
74.1%Electricity
12.1%Bottled, tank, or LP gas
5.4%Wood
4.5%Utility gas
2.3%Fuel oil, kerosene, etc.
0.7%No fuel used
0.7%Solar energy
Population in 1990: 5,764. Population change in the 1990s: +2,772 (+48.1%).
Place of birth for U.S.-born residents:
This state: 5,885
Northeast: 1,045
Midwest: 926
South: 1,480
West: 551
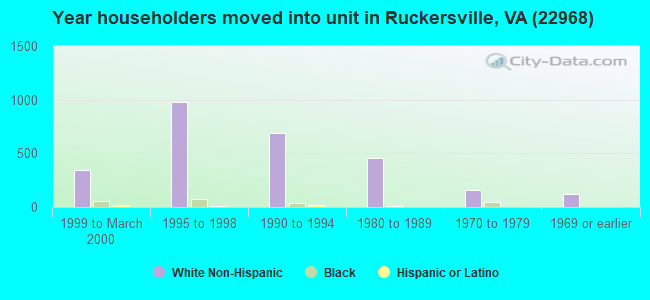
57% of the 22968 zip code residents lived in the same house 5 years ago. Out of people who lived in different houses, 35% lived in this county. Out of people who lived in different counties, 50% lived in Virginia.
93% of the 22968 zip code residents lived in the same house 1 year ago. Out of people who lived in different houses, 26% moved from this county. Out of people who lived in different houses, 68% moved from different county within same state. Out of people who lived in different houses, 9% moved from different state. Out of people who lived in different houses, 1% moved from abroad.
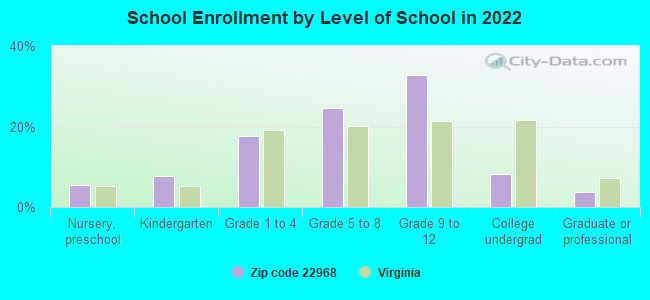
Private vs. public school enrollment:
Students in private schools in grades 1 to 8 (elementary and middle school): 115
Here:
9.8%
Virginia:
13.2%
Students in private schools in grades 9 to 12 (high school): 196
Here:
21.2%
Virginia:
10.2%
Students in private undergraduate colleges: 29
Here:
13.1%
Virginia:
18.7%
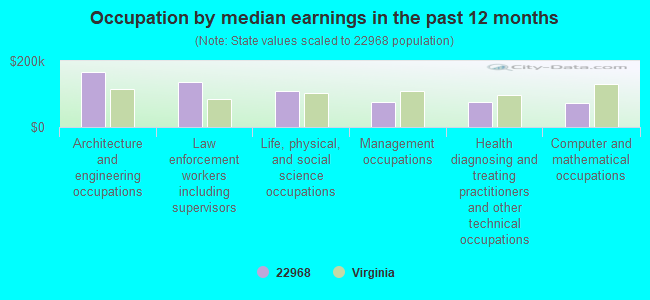
Occupation by median earnings in the past 12 months ($)
167,706Architecture and engineering occupations
137,375Law enforcement workers including supervisors
109,735Life, physical, and social science occupations
75,782Management occupations
74,748Health diagnosing and treating practitioners and other technical occupations
73,582Computer and mathematical occupations
Companies with federal contracts located in this zip code:
VIRGINIA COMMERCIAL SYSTEMS, I (27 INDUSTRIAL DRIVE in RUCKERSVILLE, VA; small business)
$3,730 with Navy for Maintenance, Repair or Alteration of Real Property -- Government-Owned Government-Operated (GOGO) R&D Facilities. Signed on 2000-10-01. Completion date: 2000-06-02.
Top industries in this zip code by the number of employees in 2005:
Other Services (except Public Administration): Drycleaning and Laundry Services (except Coin-Operated) (20-49: 1, 10-19: 1)
Health Care and Social Assistance: Child Day Care Services (20-49: 1, 1-4: 2)
Wholesale Trade: Other Electronic Parts and Equipment Merchant Wholesalers (20-49: 1)
People in group quarters in 2000:
49 people in nursing homes
27 people in other workers' dormitories
Fatal accident statistics in 2014:
Fatal accident count: 1
Vehicles involved in fatal accidents: 1
Fatal accidents caused by drunken drivers: 0
Fatalities: 1
Persons involved in fatal accidents: 1
Pedestrians involved in fatal accidents: 0
Fatal accident statistics in 2012:
Fatal accident count: 1
Vehicles involved in fatal accidents: 1
Fatal accidents caused by drunken drivers: 0
Fatalities: 1
Persons involved in fatal accidents: 1
Pedestrians involved in fatal accidents: 0
2002 - 2018 National Fire Incident Reporting System (NFIRS) incidents
According to the data from the years 2002 - 2018 the average number of fire incidents per year is 47. The highest number of reported fires - 67 took place in 2011, and the least - 24 in 2018. The data has a declining trend.
When looking into fire subcategories, the most reports belonged to: Structure Fires (42.9%), and Outside Fires (40.0%).
Fire incident types reported to NFIRS in Zip Code 22968

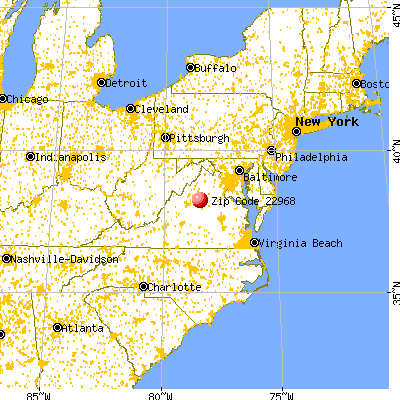


 Nearest zip codes: 22723, 22923, 22973, 22936, 22738, 22911.


 According to the data from the years 2002 - 2018 the average number of fire incidents per year is 47. The highest number of reported fires - 67 took place in 2011, and the least - 24 in 2018. The data has a declining trend.
 When looking into fire subcategories, the most reports belonged to: Structure Fires (42.9%), and Outside Fires (40.0%).