Estimated zip code population in 2022: 1,148 Zip code population in 2010: 1,300 Zip code population in 2000: 1,245
Houses and condos: 771 Renter-occupied apartments: 209
% of renters here:
37%
State:
33%
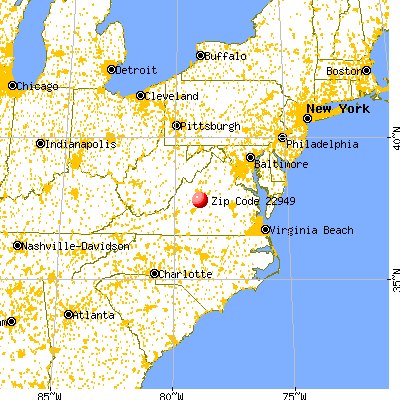
March 2022 cost of living index in zip code 22949: 84.6 (less than average, U.S. average is 100)
Land area: 36.8 sq. mi. Water area: 0.0 sq. mi.
Population density: 31 people per square mile
(very low).
OSM Map
General Map
Google Map
MSN Map
OSM Map
General Map
Google Map
MSN Map
OSM Map
General Map
Google Map
MSN Map
OSM Map
General Map
Google Map
MSN Map
Please wait while loading the map...
Real estate property taxes paid for housing units in 2022:
This zip code:
0.7% ($1,797)
Virginia:
0.7% ($2,617)
Median real estate property taxes paid for housing units with mortgages in 2022: $2,104 (0.8%) Median real estate property taxes paid for housing units with no mortgage in 2022: $1,647 (1.0%)
Business Search- 14 Million verified businesses
Males: 556
(48.5%)
Females: 591
(51.5%)
For population 25 years and over in 22949:
High school or higher: 84.6%
Bachelor's degree or higher: 22.8%
Graduate or professional degree: 5.9%
Mean travel time to work (commute): 32.3 minutes
For population 15 years and over in 22949:
Never married: 15.7%
Now married: 53.0%
Separated: 0.2%
Widowed: 16.8%
Divorced: 14.3%
Zip code 22949 compared to state average:
Median household income below state average.
Unemployed percentage significantly below state average.
Hispanic race population percentage significantly below state average.
Median age significantly above state average.
Foreign-born population percentage significantly below state average.
Length of stay since moving in significantly above state average.
Estimated median house/condo value in 2022: $260,446
22949:
$260,446
Virginia:
$365,700
According to our research of Virginia and other state lists, there were 3 registered sex offenders living in 22949 zip code as of June 09, 2024. The ratio of all residents to sex offenders in zip code 22949 is 395 to 1. The ratio of registered sex offenders to all residents in this zip code is near the state average.
Median resident age:
This zip code:
58.3 years
Virginia median age:
39.0 years
Average household size:
This zip code:
1.9 people
Virginia:
2.5 people
Averages for the 2020 tax year for zip code 22949, filed in 2021:
Average Adjusted Gross Income (AGI) in 2020: $65,099 (Individual Income Tax Returns)
Here:
$65,099
State:
$86,446
Salary/wage: $50,053 (reported on 76.4% of returns)
Here:
$50,053
State:
$71,185
(% of AGI for various income ranges: 1136.5% for AGIs below $25k, 3332.7% for AGIs $25k-50k, 5643.8% for AGIs $50k-75k, 8877.5% for AGIs $75k-100k, 19502.5% for AGIs $100k-200k)
Taxable interest for individuals: $1,148 (reported on 31.9% of returns)
This zip code:
$1,148
Virginia:
$1,805
(% of AGI for various income ranges: 14.7% for AGIs below $25k, 26.7% for AGIs $25k-50k, 108.7% for AGIs $50k-75k, 85.0% for AGIs $75k-100k, 70.0% for AGIs $100k-200k)
Ordinary dividends: $10,300 (reported on 20.8% of returns)
Here:
$10,300
State:
$8,327
(% of AGI for various income ranges: 54.7% for AGIs below $25k, 34.7% for AGIs $25k-50k, 433.8% for AGIs $50k-75k, 2632.5% for AGIs $100k-200k)
Net capital gain/loss in AGI: +$39,342 (reported on 16.7% of returns)
Here:
+$39,342
State:
+$24,644
(% of AGI for various income ranges: 12.9% for AGIs below $25k, 181.2% for AGIs $50k-75k, 285.0% for AGIs $100k-200k)
Profit/loss from business: +$7,800 (reported on 15.3% of returns)
Here:
+$7,800
State:
+$12,836
(% of AGI for various income ranges: 175.9% for AGIs below $25k, 213.3% for AGIs $25k-50k, 597.5% for AGIs $75k-100k)
Taxable individual retirement arrangement distribution: $14,929 (reported on 9.7% of returns)
22949:
$14,929
Virginia:
$21,535
(% of AGI for various income ranges: 301.3% for AGIs $25k-50k, 1482.5% for AGIs $75k-100k)
Total itemized deductions: $33,333 (reported on 4.2% of returns)
Here:
$33,333
State:
$33,287
(% of AGI for various income ranges: 2500.0% for AGIs $100k-200k)
Charity contributions: $8,900 (reported on 2.8% of returns)
Here:
$8,900
State:
$10,381
(% of AGI for various income ranges: 222.5% for AGIs $50k-75k)
Taxes paid: $7,233 (reported on 4.2% of returns)
22949:
$7,233
State:
$8,284
(% of AGI for various income ranges: 542.5% for AGIs $100k-200k)
Earned income credit: $2,209 (reported on 15.3% of returns)
Here:
$2,209
State:
$2,214
(% of AGI for various income ranges: 87.1% for AGIs below $25k, 63.3% for AGIs $25k-50k)
Percentage of individuals using paid preparers for their 2020 taxes: 91.7%
Here:
92%
State:
92%
(% for various income ranges: 91.3% for AGIs below $25k, 89.5% for AGIs $25k-50k, 100.0% for AGIs $50k-75k, 85.7% for AGIs $75k-100k, 87.5% for AGIs $100k-200k, 100.0% for AGIs over 200k)
Averages for the 2012 tax year for zip code 22949, filed in 2013:
Average Adjusted Gross Income (AGI) in 2012: $55,142 (Individual Income Tax Returns)
Here:
$55,142
State:
$71,192
Salary/wage: $44,218 (reported on 79.2% of returns)
Here:
$44,218
State:
$59,229
(% of AGI for various income ranges: 70.1% for AGIs below $25k, 71.4% for AGIs $25k-50k, 70.2% for AGIs $50k-75k, 70.9% for AGIs $75k-100k, 53.6% for AGIs $100k-200k)
Taxable interest for individuals: $1,221 (reported on 38.9% of returns)
This zip code:
$1,221
Virginia:
$1,600
(% of AGI for various income ranges: 2.6% for AGIs below $25k, 1.2% for AGIs $25k-50k, 1.0% for AGIs $50k-75k, 0.6% for AGIs $75k-100k, 0.4% for AGIs $100k-200k)
Ordinary dividends: $3,806 (reported on 22.2% of returns)
Here:
$3,806
State:
$6,959
(% of AGI for various income ranges: 1.7% for AGIs below $25k, 2.2% for AGIs $25k-50k, 0.9% for AGIs $50k-75k, 1.0% for AGIs $75k-100k, 1.8% for AGIs $100k-200k)
Net capital gain/loss in AGI: +$8,823 (reported on 18.1% of returns)
Here:
+$8,823
State:
+$16,672
(% of AGI for various income ranges: 0.3% for AGIs below $25k, 0.8% for AGIs $25k-50k, 1.5% for AGIs $50k-75k, 5.9% for AGIs $100k-200k)
Profit/loss from business: +$10,554 (reported on 18.1% of returns)
Here:
+$10,554
State:
+$14,116
(% of AGI for various income ranges: 8.6% for AGIs below $25k, 8.8% for AGIs $25k-50k, 8.1% for AGIs $75k-100k)
Taxable individual retirement arrangement distribution: $10,056 (reported on 12.5% of returns)
22949:
$10,056
Virginia:
$16,667
Total itemized deductions: $21,455 (21% of AGI, reported on 30.6% of returns)
Here:
$21,455
State:
$26,596
Here:
20.6% of AGI
State:
20.1% of AGI
(% of AGI for various income ranges: 12.0% for AGIs below $25k, 9.4% for AGIs $25k-50k, 13.0% for AGIs $50k-75k, 11.0% for AGIs $75k-100k, 12.7% for AGIs $100k-200k)
Charity contributions: $4,635 (reported on 23.6% of returns)
Here:
$4,635
State:
$4,443
(% of AGI for various income ranges: 1.4% for AGIs $25k-50k, 2.2% for AGIs $50k-75k, 1.7% for AGIs $75k-100k, 2.7% for AGIs $100k-200k)
Taxes paid: $6,681 (reported on 29.2% of returns)
22949:
$6,681
State:
$9,951
(% of AGI for various income ranges: 1.7% for AGIs below $25k, 1.8% for AGIs $25k-50k, 3.1% for AGIs $50k-75k, 3.6% for AGIs $75k-100k, 4.7% for AGIs $100k-200k)
Earned income credit: $1,950 (reported on 19.4% of returns)
Here:
$1,950
State:
$2,211
(% of AGI for various income ranges: 5.6% for AGIs below $25k, 1.3% for AGIs $25k-50k)
Percentage of individuals using paid preparers for their 2012 taxes: 52.8%
Here:
53%
State:
46%
(% for various income ranges: 46.4% for AGIs below $25k, 58.8% for AGIs $25k-50k, 54.5% for AGIs $50k-75k, 62.5% for AGIs $75k-100k, 50.0% for AGIs $100k-200k)
Averages for the 2004 tax year for zip code 22949, filed in 2005:
Average Adjusted Gross Income (AGI) in 2004: $40,450 (Individual Income Tax Returns)
Here:
$40,450
State:
$56,704
Salary/wage: $34,949 (reported on 82.9% of returns)
Here:
$34,949
State:
$48,441
(% of AGI for various income ranges: 86.2% for AGIs below $10k, 77.3% for AGIs $10k-25k, 77.1% for AGIs $25k-50k, 76.5% for AGIs $50k-75k, 80.7% for AGIs $75k-100k, 53.6% for AGIs over 100k)
Taxable interest for individuals: $1,513 (reported on 43.6% of returns)
This zip code:
$1,513
Virginia:
$1,688
(% of AGI for various income ranges: 5.6% for AGIs below $10k, 1.6% for AGIs $10k-25k, 2.3% for AGIs $25k-50k, 1.3% for AGIs $50k-75k, 0.6% for AGIs $75k-100k, 1.5% for AGIs over 100k)
Taxable dividends: $2,214 (reported on 25.7% of returns)
Here:
$2,214
State:
$4,028
(% of AGI for various income ranges: 5.9% for AGIs below $10k, 0.9% for AGIs $10k-25k, 0.9% for AGIs $25k-50k, 1.1% for AGIs $50k-75k, 0.2% for AGIs $75k-100k, 2.7% for AGIs over 100k)
Net capital gain/loss: +$5,792 (reported on 17.7% of returns)
Here:
+$5,792
State:
+$14,375
(% of AGI for various income ranges: 3.8% for AGIs below $10k, 0.6% for AGIs $10k-25k, 0.8% for AGIs $25k-50k, -0.3% for AGIs $50k-75k, 3.2% for AGIs $75k-100k, 6.9% for AGIs over 100k)
Profit/loss from business: +$10,202 (reported on 17.5% of returns)
Here:
+$10,202
State:
+$13,342
(% of AGI for various income ranges: 16.9% for AGIs below $10k, 6.3% for AGIs $10k-25k, 5.0% for AGIs $25k-50k, 2.0% for AGIs $50k-75k, 9.2% for AGIs $75k-100k, 1.4% for AGIs over 100k)
IRA payment deduction: $2,611 (reported on 2.5% of returns)
22949:
$2,611
Virginia:
$2,943
Total itemized deductions: $16,289 (21% of AGI, reported on 27.4% of returns)
Here:
$16,289
State:
$21,492
Here:
21.1% of AGI
State:
21.0% of AGI
(% of AGI for various income ranges: 7.4% for AGIs $10k-25k, 9.8% for AGIs $25k-50k, 10.3% for AGIs $50k-75k, 11.7% for AGIs $75k-100k, 14.9% for AGIs over 100k)
Charity contributions deductions: $2,808 (3% of AGI, reported on 22.1% of returns)
Here:
$2,808
State:
$3,794
Here:
3.4% of AGI
State:
3.5% of AGI
(% of AGI for various income ranges: 0.4% for AGIs $10k-25k, 0.8% for AGIs $25k-50k, 1.5% for AGIs $50k-75k, 2.2% for AGIs $75k-100k, 2.4% for AGIs over 100k)
Total tax: $5,322 (reported on 77.2% of returns)
22949:
$5,322
State:
$9,537
(% of AGI for various income ranges: 3.6% for AGIs below $10k, 4.3% for AGIs $10k-25k, 7.1% for AGIs $25k-50k, 9.4% for AGIs $50k-75k, 11.3% for AGIs $75k-100k, 16.0% for AGIs over 100k)
Earned income credit: $1,610 (reported on 16.7% of returns)
Here:
$1,610
State:
$1,734
Percentage of individuals using paid preparers for their 2004 taxes: 56.7%
Here:
57%
State:
52%
(% for various income ranges: 46.0% for AGIs below $10k, 56.6% for AGIs $10k-25k, 59.2% for AGIs $25k-50k, 63.4% for AGIs $50k-75k, 64.0% for AGIs $75k-100k, 56.5% for AGIs over 100k)
Likely homosexual households (counted as self-reported same-sex unmarried-partner households)
Lesbian couples: 0.0% of all households
Gay men: 1.5% of all households
Household received Food Stamps/SNAP in the past 12 months: 158 Household did not receive Food Stamps/SNAP in the past 12 months: 421
Women who had a birth in the past 12 months: 20 (21 now married, 0 unmarried) Women who did not have a birth in the past 12 months: 146 (65 now married, 80 unmarried)
Housing units in zip code 22949 with a mortgage: 217 (69 second mortgage, 12 home equity loan, 58 both second mortgage and home equity loan) Median monthly owner costs for units with a mortgage: $1,982 Median monthly owner costs for units without a mortgage: $411
Residents with income below the poverty level in 2022:
This zip code:
21.3%
Whole state:
10.6%
Residents with income below 50% of the poverty level in 2022:
This zip code:
16.9%
Whole state:
5.2%
Median number of rooms in houses and condos:
Here:
6.2
State:
7.0
Median number of rooms in apartments:
Here:
3.1
State:
4.3
Notable locations in this zip code not listed on our city pages
Churches in zip code 22949 include: Calvary Church (A), Poplar Flat Baptist Church (B), Ridgecrest Baptist Church (C), Oak Hill Church (D). Display/hide their locations on the map
Tourist attraction (not listed on the city page) : Nelson Memorial Branch Jeffersomadison Regnl Lbrry (Cultural Attractions- Events- & Facilities; 8521 Thomas Nelson Highway) (1). Display/hide its approximate location on the map
In group quarters: 60 (-1 institutionalized population)
Size of family households: 195 2-persons, 50 3-persons, 6 4-persons, 6 5-persons, 9 6-persons
Size of nonfamily households: 214 1-person, 86 2-persons
150 married couples with children.
8 single-parent households (8 women).
99.9% of residents of 22949 zip code speak English at home.
0.1% of residents speak Spanish at home (100% well).
Foreign born population: 0 (0.0%)
:
0.0%
Whole state:
12.7%
28%American
15%German
6%Irish
6%Scotch-Irish
3%English
3%European
2%Italian
Facilities with environmental interests located in this zip code:
CENTRAL VIRGINIA ELECTRIC COOPERATIVE (FRONT ST in LOVINGSTON, VA)
AIR SYNTHETIC MINOR (AIRS/AFS) STATE MASTER (Virginia pollutants databases) - CEDS-40819, AIR PROGRAM (Integrated Compliance Information System) - ICIS-03-1988-0046, FORMAL ENFORCEMENT ACTION COMPLIANCE ACTIVITY (Tracking inspections of insecticide, fungicide, and rodenticide, and toxic substances) CRITERIA AND HAZARDOUS AIR POLLUTANT INVENTORY (Inventory of air pollution sources) Business SIC classification: ELECTRIC SERVICES Business NAICS classification: FOSSIL FUEL ELECTRIC POWER GENERATION.
CHESAPEAKE & POTOMAC TELEPHONE CO (U S RT 29 in LOVINGSTON, VA)
Housing units lacking complete kitchen facilities: 6.6%
78.6%Electricity
15.6%Bottled, tank, or LP gas
4.6%Wood
1.6%Utility gas
Population in 1990: 1,459.
Place of birth for U.S.-born residents:
This state: 754
Northeast: 95
Midwest: 77
South: 185
West: 29
52% of the 22949 zip code residents lived in the same house 5 years ago. Out of people who lived in different houses, 44% lived in this county. Out of people who lived in different counties, 50% lived in Virginia.
95% of the 22949 zip code residents lived in the same house 1 year ago. Out of people who lived in different houses, 112% moved from different county within same state.
Private vs. public school enrollment:
Students in private schools in grades 1 to 8 (elementary and middle school): 12
Here:
24.2%
Virginia:
13.2%
Students in private undergraduate colleges:
Here:
0.0%
Virginia:
18.7%
Occupation by median earnings in the past 12 months ($)
165,292Management occupations
59,816Education, training, and library occupations
38,749Health diagnosing and treating practitioners and other technical occupations
30,107Office and administrative support occupations
Top industries in this zip code by the number of employees in 2005:
Health Care and Social Assistance: Nursing Care Facilities (50-99 employees: 1 establishment)
Accommodation and Food Services: Full-Service Restaurants (20-49: 1, 10-19: 1)
Accommodation and Food Services: Limited-Service Restaurants (20-49: 1, 1-4: 3)
Professional, Scientific, and Technical Services: Offices of Lawyers (10-19: 1, 1-4: 2)
Health Care and Social Assistance: Services for the Elderly and Persons with Disabilities (10-19: 1, 1-4: 2)
Information: Cable and Other Program Distribution (10-19: 1, 1-4: 1)
People in group quarters in 2010:
60 people in nursing facilities/skilled-nursing facilities
People in group quarters in 2000:
59 people in nursing homes
7 people in agriculture workers' dormitories on farms
6 people in unknown juvenile institutions
Fatal accident statistics in 2012:
Fatal accident count: 1
Vehicles involved in fatal accidents: 3
Fatal accidents caused by drunken drivers: 0
Fatalities: 1
Persons involved in fatal accidents: 3
Pedestrians involved in fatal accidents: 0
2004 - 2018 National Fire Incident Reporting System (NFIRS) incidents
Based on the data from the years 2004 - 2018 the average number of fire incidents per year is 10. The highest number of fires - 21 took place in 2008, and the least - 1 in 2018. The data has a decreasing trend.
When looking into fire subcategories, the most reports belonged to: Structure Fires (46.9%), and Outside Fires (29.9%).
Fire incident types reported to NFIRS in Zip Code 22949


 Nearest zip codes: 22971, 22922, 22958, 22938, 22964, 22967.


 Based on the data from the years 2004 - 2018 the average number of fire incidents per year is 10. The highest number of fires - 21 took place in 2008, and the least - 1 in 2018. The data has a decreasing trend.
 When looking into fire subcategories, the most reports belonged to: Structure Fires (46.9%), and Outside Fires (29.9%).