Estimated zip code population in 2022: 2,034 Zip code population in 2010: 1,637 Zip code population in 2000: 1,637
Houses and condos: 3,109 Renter-occupied apartments: 166
% of renters here:
16%
State:
33%
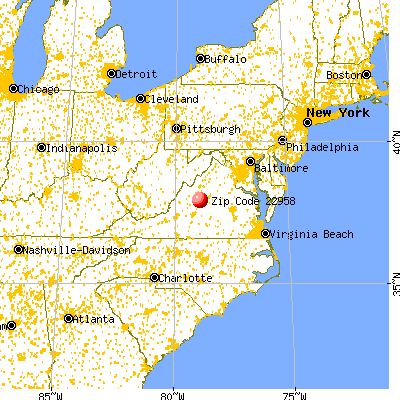
March 2022 cost of living index in zip code 22958: 88.2 (less than average, U.S. average is 100)
Land area: 29.1 sq. mi. Water area: 0.1 sq. mi.
Population density: 70 people per square mile
(very low).
OSM Map
General Map
Google Map
MSN Map
OSM Map
General Map
Google Map
MSN Map
OSM Map
General Map
Google Map
MSN Map
OSM Map
General Map
Google Map
MSN Map
Please wait while loading the map...
Real estate property taxes paid for housing units in 2022:
This zip code:
0.6% ($3,170)
Virginia:
0.7% ($2,617)
Median real estate property taxes paid for housing units with mortgages in 2022: $3,734 (0.6%) Median real estate property taxes paid for housing units with no mortgage in 2022: $2,629 (0.5%)
Business Search- 14 Million verified businesses
Males: 1,109
(54.5%)
Females: 925
(45.5%)
For population 25 years and over in 22958:
High school or higher: 97.9%
Bachelor's degree or higher: 62.3%
Graduate or professional degree: 31.9%
Unemployed: 5.5%
Mean travel time to work (commute): 22.9 minutes
For population 15 years and over in 22958:
Never married: 7.0%
Now married: 72.7%
Separated: 0.5%
Widowed: 9.9%
Divorced: 10.0%
Zip code 22958 compared to state average:
Black race population percentage below state average.
Median age significantly above state average.
Foreign-born population percentage significantly below state average.
Renting percentage below state average.
Length of stay since moving in significantly above state average.
Number of college students significantly below state average.
Percentage of population with a bachelor's degree or higher above state average.
Estimated median house/condo value in 2022: $515,940
22958:
$515,940
Virginia:
$365,700
According to our research of Virginia and other state lists, there were 2 registered sex offenders living in 22958 zip code as of June 09, 2024. The ratio of all residents to sex offenders in zip code 22958 is 1,154 to 1. The ratio of registered sex offenders to all residents in this zip code is much lower than the state average.
Median resident age:
This zip code:
65.2 years
Virginia median age:
39.0 years
Average household size:
This zip code:
1.9 people
Virginia:
2.5 people
Averages for the 2020 tax year for zip code 22958, filed in 2021:
Average Adjusted Gross Income (AGI) in 2020: $100,861 (Individual Income Tax Returns)
Here:
$100,861
State:
$86,446
Salary/wage: $61,631 (reported on 58.7% of returns)
Here:
$61,631
State:
$71,185
(% of AGI for various income ranges: 1004.1% for AGIs below $25k, 2809.2% for AGIs $25k-50k, 4701.2% for AGIs $50k-75k, 6282.0% for AGIs $75k-100k, 8021.4% for AGIs $100k-200k, 39882.5% for AGIs over 200k)
Taxable interest for individuals: $1,868 (reported on 54.1% of returns)
This zip code:
$1,868
Virginia:
$1,805
(% of AGI for various income ranges: 24.1% for AGIs below $25k, 56.9% for AGIs $25k-50k, 92.5% for AGIs $50k-75k, 260.0% for AGIs $75k-100k, 189.3% for AGIs $100k-200k, 1295.0% for AGIs over 200k)
Ordinary dividends: $12,031 (reported on 46.8% of returns)
Here:
$12,031
State:
$8,327
(% of AGI for various income ranges: 91.8% for AGIs below $25k, 233.1% for AGIs $25k-50k, 505.0% for AGIs $50k-75k, 1422.0% for AGIs $75k-100k, 1653.6% for AGIs $100k-200k, 5617.5% for AGIs over 200k)
Net capital gain/loss in AGI: +$24,398 (reported on 42.2% of returns)
Here:
+$24,398
State:
+$24,644
(% of AGI for various income ranges: 1.2% for AGIs below $25k, 150.8% for AGIs $25k-50k, 321.2% for AGIs $50k-75k, 1200.0% for AGIs $75k-100k, 1787.1% for AGIs $100k-200k, 19165.0% for AGIs over 200k)
Profit/loss from business: +$22,605 (reported on 18.3% of returns)
Here:
+$22,605
State:
+$12,836
(% of AGI for various income ranges: 197.6% for AGIs below $25k, 430.8% for AGIs $25k-50k, 1674.0% for AGIs $75k-100k, 507.1% for AGIs $100k-200k, 5195.0% for AGIs over 200k)
Taxable individual retirement arrangement distribution: $31,660 (reported on 27.5% of returns)
22958:
$31,660
Virginia:
$21,535
(% of AGI for various income ranges: 137.6% for AGIs below $25k, 307.7% for AGIs $25k-50k, 770.0% for AGIs $50k-75k, 2184.0% for AGIs $75k-100k, 3320.0% for AGIs $100k-200k, 6270.0% for AGIs over 200k)
Total itemized deductions: $36,158 (reported on 17.4% of returns)
Here:
$36,158
State:
$33,287
(% of AGI for various income ranges: 1327.5% for AGIs $50k-75k, 1502.0% for AGIs $75k-100k, 2042.9% for AGIs $100k-200k, 5492.5% for AGIs over 200k)
Charity contributions: $10,332 (reported on 17.4% of returns)
Here:
$10,332
State:
$10,381
(% of AGI for various income ranges: 73.8% for AGIs $25k-50k, 370.0% for AGIs $75k-100k, 518.6% for AGIs $100k-200k, 2390.0% for AGIs over 200k)
Taxes paid: $8,153 (reported on 17.4% of returns)
22958:
$8,153
State:
$8,284
(% of AGI for various income ranges: 196.2% for AGIs $50k-75k, 402.0% for AGIs $75k-100k, 489.3% for AGIs $100k-200k, 1265.0% for AGIs over 200k)
Earned income credit: $1,950 (reported on 5.5% of returns)
Here:
$1,950
State:
$2,214
(% of AGI for various income ranges: 42.4% for AGIs below $25k, 34.6% for AGIs $25k-50k)
Percentage of individuals using paid preparers for their 2020 taxes: 91.7%
Here:
92%
State:
92%
(% for various income ranges: 92.0% for AGIs below $25k, 88.9% for AGIs $25k-50k, 92.3% for AGIs $50k-75k, 91.7% for AGIs $75k-100k, 92.9% for AGIs $100k-200k, 92.3% for AGIs over 200k)
Averages for the 2012 tax year for zip code 22958, filed in 2013:
Average Adjusted Gross Income (AGI) in 2012: $80,199 (Individual Income Tax Returns)
Here:
$80,199
State:
$71,192
Salary/wage: $49,717 (reported on 64.6% of returns)
Here:
$49,717
State:
$59,229
(% of AGI for various income ranges: 66.6% for AGIs below $25k, 56.6% for AGIs $25k-50k, 44.1% for AGIs $50k-75k, 43.4% for AGIs $75k-100k, 33.3% for AGIs $100k-200k, 37.1% for AGIs over 200k)
Taxable interest for individuals: $1,798 (reported on 56.6% of returns)
This zip code:
$1,798
Virginia:
$1,600
(% of AGI for various income ranges: 3.1% for AGIs below $25k, 2.1% for AGIs $25k-50k, 1.9% for AGIs $50k-75k, 1.1% for AGIs $75k-100k, 1.3% for AGIs $100k-200k, 0.5% for AGIs over 200k)
Ordinary dividends: $8,080 (reported on 46.5% of returns)
Here:
$8,080
State:
$6,959
(% of AGI for various income ranges: 4.8% for AGIs below $25k, 4.2% for AGIs $25k-50k, 3.8% for AGIs $50k-75k, 2.3% for AGIs $75k-100k, 5.5% for AGIs $100k-200k, 5.2% for AGIs over 200k)
Net capital gain/loss in AGI: +$5,700 (reported on 45.5% of returns)
Here:
+$5,700
State:
+$16,672
(% of AGI for various income ranges: 1.0% for AGIs $50k-75k, 0.1% for AGIs $75k-100k, 3.0% for AGIs $100k-200k, 7.6% for AGIs over 200k)
Profit/loss from business: +$19,853 (reported on 19.2% of returns)
Here:
+$19,853
State:
+$14,116
(% of AGI for various income ranges: 10.9% for AGIs below $25k, 7.0% for AGIs $25k-50k, 4.0% for AGIs $50k-75k, 2.4% for AGIs $100k-200k, 8.9% for AGIs over 200k)
Taxable individual retirement arrangement distribution: $28,352 (reported on 27.3% of returns)
22958:
$28,352
Virginia:
$16,667
(% of AGI for various income ranges: 6.0% for AGIs below $25k, 5.2% for AGIs $25k-50k, 10.0% for AGIs $50k-75k, 10.2% for AGIs $75k-100k, 11.6% for AGIs $100k-200k, 8.4% for AGIs over 200k)
Self-employment retirement plans: $19,100 (reported on 2.0% of returns)
22958:
$19,100
Virginia:
$25,373
Total itemized deductions: $27,070 (23% of AGI, reported on 53.5% of returns)
Here:
$27,070
State:
$26,596
Here:
23.3% of AGI
State:
20.1% of AGI
(% of AGI for various income ranges: 24.1% for AGIs below $25k, 23.7% for AGIs $25k-50k, 19.5% for AGIs $50k-75k, 16.7% for AGIs $75k-100k, 18.0% for AGIs $100k-200k, 15.6% for AGIs over 200k)
Charity contributions: $4,302 (reported on 48.5% of returns)
Here:
$4,302
State:
$4,443
(% of AGI for various income ranges: 1.5% for AGIs below $25k, 2.1% for AGIs $25k-50k, 1.8% for AGIs $50k-75k, 2.0% for AGIs $75k-100k, 2.8% for AGIs $100k-200k, 3.3% for AGIs over 200k)
Taxes paid: $8,889 (reported on 53.5% of returns)
22958:
$8,889
State:
$9,951
(% of AGI for various income ranges: 4.5% for AGIs below $25k, 3.7% for AGIs $25k-50k, 4.8% for AGIs $50k-75k, 5.4% for AGIs $75k-100k, 6.3% for AGIs $100k-200k, 7.0% for AGIs over 200k)
Earned income credit: $1,638 (reported on 8.1% of returns)
Here:
$1,638
State:
$2,211
(% of AGI for various income ranges: 3.8% for AGIs below $25k)
Percentage of individuals using paid preparers for their 2012 taxes: 53.5%
Here:
54%
State:
46%
(% for various income ranges: 50.0% for AGIs below $25k, 52.9% for AGIs $25k-50k, 53.8% for AGIs $50k-75k, 58.3% for AGIs $75k-100k, 50.0% for AGIs $100k-200k, 71.4% for AGIs over 200k)
Averages for the 2004 tax year for zip code 22958, filed in 2005:
Average Adjusted Gross Income (AGI) in 2004: $68,117 (Individual Income Tax Returns)
Here:
$68,117
State:
$56,704
Salary/wage: $45,015 (reported on 70.5% of returns)
Here:
$45,015
State:
$48,441
(% of AGI for various income ranges: 126.9% for AGIs below $10k, 68.2% for AGIs $10k-25k, 68.6% for AGIs $25k-50k, 45.3% for AGIs $50k-75k, 32.1% for AGIs $75k-100k, 43.7% for AGIs over 100k)
Taxable interest for individuals: $2,369 (reported on 60.1% of returns)
This zip code:
$2,369
Virginia:
$1,688
(% of AGI for various income ranges: 13.6% for AGIs below $10k, 3.1% for AGIs $10k-25k, 1.7% for AGIs $25k-50k, 2.3% for AGIs $50k-75k, 2.0% for AGIs $75k-100k, 2.0% for AGIs over 100k)
Taxable dividends: $6,143 (reported on 44.0% of returns)
Here:
$6,143
State:
$4,028
(% of AGI for various income ranges: 15.2% for AGIs below $10k, 4.0% for AGIs $10k-25k, 2.9% for AGIs $25k-50k, 4.3% for AGIs $50k-75k, 4.7% for AGIs $75k-100k, 3.8% for AGIs over 100k)
Net capital gain/loss: +$14,803 (reported on 39.5% of returns)
Here:
+$14,803
State:
+$14,375
(% of AGI for various income ranges: -18.9% for AGIs below $10k, -0.2% for AGIs $10k-25k, 0.5% for AGIs $25k-50k, 2.5% for AGIs $50k-75k, 3.0% for AGIs $75k-100k, 14.3% for AGIs over 100k)
Profit/loss from business: +$20,310 (reported on 19.5% of returns)
Here:
+$20,310
State:
+$13,342
(% of AGI for various income ranges: 0.0% for AGIs below $10k, 11.4% for AGIs $10k-25k, 7.4% for AGIs $25k-50k, 4.3% for AGIs $50k-75k, 7.3% for AGIs $75k-100k, 5.0% for AGIs over 100k)
IRA payment deduction: $3,612 (reported on 5.7% of returns)
22958:
$3,612
Virginia:
$2,943
(% of AGI for various income ranges: 1.8% for AGIs $10k-25k, 0.5% for AGIs $50k-75k, 0.4% for AGIs $75k-100k, 0.2% for AGIs over 100k)
Self-employed pension: $14,125 (reported on 1.9% of returns)
Here:
$14,125
Virginia:
$17,430
Total itemized deductions: $20,986 (20% of AGI, reported on 49.2% of returns)
Here:
$20,986
State:
$21,492
Here:
19.9% of AGI
State:
21.0% of AGI
(% of AGI for various income ranges: 49.2% for AGIs below $10k, 18.8% for AGIs $10k-25k, 14.4% for AGIs $25k-50k, 18.3% for AGIs $50k-75k, 18.0% for AGIs $75k-100k, 13.2% for AGIs over 100k)
Charity contributions deductions: $3,893 (3% of AGI, reported on 42.4% of returns)
Here:
$3,893
State:
$3,794
Here:
3.5% of AGI
State:
3.5% of AGI
(% of AGI for various income ranges: 3.4% for AGIs below $10k, 1.5% for AGIs $10k-25k, 1.5% for AGIs $25k-50k, 2.0% for AGIs $50k-75k, 3.3% for AGIs $75k-100k, 2.5% for AGIs over 100k)
Total tax: $11,665 (reported on 82.9% of returns)
22958:
$11,665
State:
$9,537
(% of AGI for various income ranges: 7.4% for AGIs below $10k, 5.1% for AGIs $10k-25k, 7.6% for AGIs $25k-50k, 9.6% for AGIs $50k-75k, 11.8% for AGIs $75k-100k, 18.1% for AGIs over 100k)
Earned income credit: $1,313 (reported on 9.7% of returns)
Here:
$1,313
State:
$1,734
Percentage of individuals using paid preparers for their 2004 taxes: 52.2%
Here:
52%
State:
52%
(% for various income ranges: 49.3% for AGIs below $10k, 49.3% for AGIs $10k-25k, 53.5% for AGIs $25k-50k, 53.2% for AGIs $50k-75k, 54.9% for AGIs $75k-100k, 53.4% for AGIs over 100k)
Household received Food Stamps/SNAP in the past 12 months: 71 Household did not receive Food Stamps/SNAP in the past 12 months: 988
Women who had a birth in the past 12 months: 31 (32 now married, 0 unmarried) Women who did not have a birth in the past 12 months: 132 (71 now married, 60 unmarried)
Housing units in zip code 22958 with a mortgage: 425 (37 second mortgage, 36 both second mortgage and home equity loan) Houses without a mortgage: 23
Median monthly owner costs for units with a mortgage: $2,509 Median monthly owner costs for units without a mortgage: $720
Residents with income below the poverty level in 2022:
This zip code:
15.5%
Whole state:
10.6%
Residents with income below 50% of the poverty level in 2022:
This zip code:
9.7%
Whole state:
5.2%
Median number of rooms in houses and condos:
Here:
7.1
State:
7.0
Median number of rooms in apartments:
Here:
6.0
State:
4.3
Notable locations in this zip code not listed on our city pages
Rivers and creeks: Stony Creek (A), Spruce Creek (B), South Fork Rockfish River (C), Reids Creek (D), Little Creek (E), Allen Creek (F). Display/hide their locations on the map
Size of family households: 596 2-persons, 143 3-persons, 4 5-persons, 33 7-or-more-persons
Size of nonfamily households: 276 1-person, 17 2-persons
119 married couples with children.
0 single-parent households ().
97.7% of residents of 22958 zip code speak English at home.
3.7% of residents speak Spanish at home (100% very well).
0.3% of residents speak other Indo-European language at home (100% very well).
Foreign born population: 73 (3.6%) (66.4% of them are naturalized citizens)
This zip code:
3.6%
Whole state:
12.7%
33%Honduras
22%Haiti
11%Australia
10%France
26%English
13%Irish
12%German
5%European
4%Italian
3%British
3%American
Year of entry for the foreign-born population
02010 or later
252000 to 2009
191990 to 1999
24Before 1990
Facilities with environmental interests located in this zip code:
CENTRAL VA SERVICES - VALLEY GREEN SHOPPING CTR (2797 ROCKFISH VALLEY HWY in NELLYSFORD, VA)
AIR SYNTHETIC MINOR (AIRS/AFS) STATE MASTER (Virginia pollutants databases) - CEDS-40978, AIR PROGRAM CRITERIA AND HAZARDOUS AIR POLLUTANT INVENTORY (Inventory of air pollution sources) Business SIC classification: ELECTRIC SERVICES Business NAICS classification: FOSSIL FUEL ELECTRIC POWER GENERATION.
CENTRAL VIRGINIA SERVICES, INC.-WINTERGREEN (WINTERGREEN GOLF MAINTENANCE BLDG4500 WINTERGREEN in NELLYSFORD, VA)
AIR SYNTHETIC MINOR (AIRS/AFS) STATE MASTER (Virginia pollutants databases) - CEDS-40981, AIR PROGRAM CRITERIA AND HAZARDOUS AIR POLLUTANT INVENTORY (Inventory of air pollution sources) Business SIC classification: STEAM, GAS, AND HYDRAULIC TURBINES, AND TURBINE GENERATOR SET UNITS; ELECTRIC SERVICES; AMUSEMENT AND RECREATION SERVICES Business NAICS classification: FOSSIL FUEL ELECTRIC POWER GENERATION.
CHESAPEAKE & POTOMAC TELEPHONE CO (WINTERGREEN & BLACKROCK ROADS in NELLYSFORD, VA)
(Resource Conservation and Recovery Act (tracking hazardous waste)) Organizations: OPERNAME (CONTACT/OPERATOR)
, CHESAPEAKE & POTOMAC TELEPHONE COMPANY (CONTACT/OWNER)
Housing units lacking complete plumbing facilities: 1.3% Housing units lacking complete kitchen facilities: 4.7%
57.3%Electricity
33.7%Bottled, tank, or LP gas
4.5%Utility gas
3.0%Wood
1.7%Other fuel
Population in 1990: 53. Population change in the 1990s: +1,584 (+2988.7%).
Place of birth for U.S.-born residents:
This state: 724
Northeast: 371
Midwest: 440
South: 357
West: 62
58% of the 22958 zip code residents lived in the same house 5 years ago. Out of people who lived in different houses, 31% lived in this county. Out of people who lived in different counties, 50% lived in Virginia.
85% of the 22958 zip code residents lived in the same house 1 year ago. Out of people who lived in different houses, 26% moved from this county. Out of people who lived in different houses, 38% moved from different county within same state. Out of people who lived in different houses, 35% moved from different state.
Private vs. public school enrollment:
Students in private schools in grades 1 to 8 (elementary and middle school): 8
Here:
27.5%
Virginia:
13.2%
Students in private schools in grades 9 to 12 (high school):
Here:
0.0%
Virginia:
10.2%
Students in private undergraduate colleges:
Here:
0.0%
Virginia:
18.7%
Occupation by median earnings in the past 12 months ($)
245,695Business and financial operations occupations
226,383Health diagnosing and treating practitioners and other technical occupations
205,485Office and administrative support occupations
142,441Management occupations
21,813Sales and related occupations
8,240Material moving occupations
Companies with federal contracts located in this zip code:
TLK INC (105 SADDLEBACK KNOLL in NELLYSFORD, VA; small business) : $590,786 in 5 contractsfrom 2000 to 2002
Contracts for Other Research and Development -- Basic Research (R&D) by Navy Signed by year:2000: $243,028; 2001: $0; 2002: $347,758; 2003: $0; 2004: $0; 2005: $0; 2006: $0.
Biggest contracts:
$173,108 with Navy for Other Research and Development -- Basic Research (R&D). Signed on 2002-12-16. Completion date: 2003-09-30.
$145,541, same as above.Signed on 2002-03-20. Completion date: 2003-01-13.
$128,031, same as above.Signed on 2000-12-22. Completion date: 2001-12-21.
$114,997, same as above.Signed on 2000-01-10. Completion date: 2001-01-09.
Top industries in this zip code by the number of employees in 2005:
Arts, Entertainment, and Recreation: Skiing Facilities (250-499 employees: 1 establishment)
Accommodation and Food Services: Hotels (except Casino Hotels) and Motels (250-499: 1)
Accommodation and Food Services: Full-Service Restaurants (50-99: 1, 5-9: 1)
Real Estate and Rental and Leasing: Offices of Real Estate Agents and Brokers (5-9: 2, 1-4: 5)
Professional, Scientific, and Technical Services: Title Abstract and Settlement Offices (10-19: 1)
Construction: Plumbing, Heating, and Air-Conditioning Contractors (10-19: 1)
Construction: All Other Specialty Trade Contractors (10-19: 1)
People in group quarters in 2010:
10 people in other noninstitutional facilities
Fatal accident statistics in 2011:
Fatal accident count: 2
Vehicles involved in fatal accidents: 2
Fatal accidents caused by drunken drivers: 1
Fatalities: 2
Persons involved in fatal accidents: 2
Pedestrians involved in fatal accidents: 1
2002 - 2018 National Fire Incident Reporting System (NFIRS) incidents
According to the data from the years 2002 - 2018 the average number of fires per year is 19. The highest number of reported fire incidents - 49 took place in 2007, and the least - 1 in 2003. The data has a rising trend.
When looking into fire subcategories, the most reports belonged to: Outside Fires (45.4%), and Structure Fires (34.9%).
Fire incident types reported to NFIRS in Zip Code 22958


 Nearest zip codes: 22952, 22938, 22949, 22920, 22967, 22931.


 According to the data from the years 2002 - 2018 the average number of fires per year is 19. The highest number of reported fire incidents - 49 took place in 2007, and the least - 1 in 2003. The data has a rising trend.
 When looking into fire subcategories, the most reports belonged to: Outside Fires (45.4%), and Structure Fires (34.9%).