Estimated zip code population in 2022: 4,772 Zip code population in 2010: 5,385 Zip code population in 2000: 3,954
Houses and condos: 1,438 Renter-occupied apartments: 126
% of renters here:
9%
State:
33%
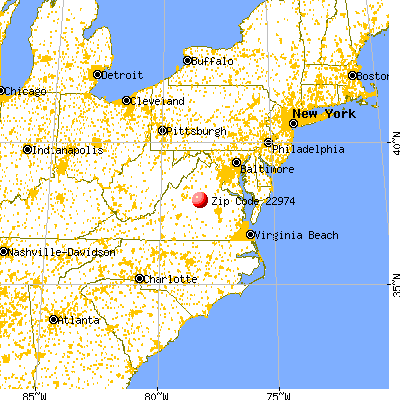
March 2022 cost of living index in zip code 22974: 84.5 (less than average, U.S. average is 100)
Land area: 40.3 sq. mi. Water area: 0.4 sq. mi.
Population density: 118 people per square mile
(very low).
OSM Map
General Map
Google Map
MSN Map
OSM Map
General Map
Google Map
MSN Map
OSM Map
General Map
Google Map
MSN Map
OSM Map
General Map
Google Map
MSN Map
Please wait while loading the map...
Real estate property taxes paid for housing units in 2022:
This zip code:
0.7% ($2,222)
Virginia:
0.7% ($2,617)
Median real estate property taxes paid for housing units with mortgages in 2022: $2,205 (0.7%) Median real estate property taxes paid for housing units with no mortgage in 2022: $2,319 (0.6%)
Business Search- 14 Million verified businesses
Males: 1,858
(38.9%)
Females: 2,913
(61.1%)
For population 25 years and over in 22974:
High school or higher: 86.2%
Bachelor's degree or higher: 27.3%
Graduate or professional degree: 7.8%
Unemployed: 1.0%
Mean travel time to work (commute): 26.9 minutes
For population 15 years and over in 22974:
Never married: 20.9%
Now married: 52.9%
Separated: 4.2%
Widowed: 6.0%
Divorced: 16.0%
Zip code 22974 compared to state average:
Unemployed percentage significantly below state average.
Hispanic race population percentage below state average.
Median age above state average.
Foreign-born population percentage significantly below state average.
Renting percentage significantly below state average.
Length of stay since moving in significantly above state average.
Estimated median house/condo value in 2022: $322,328
22974:
$322,328
Virginia:
$365,700
According to our research of Virginia and other state lists, there were 12 registered sex offenders living in 22974 zip code as of May 28, 2024. The ratio of all residents to sex offenders in zip code 22974 is 543 to 1. The ratio of registered sex offenders to all residents in this zip code is lower than the state average.
Median resident age:
This zip code:
44.5 years
Virginia median age:
39.0 years
Average household size:
This zip code:
2.6 people
Virginia:
2.5 people
Averages for the 2020 tax year for zip code 22974, filed in 2021:
Average Adjusted Gross Income (AGI) in 2020: $73,138 (Individual Income Tax Returns)
Here:
$73,138
State:
$86,446
Salary/wage: $63,604 (reported on 74.9% of returns)
Here:
$63,604
State:
$71,185
(% of AGI for various income ranges: 1090.5% for AGIs below $25k, 3635.9% for AGIs $25k-50k, 7022.3% for AGIs $50k-75k, 9582.0% for AGIs $75k-100k, 18322.4% for AGIs $100k-200k, 75173.3% for AGIs over 200k)
Taxable interest for individuals: $975 (reported on 35.6% of returns)
This zip code:
$975
Virginia:
$1,805
(% of AGI for various income ranges: 7.1% for AGIs below $25k, 13.7% for AGIs $25k-50k, 44.1% for AGIs $50k-75k, 78.7% for AGIs $75k-100k, 101.6% for AGIs $100k-200k, 1010.0% for AGIs over 200k)
Ordinary dividends: $4,771 (reported on 19.8% of returns)
Here:
$4,771
State:
$8,327
(% of AGI for various income ranges: 67.4% for AGIs below $25k, 28.3% for AGIs $25k-50k, 140.9% for AGIs $50k-75k, 121.3% for AGIs $75k-100k, 354.0% for AGIs $100k-200k, 1873.3% for AGIs over 200k)
Net capital gain/loss in AGI: +$18,102 (reported on 17.8% of returns)
Here:
+$18,102
State:
+$24,644
(% of AGI for various income ranges: 11.7% for AGIs below $25k, 18.0% for AGIs $25k-50k, 65.9% for AGIs $50k-75k, 81.3% for AGIs $75k-100k, 572.4% for AGIs $100k-200k, 20480.0% for AGIs over 200k)
Profit/loss from business: +$11,758 (reported on 15.4% of returns)
Here:
+$11,758
State:
+$12,836
(% of AGI for various income ranges: 201.7% for AGIs below $25k, 131.7% for AGIs $25k-50k, 307.7% for AGIs $50k-75k, 276.7% for AGIs $75k-100k, 795.6% for AGIs $100k-200k)
Taxable individual retirement arrangement distribution: $19,850 (reported on 8.9% of returns)
22974:
$19,850
Virginia:
$21,535
(% of AGI for various income ranges: 36.0% for AGIs below $25k, 93.9% for AGIs $25k-50k, 219.5% for AGIs $50k-75k, 540.0% for AGIs $75k-100k, 1015.2% for AGIs $100k-200k)
Total itemized deductions: $31,212 (reported on 9.7% of returns)
Here:
$31,212
State:
$33,287
(% of AGI for various income ranges: 174.3% for AGIs below $25k, 450.0% for AGIs $50k-75k, 476.0% for AGIs $75k-100k, 981.2% for AGIs $100k-200k, 8673.3% for AGIs over 200k)
Charity contributions: $7,484 (reported on 7.7% of returns)
Here:
$7,484
State:
$10,381
(% of AGI for various income ranges: 62.7% for AGIs $50k-75k, 104.0% for AGIs $75k-100k, 186.4% for AGIs $100k-200k, 2206.7% for AGIs over 200k)
Taxes paid: $7,792 (reported on 9.7% of returns)
22974:
$7,792
State:
$8,284
(% of AGI for various income ranges: 31.0% for AGIs below $25k, 99.1% for AGIs $50k-75k, 144.7% for AGIs $75k-100k, 310.0% for AGIs $100k-200k, 1766.7% for AGIs over 200k)
Earned income credit: $2,172 (reported on 10.1% of returns)
Here:
$2,172
State:
$2,214
(% of AGI for various income ranges: 79.0% for AGIs below $25k, 51.5% for AGIs $25k-50k)
Percentage of individuals using paid preparers for their 2020 taxes: 83.4%
Here:
83%
State:
92%
(% for various income ranges: 65.4% for AGIs below $25k, 92.5% for AGIs $25k-50k, 91.2% for AGIs $50k-75k, 91.3% for AGIs $75k-100k, 93.3% for AGIs $100k-200k, 90.9% for AGIs over 200k)
Averages for the 2012 tax year for zip code 22974, filed in 2013:
Average Adjusted Gross Income (AGI) in 2012: $60,755 (Individual Income Tax Returns)
Here:
$60,755
State:
$71,192
Salary/wage: $52,008 (reported on 85.9% of returns)
Here:
$52,008
State:
$59,229
(% of AGI for various income ranges: 71.5% for AGIs below $25k, 82.5% for AGIs $25k-50k, 75.4% for AGIs $50k-75k, 78.6% for AGIs $75k-100k, 75.9% for AGIs $100k-200k, 51.0% for AGIs over 200k)
Taxable interest for individuals: $992 (reported on 37.7% of returns)
This zip code:
$992
Virginia:
$1,600
(% of AGI for various income ranges: 0.9% for AGIs below $25k, 0.6% for AGIs $25k-50k, 0.4% for AGIs $50k-75k, 0.5% for AGIs $75k-100k, 0.6% for AGIs $100k-200k, 0.9% for AGIs over 200k)
Ordinary dividends: $4,035 (reported on 20.9% of returns)
Here:
$4,035
State:
$6,959
(% of AGI for various income ranges: 2.0% for AGIs below $25k, 0.5% for AGIs $25k-50k, 0.7% for AGIs $50k-75k, 0.9% for AGIs $75k-100k, 1.8% for AGIs $100k-200k, 2.4% for AGIs over 200k)
Net capital gain/loss in AGI: +$3,793 (reported on 14.7% of returns)
Here:
+$3,793
State:
+$16,672
(% of AGI for various income ranges: 0.2% for AGIs below $25k, 0.1% for AGIs $50k-75k, 1.6% for AGIs $100k-200k, 2.7% for AGIs over 200k)
Profit/loss from business: +$13,319 (reported on 16.8% of returns)
Here:
+$13,319
State:
+$14,116
(% of AGI for various income ranges: 9.1% for AGIs below $25k, 3.8% for AGIs $25k-50k, 4.3% for AGIs $50k-75k, 3.3% for AGIs $75k-100k, 4.0% for AGIs $100k-200k)
Taxable individual retirement arrangement distribution: $10,315 (reported on 10.5% of returns)
22974:
$10,315
Virginia:
$16,667
(% of AGI for various income ranges: 3.6% for AGIs below $25k, 1.4% for AGIs $25k-50k, 1.9% for AGIs $50k-75k, 1.7% for AGIs $75k-100k, 2.3% for AGIs $100k-200k)
Total itemized deductions: $22,656 (23% of AGI, reported on 41.9% of returns)
Here:
$22,656
State:
$26,596
Here:
23.3% of AGI
State:
20.1% of AGI
(% of AGI for various income ranges: 11.9% for AGIs below $25k, 13.7% for AGIs $25k-50k, 15.5% for AGIs $50k-75k, 16.4% for AGIs $75k-100k, 16.4% for AGIs $100k-200k, 16.7% for AGIs over 200k)
Charity contributions: $3,419 (reported on 30.9% of returns)
Here:
$3,419
State:
$4,443
(% of AGI for various income ranges: 0.6% for AGIs below $25k, 0.9% for AGIs $25k-50k, 1.6% for AGIs $50k-75k, 1.8% for AGIs $75k-100k, 2.4% for AGIs $100k-200k, 1.8% for AGIs over 200k)
Taxes paid: $7,000 (reported on 41.9% of returns)
22974:
$7,000
State:
$9,951
(% of AGI for various income ranges: 1.8% for AGIs below $25k, 2.9% for AGIs $25k-50k, 4.1% for AGIs $50k-75k, 4.9% for AGIs $75k-100k, 6.1% for AGIs $100k-200k, 6.0% for AGIs over 200k)
Earned income credit: $1,937 (reported on 14.1% of returns)
Here:
$1,937
State:
$2,211
(% of AGI for various income ranges: 5.1% for AGIs below $25k, 0.9% for AGIs $25k-50k)
Percentage of individuals using paid preparers for their 2012 taxes: 36.6%
Here:
37%
State:
46%
(% for various income ranges: 32.8% for AGIs below $25k, 31.1% for AGIs $25k-50k, 43.3% for AGIs $50k-75k, 37.5% for AGIs $75k-100k, 41.4% for AGIs $100k-200k, 60.0% for AGIs over 200k)
Averages for the 2004 tax year for zip code 22974, filed in 2005:
Average Adjusted Gross Income (AGI) in 2004: $53,354 (Individual Income Tax Returns)
Here:
$53,354
State:
$56,704
Salary/wage: $45,243 (reported on 88.9% of returns)
Here:
$45,243
State:
$48,441
(% of AGI for various income ranges: 105.3% for AGIs below $10k, 82.6% for AGIs $10k-25k, 82.9% for AGIs $25k-50k, 86.9% for AGIs $50k-75k, 81.5% for AGIs $75k-100k, 60.9% for AGIs over 100k)
Taxable interest for individuals: $1,724 (reported on 46.8% of returns)
This zip code:
$1,724
Virginia:
$1,688
(% of AGI for various income ranges: 4.0% for AGIs below $10k, 1.8% for AGIs $10k-25k, 0.9% for AGIs $25k-50k, 0.5% for AGIs $50k-75k, 0.9% for AGIs $75k-100k, 2.5% for AGIs over 100k)
Taxable dividends: $2,391 (reported on 23.1% of returns)
Here:
$2,391
State:
$4,028
(% of AGI for various income ranges: 2.2% for AGIs below $10k, 0.8% for AGIs $10k-25k, 0.6% for AGIs $25k-50k, 0.4% for AGIs $50k-75k, 1.0% for AGIs $75k-100k, 1.6% for AGIs over 100k)
Net capital gain/loss: +$7,070 (reported on 17.0% of returns)
Here:
+$7,070
State:
+$14,375
(% of AGI for various income ranges: 2.0% for AGIs below $10k, -0.5% for AGIs $10k-25k, 0.3% for AGIs $25k-50k, 1.1% for AGIs $50k-75k, 0.9% for AGIs $75k-100k, 4.9% for AGIs over 100k)
Profit/loss from business: +$11,720 (reported on 17.8% of returns)
Here:
+$11,720
State:
+$13,342
(% of AGI for various income ranges: 7.2% for AGIs below $10k, 5.1% for AGIs $10k-25k, 5.5% for AGIs $25k-50k, 3.2% for AGIs $50k-75k, 3.5% for AGIs $75k-100k, 3.4% for AGIs over 100k)
IRA payment deduction: $3,018 (reported on 3.3% of returns)
22974:
$3,018
Virginia:
$2,943
Total itemized deductions: $18,099 (20% of AGI, reported on 40.8% of returns)
Here:
$18,099
State:
$21,492
Here:
20.5% of AGI
State:
21.0% of AGI
(% of AGI for various income ranges: 12.2% for AGIs $10k-25k, 13.7% for AGIs $25k-50k, 14.4% for AGIs $50k-75k, 17.2% for AGIs $75k-100k, 12.9% for AGIs over 100k)
Charity contributions deductions: $2,961 (3% of AGI, reported on 33.2% of returns)
Here:
$2,961
State:
$3,794
Here:
3.1% of AGI
State:
3.5% of AGI
(% of AGI for various income ranges: 1.2% for AGIs $10k-25k, 1.2% for AGIs $25k-50k, 1.5% for AGIs $50k-75k, 2.3% for AGIs $75k-100k, 2.3% for AGIs over 100k)
Total tax: $7,934 (reported on 81.8% of returns)
22974:
$7,934
State:
$9,537
(% of AGI for various income ranges: 2.9% for AGIs below $10k, 4.8% for AGIs $10k-25k, 7.2% for AGIs $25k-50k, 8.7% for AGIs $50k-75k, 10.3% for AGIs $75k-100k, 18.8% for AGIs over 100k)
Earned income credit: $1,613 (reported on 12.1% of returns)
Here:
$1,613
State:
$1,734
Percentage of individuals using paid preparers for their 2004 taxes: 48.7%
Here:
49%
State:
52%
(% for various income ranges: 39.9% for AGIs below $10k, 46.9% for AGIs $10k-25k, 50.3% for AGIs $25k-50k, 45.7% for AGIs $50k-75k, 52.6% for AGIs $75k-100k, 60.1% for AGIs over 100k)
Household received Food Stamps/SNAP in the past 12 months: 0 Household did not receive Food Stamps/SNAP in the past 12 months: 1,354
Women who had a birth in the past 12 months: 23 (14 now married, 8 unmarried) Women who did not have a birth in the past 12 months: 1,525 (612 now married, 915 unmarried)
Housing units in zip code 22974 with a mortgage: 823 (64 second mortgage, 49 both second mortgage and home equity loan) Houses without a mortgage: 8
Median monthly owner costs for units with a mortgage: $1,662 Median monthly owner costs for units without a mortgage: $595
Residents with income below the poverty level in 2022:
This zip code:
3.7%
Whole state:
10.6%
Residents with income below 50% of the poverty level in 2022:
This zip code:
3.7%
Whole state:
5.2%
Median number of rooms in houses and condos:
Here:
6.6
State:
7.0
Median number of rooms in apartments:
Here:
4.3
State:
4.3
Notable locations in this zip code not listed on our city pages
Notable locations in zip code 22974: Three Chopt Community Center (A), State Prison Camp Number 12 (B), Fine Creek Volunteer Fire Department (C), Fine Creek Volunteer Rescue Squad (D). Display/hide their locations on the map
Churches in zip code 22974 include: Beaverdam Church (A), Bybee Road Church (B), Zion Church (C), Springfield Church (D), Union Church (E). Display/hide their locations on the map
Streams, rivers, and creeks: Stigger Creek (A), Oliver Creek (B), Mechunk Creek (C), Hunters Branch (D), Cedar Branch (E), Camp Branch (F), Buck Branch (G). Display/hide their locations on the map
In group quarters: 1,171 (-1 institutionalized population)
Size of family households: 560 2-persons, 238 3-persons, 165 4-persons, 150 5-persons, 30 6-persons
Size of nonfamily households: 161 1-person, 56 2-persons, 4 3-persons
370 married couples with children.
26 single-parent households (14 men, 12 women).
94.2% of residents of 22974 zip code speak English at home.
2.2% of residents speak Spanish at home (100% very well).
1.8% of residents speak other Indo-European language at home (100% very well).
1.2% of residents speak Asian or Pacific Island language at home (28% very well, 72% well).
0.2% of residents speak other language at home (50% very well, 50% well).
Foreign born population: 150 (3.1%) (89.8% of them are naturalized citizens)
This zip code:
3.1%
Whole state:
12.7%
29%Ukraine
29%Japan
21%Costa Rica
10%Malaysia
3%Singapore
3%Ethiopia
2%Eritrea
20%American
12%English
10%German
8%Irish
7%Albanian
1%Italian
1%Scottish
Year of entry for the foreign-born population
1092010 or later
52000 to 2009
1351990 to 1999
101Before 1990
Private high school in in this zip code not listed on the city page:
Private elementary/middle school in in this zip code not listed on the city page:
OPEN DOOR CHRISTIAN SCHOOL (Students: 69, Location: 551 LAKE RD, Grades: PK-6)
Facilities with environmental interests located in this zip code:
CHIPS INCORPORATED (26 ZION PARK RD in TROY, VA)
AIR SYNTHETIC MINOR (AIRS/AFS) AIR MINOR (AIRS/AFS) STATE MASTER (Virginia pollutants databases) - CEDS-40821, AIR PROGRAM CRITERIA AND HAZARDOUS AIR POLLUTANT INVENTORY (Inventory of air pollution sources) Business SIC classification: SAWMILLS AND PLANING MILLS, GENERAL; ELECTRIC SERVICES Business NAICS classification: SAWMILLS. Alternative names: Central Virginia Services Corp - Chips Inc
AMANO INTERNATIONAL ENZYME CO INC (PO BOX 1000 in TROY, VA)
COMPLIANCE ACTIVITY (Tracking inspections of insecticide, fungicide, and rodenticide, and toxic substances)
AMANO INT'L EN2YME CO INC (LOUISA CO ZION X RDS in TROY, VA)
Conditionally Exempt Small Quantity Generators, less than 100 kg/month of hazardous waste (Resource Conservation and Recovery Act (tracking hazardous waste)) - notification Organizations: OPERNAME (CONTACT/OPERATOR)
, AMANO PHARMACEUTICAL CO LTD (CONTACT/OWNER)
CABLEFORM INC (ZION CROSSROADS in TROY, VA)
Conditionally Exempt Small Quantity Generators, less than 100 kg/month of hazardous waste (Resource Conservation and Recovery Act (tracking hazardous waste)) - notification Organizations: OPERNAME (CONTACT/OPERATOR)
BIO-CAT INC. (9117 THREE NOTCH ROAD in TROY, VA)
COMPLIANCE ACTIVITY (Tracking inspections of insecticide, fungicide, and rodenticide, and toxic substances)
Housing units lacking complete kitchen facilities: 1.7%
72.9%Electricity
18.2%Bottled, tank, or LP gas
5.2%Wood
1.9%Utility gas
1.1%Fuel oil, kerosene, etc.
0.9%No fuel used
Population in 1990: 1,868. Population change in the 1990s: +2,086 (+111.7%).
Place of birth for U.S.-born residents:
This state: 2,616
Northeast: 551
Midwest: 236
South: 880
West: 121
59% of the 22974 zip code residents lived in the same house 5 years ago. Out of people who lived in different houses, 22% lived in this county. Out of people who lived in different counties, 50% lived in Virginia.
90% of the 22974 zip code residents lived in the same house 1 year ago. Out of people who lived in different houses, 9% moved from this county. Out of people who lived in different houses, 88% moved from different county within same state. Out of people who lived in different houses, 7% moved from different state.
Private vs. public school enrollment:
Students in private schools in grades 1 to 8 (elementary and middle school): 82
Here:
28.3%
Virginia:
13.2%
Students in private schools in grades 9 to 12 (high school): 25
Here:
12.4%
Virginia:
10.2%
Students in private undergraduate colleges: 20
Here:
8.9%
Virginia:
18.7%
Occupation by median earnings in the past 12 months ($)
107,470Computer and mathematical occupations
106,738Health diagnosing and treating practitioners and other technical occupations
94,851Law enforcement workers including supervisors
59,929Health technologists and technicians
59,554Transportation occupations
58,208Management occupations
Companies with federal contracts located in this zip code:
CABLEFORM, INCORPORATED (8845 THREE NOTCH ROAD in TROY, VA) : $7,113 in 2 contractsfrom 2003 to 2004
$6,913 with Navy for Converters, Electrical, Nonrotating. Signed on 2004-05-04. Completion date: 2004-07-23.
$200 with Navy for Maintenance, Repair and Rebuilding of Equipment -- Electrical and Electronic Equipment Components. Signed on 2003-12-05. Completion date: 2003-12-12.
Top industries in this zip code by the number of employees in 2005:
Construction: Poured Concrete Foundation and Structure Contractors (50-99 employees: 1 establishment, 10-19 employees: 1 establishment)
Health Care and Social Assistance: HMO Medical Centers (50-99: 1)
Educational Services: Elementary and Secondary Schools (20-49: 1)
Wholesale Trade: Other Chemical and Allied Products Merchant Wholesalers (20-49: 1)
Wholesale Trade: Metal Service Centers and Other Metal Merchant Wholesalers (20-49: 1)
Construction: Power and Communication Line and Related Structures Construction (10-19: 2, 1-4: 1)
Administrative and Support and Waste Management and Remediation Services: Landscaping Services (10-19: 1, 1-4: 6)
People in group quarters in 2010:
1,218 people in state prisons
People in group quarters in 2000:
870 people in state prisons
Fatal accident statistics in 2013:
Fatal accident count: 2
Vehicles involved in fatal accidents: 4
Fatal accidents caused by drunken drivers: 1
Fatalities: 2
Persons involved in fatal accidents: 7
Pedestrians involved in fatal accidents: 0
Fatal accident statistics in 2011:
Fatal accident count: 2
Vehicles involved in fatal accidents: 2
Fatal accidents caused by drunken drivers: 1
Fatalities: 2
Persons involved in fatal accidents: 2
Pedestrians involved in fatal accidents: 0
2003 - 2018 National Fire Incident Reporting System (NFIRS) incidents
Based on the data from the years 2003 - 2018 the average number of fire incidents per year is 16. The highest number of fires - 45 took place in 2010, and the least - 0 in 2017. The data has a declining trend.
When looking into fire subcategories, the most reports belonged to: Structure Fires (40.3%), and Outside Fires (39.1%).
Fire incident types reported to NFIRS in Zip Code 22974


 Nearest zip codes: 22947, 22963, 22942, 22911, 23084, 23055.


 (Students: 54, Location: 128 OAKLAND FARM WAY, Grades: UG-9)


 Based on the data from the years 2003 - 2018 the average number of fire incidents per year is 16. The highest number of fires - 45 took place in 2010, and the least - 0 in 2017. The data has a declining trend.
 When looking into fire subcategories, the most reports belonged to: Structure Fires (40.3%), and Outside Fires (39.1%).