Estimated zip code population in 2022: 15,959 Zip code population in 2010: 5,971 Zip code population in 2000: 2,769
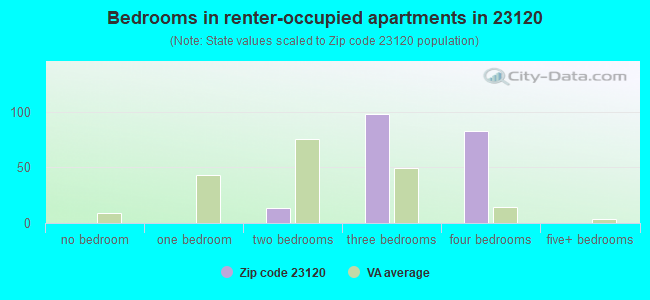
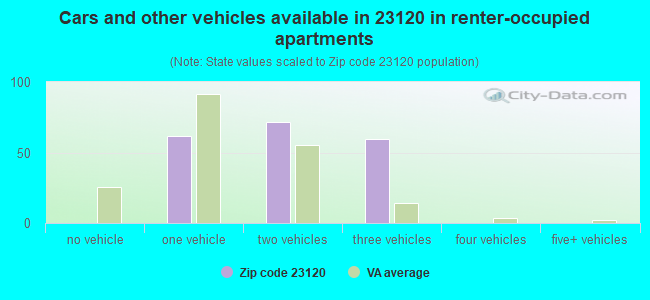
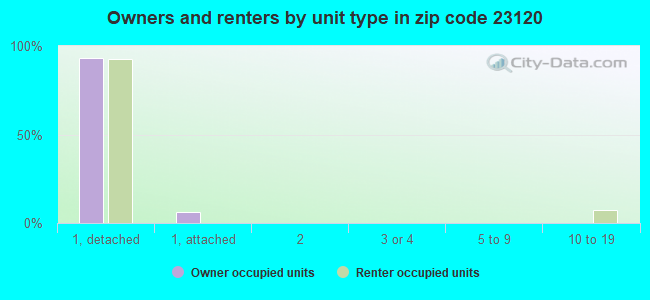
Houses and condos: 5,083 Renter-occupied apartments: 197
% of renters here:
4%
State:
33%
March 2022 cost of living index in zip code 23120: 88.3 (less than average, U.S. average is 100)
Land area: 63.9 sq. mi. Water area: 0.7 sq. mi.
Population density: 250 people per square mile
(very low).
OSM Map
General Map
Google Map
MSN Map
OSM Map
General Map
Google Map
MSN Map
OSM Map
General Map
Google Map
MSN Map
OSM Map
General Map
Google Map
MSN Map
Please wait while loading the map...
Real estate property taxes paid for housing units in 2022:
This zip code:
0.8% ($4,155)
Virginia:
0.7% ($2,617)
Median real estate property taxes paid for housing units with mortgages in 2022: $4,278 (0.8%) Median real estate property taxes paid for housing units with no mortgage in 2022: $3,391 (0.6%)
Business Search- 14 Million verified businesses
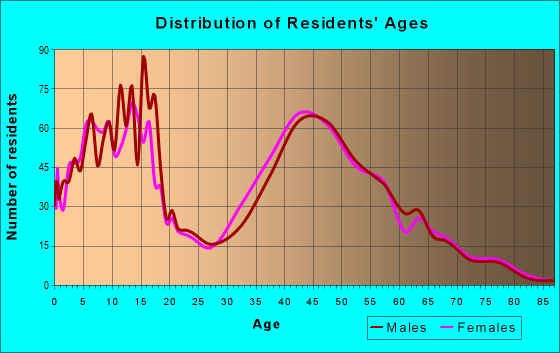
Males: 7,658
(48.0%)
Females: 8,301
(52.0%)
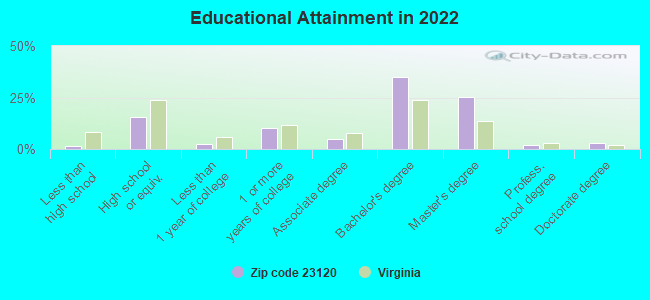
For population 25 years and over in 23120:
High school or higher: 99.4%
Bachelor's degree or higher: 65.9%
Graduate or professional degree: 30.5%
Unemployed: 4.0%
Mean travel time to work (commute): 31.7 minutes
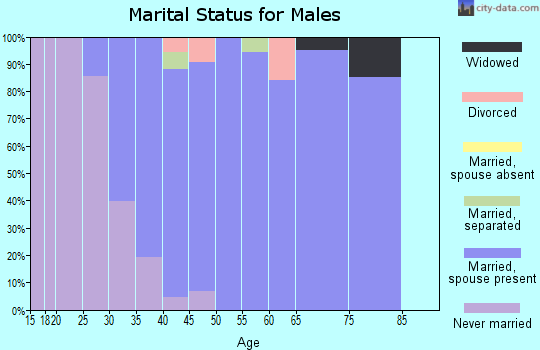
For population 15 years and over in 23120:
Never married: 23.9%
Now married: 64.9%
Separated: 0.4%
Widowed: 3.4%
Divorced: 7.5%
Zip code 23120 compared to state average:
Median household income above state average.
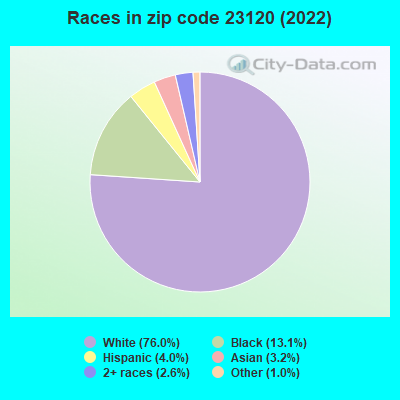
Hispanic race population percentage below state average.
Foreign-born population percentage below state average.
Renting percentage significantly below state average.
Length of stay since moving in significantly below state average.
Estimated median house/condo value in 2022: $532,837
23120:
$532,837
Virginia:
$365,700
According to our research of Virginia and other state lists, there were 2 registered sex offenders living in 23120 zip code as of May 28, 2024. The ratio of all residents to sex offenders in zip code 23120 is 4,245 to 1. The ratio of registered sex offenders to all residents in this zip code is much lower than the state average.
Median resident age:
This zip code:
36.7 years
Virginia median age:
39.0 years
Average household size:
This zip code:
3.1 people
Virginia:
2.5 people
Averages for the 2020 tax year for zip code 23120, filed in 2021:
Average Adjusted Gross Income (AGI) in 2020: $129,069 (Individual Income Tax Returns)
Here:
$129,069
State:
$86,446
Salary/wage: $113,259 (reported on 86.1% of returns)
Here:
$113,259
State:
$71,185
(% of AGI for various income ranges: 1074.9% for AGIs below $25k, 3442.9% for AGIs $25k-50k, 6113.3% for AGIs $50k-75k, 9304.6% for AGIs $75k-100k, 19353.5% for AGIs $100k-200k, 67692.0% for AGIs over 200k)
Taxable interest for individuals: $1,189 (reported on 41.0% of returns)
This zip code:
$1,189
Virginia:
$1,805
(% of AGI for various income ranges: 18.9% for AGIs below $25k, 28.0% for AGIs $25k-50k, 49.1% for AGIs $50k-75k, 65.6% for AGIs $75k-100k, 84.2% for AGIs $100k-200k, 298.7% for AGIs over 200k)
Ordinary dividends: $5,201 (reported on 33.8% of returns)
Here:
$5,201
State:
$8,327
(% of AGI for various income ranges: 37.7% for AGIs below $25k, 67.5% for AGIs $25k-50k, 183.7% for AGIs $50k-75k, 200.5% for AGIs $75k-100k, 267.1% for AGIs $100k-200k, 1314.4% for AGIs over 200k)
Net capital gain/loss in AGI: +$13,201 (reported on 31.0% of returns)
Here:
+$13,201
State:
+$24,644
(% of AGI for various income ranges: 21.1% for AGIs below $25k, 51.5% for AGIs $25k-50k, 120.0% for AGIs $50k-75k, 201.2% for AGIs $75k-100k, 353.3% for AGIs $100k-200k, 4655.8% for AGIs over 200k)
Profit/loss from business: +$12,059 (reported on 18.8% of returns)
Here:
+$12,059
State:
+$12,836
(% of AGI for various income ranges: 76.4% for AGIs below $25k, 207.6% for AGIs $25k-50k, 238.8% for AGIs $75k-100k, 476.1% for AGIs $100k-200k, 1393.1% for AGIs over 200k)
Taxable individual retirement arrangement distribution: $24,464 (reported on 10.9% of returns)
23120:
$24,464
Virginia:
$21,535
(% of AGI for various income ranges: 45.5% for AGIs below $25k, 143.1% for AGIs $25k-50k, 356.1% for AGIs $50k-75k, 433.9% for AGIs $75k-100k, 633.6% for AGIs $100k-200k, 1088.0% for AGIs over 200k)
Self-employed (Keogh) retirement plans: $24,540 (reported on 0.7% of returns)
23120:
$24,540
Virginia:
$31,172
(% of AGI for various income ranges: 28.5% for AGIs $100k-200k, 189.1% for AGIs over 200k)
Total itemized deductions: $31,772 (reported on 26.2% of returns)
Here:
$31,772
State:
$33,287
(% of AGI for various income ranges: 58.7% for AGIs below $25k, 297.5% for AGIs $25k-50k, 612.8% for AGIs $50k-75k, 976.8% for AGIs $75k-100k, 1707.7% for AGIs $100k-200k, 5423.8% for AGIs over 200k)
Charity contributions: $8,430 (reported on 22.2% of returns)
Here:
$8,430
State:
$10,381
(% of AGI for various income ranges: 31.6% for AGIs $25k-50k, 86.5% for AGIs $50k-75k, 107.3% for AGIs $75k-100k, 328.9% for AGIs $100k-200k, 1601.3% for AGIs over 200k)
Taxes paid: $8,982 (reported on 26.1% of returns)
23120:
$8,982
State:
$8,284
(% of AGI for various income ranges: 10.2% for AGIs below $25k, 52.9% for AGIs $25k-50k, 156.1% for AGIs $50k-75k, 279.5% for AGIs $75k-100k, 531.4% for AGIs $100k-200k, 1435.6% for AGIs over 200k)
Earned income credit: $2,089 (reported on 4.2% of returns)
Here:
$2,089
State:
$2,214
(% of AGI for various income ranges: 44.8% for AGIs below $25k, 35.5% for AGIs $25k-50k)
Percentage of individuals using paid preparers for their 2020 taxes: 93.0%
Here:
93%
State:
92%
(% for various income ranges: 90.8% for AGIs below $25k, 90.3% for AGIs $25k-50k, 93.8% for AGIs $50k-75k, 93.5% for AGIs $75k-100k, 93.7% for AGIs $100k-200k, 95.0% for AGIs over 200k)
Averages for the 2012 tax year for zip code 23120, filed in 2013:
Average Adjusted Gross Income (AGI) in 2012: $103,434 (Individual Income Tax Returns)
Here:
$103,434
State:
$71,192
Salary/wage: $93,708 (reported on 89.4% of returns)
Here:
$93,708
State:
$59,229
(% of AGI for various income ranges: 77.0% for AGIs below $25k, 74.1% for AGIs $25k-50k, 70.3% for AGIs $50k-75k, 78.5% for AGIs $75k-100k, 86.4% for AGIs $100k-200k, 77.8% for AGIs over 200k)
Taxable interest for individuals: $971 (reported on 49.7% of returns)
This zip code:
$971
Virginia:
$1,600
(% of AGI for various income ranges: 1.4% for AGIs below $25k, 0.9% for AGIs $25k-50k, 0.9% for AGIs $50k-75k, 0.5% for AGIs $75k-100k, 0.4% for AGIs $100k-200k, 0.4% for AGIs over 200k)
Ordinary dividends: $3,468 (reported on 35.5% of returns)
Here:
$3,468
State:
$6,959
(% of AGI for various income ranges: 2.4% for AGIs below $25k, 1.8% for AGIs $25k-50k, 1.7% for AGIs $50k-75k, 1.0% for AGIs $75k-100k, 0.8% for AGIs $100k-200k, 1.5% for AGIs over 200k)
Net capital gain/loss in AGI: +$7,384 (reported on 27.3% of returns)
Here:
+$7,384
State:
+$16,672
(% of AGI for various income ranges: 0.4% for AGIs below $25k, 0.8% for AGIs $50k-75k, 1.0% for AGIs $75k-100k, 1.1% for AGIs $100k-200k, 3.8% for AGIs over 200k)
Profit/loss from business: +$15,544 (reported on 15.8% of returns)
Here:
+$15,544
State:
+$14,116
(% of AGI for various income ranges: 4.8% for AGIs below $25k, 5.4% for AGIs $25k-50k, 1.3% for AGIs $50k-75k, 2.6% for AGIs $75k-100k, 1.5% for AGIs $100k-200k, 3.0% for AGIs over 200k)
Taxable individual retirement arrangement distribution: $16,662 (reported on 11.2% of returns)
23120:
$16,662
Virginia:
$16,667
(% of AGI for various income ranges: 3.9% for AGIs below $25k, 2.3% for AGIs $25k-50k, 4.0% for AGIs $50k-75k, 3.2% for AGIs $75k-100k, 1.7% for AGIs $100k-200k, 1.0% for AGIs over 200k)
Self-employment retirement plans: $22,267 (reported on 0.9% of returns)
23120:
$22,267
Virginia:
$25,373
Total itemized deductions: $28,617 (20% of AGI, reported on 63.0% of returns)
Here:
$28,617
State:
$26,596
Here:
19.6% of AGI
State:
20.1% of AGI
(% of AGI for various income ranges: 13.5% for AGIs below $25k, 16.0% for AGIs $25k-50k, 20.6% for AGIs $50k-75k, 21.3% for AGIs $75k-100k, 18.6% for AGIs $100k-200k, 14.8% for AGIs over 200k)
Charity contributions: $3,752 (reported on 55.8% of returns)
Here:
$3,752
State:
$4,443
(% of AGI for various income ranges: 1.1% for AGIs below $25k, 1.2% for AGIs $25k-50k, 2.5% for AGIs $50k-75k, 2.3% for AGIs $75k-100k, 1.9% for AGIs $100k-200k, 2.1% for AGIs over 200k)
Taxes paid: $10,908 (reported on 63.0% of returns)
23120:
$10,908
State:
$9,951
(% of AGI for various income ranges: 2.8% for AGIs below $25k, 3.7% for AGIs $25k-50k, 5.7% for AGIs $50k-75k, 6.8% for AGIs $75k-100k, 7.1% for AGIs $100k-200k, 6.8% for AGIs over 200k)
Earned income credit: $1,839 (reported on 5.5% of returns)
Here:
$1,839
State:
$2,211
(% of AGI for various income ranges: 3.1% for AGIs below $25k, 0.7% for AGIs $25k-50k)
Percentage of individuals using paid preparers for their 2012 taxes: 41.8%
Here:
42%
State:
46%
(% for various income ranges: 30.4% for AGIs below $25k, 38.9% for AGIs $25k-50k, 45.5% for AGIs $50k-75k, 44.7% for AGIs $75k-100k, 42.5% for AGIs $100k-200k, 60.5% for AGIs over 200k)
Averages for the 2004 tax year for zip code 23120, filed in 2005:
Average Adjusted Gross Income (AGI) in 2004: $74,238 (Individual Income Tax Returns)
Here:
$74,238
State:
$56,704
Salary/wage: $67,970 (reported on 87.8% of returns)
Here:
$67,970
State:
$48,441
(% of AGI for various income ranges: 132.7% for AGIs below $10k, 74.1% for AGIs $10k-25k, 72.0% for AGIs $25k-50k, 76.2% for AGIs $50k-75k, 86.5% for AGIs $75k-100k, 80.4% for AGIs over 100k)
Taxable interest for individuals: $1,104 (reported on 59.3% of returns)
This zip code:
$1,104
Virginia:
$1,688
(% of AGI for various income ranges: 2.4% for AGIs below $10k, 3.2% for AGIs $10k-25k, 2.1% for AGIs $25k-50k, 1.3% for AGIs $50k-75k, 0.3% for AGIs $75k-100k, 0.7% for AGIs over 100k)
Taxable dividends: $2,377 (reported on 37.9% of returns)
Here:
$2,377
State:
$4,028
(% of AGI for various income ranges: 5.2% for AGIs below $10k, 2.0% for AGIs $10k-25k, 1.7% for AGIs $25k-50k, 0.8% for AGIs $50k-75k, 0.7% for AGIs $75k-100k, 1.3% for AGIs over 100k)
Net capital gain/loss: +$8,033 (reported on 28.2% of returns)
Here:
+$8,033
State:
+$14,375
(% of AGI for various income ranges: -3.7% for AGIs below $10k, -0.5% for AGIs $10k-25k, 1.5% for AGIs $25k-50k, 1.6% for AGIs $50k-75k, -0.0% for AGIs $75k-100k, 4.5% for AGIs over 100k)
Profit/loss from business: +$11,989 (reported on 14.8% of returns)
Here:
+$11,989
State:
+$13,342
(% of AGI for various income ranges: 5.5% for AGIs below $10k, 5.4% for AGIs $10k-25k, 5.7% for AGIs $25k-50k, 3.5% for AGIs $50k-75k, 2.9% for AGIs $75k-100k, 1.5% for AGIs over 100k)
Profit/loss from farming: +$1,500 (reported on 0.8% of returns)
Here:
+$1,500
State:
-$5,267
IRA payment deduction: $3,750 (reported on 3.5% of returns)
23120:
$3,750
Virginia:
$2,943
Self-employed pension: $7,167 (reported on 1.0% of returns)
Here:
$7,167
Virginia:
$17,430
Total itemized deductions: $23,094 (21% of AGI, reported on 58.6% of returns)
Here:
$23,094
State:
$21,492
Here:
20.9% of AGI
State:
21.0% of AGI
(% of AGI for various income ranges: 22.2% for AGIs below $10k, 13.4% for AGIs $10k-25k, 19.8% for AGIs $25k-50k, 20.2% for AGIs $50k-75k, 20.2% for AGIs $75k-100k, 17.5% for AGIs over 100k)
Charity contributions deductions: $3,869 (3% of AGI, reported on 54.1% of returns)
Here:
$3,869
State:
$3,794
Here:
3.4% of AGI
State:
3.5% of AGI
(% of AGI for various income ranges: 1.6% for AGIs below $10k, 1.6% for AGIs $10k-25k, 2.3% for AGIs $25k-50k, 2.2% for AGIs $50k-75k, 2.3% for AGIs $75k-100k, 3.2% for AGIs over 100k)
Total tax: $11,759 (reported on 81.9% of returns)
23120:
$11,759
State:
$9,537
(% of AGI for various income ranges: 3.8% for AGIs below $10k, 4.9% for AGIs $10k-25k, 7.1% for AGIs $25k-50k, 8.6% for AGIs $50k-75k, 9.1% for AGIs $75k-100k, 15.8% for AGIs over 100k)
Earned income credit: $1,688 (reported on 5.2% of returns)
Here:
$1,688
State:
$1,734
Percentage of individuals using paid preparers for their 2004 taxes: 47.2%
Here:
47%
State:
52%
(% for various income ranges: 35.4% for AGIs below $10k, 45.2% for AGIs $10k-25k, 49.2% for AGIs $25k-50k, 48.2% for AGIs $50k-75k, 52.3% for AGIs $75k-100k, 51.7% for AGIs over 100k)
Household received Food Stamps/SNAP in the past 12 months: 0 Household did not receive Food Stamps/SNAP in the past 12 months: 5,017
Women who had a birth in the past 12 months: 217 (223 now married, 0 unmarried) Women who did not have a birth in the past 12 months: 4,079 (2,160 now married, 1,902 unmarried)
Housing units in zip code 23120 with a mortgage: 3,792 (222 second mortgage, 143 both second mortgage and home equity loan) Houses without a mortgage: 46
Median monthly owner costs for units with a mortgage: $2,420 Median monthly owner costs for units without a mortgage: $659
Residents with income below the poverty level in 2022:
This zip code:
2.8%
Whole state:
10.6%
Residents with income below 50% of the poverty level in 2022:
This zip code:
1.9%
Whole state:
5.2%
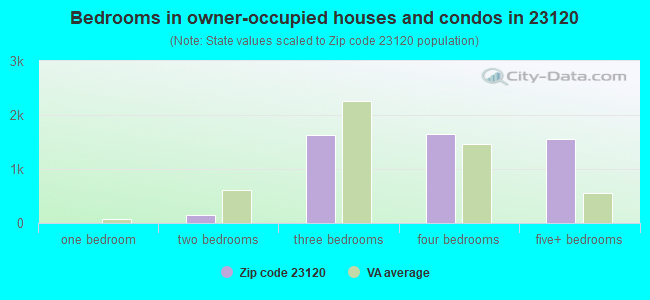
Median number of rooms in houses and condos:
Here:
8.4
State:
7.0
Median number of rooms in apartments:
Here:
5.5
State:
4.3
Notable locations in this zip code not listed on our city pages
Churches in zip code 23120 include: Beulah Church (A), Skinquarter Church (B), Chesterfield Church (C), Graceland Church (D), Mount Hermon Church (E). Display/hide their locations on the map
Streams, rivers, and creeks: Sappony Creek (A), Otterdale Branch (B), Horsepen Creek (C), Goode Creek (D), Flat Creek (E), Deep Creek (F), Carvers Branch (G), Blackman Creek (H). Display/hide their locations on the map
Size of family households: 1,708 2-persons, 848 3-persons, 996 4-persons, 597 5-persons, 368 6-persons, 46 7-or-more-persons
Size of nonfamily households: 493 1-person, 12 2-persons
4,267 married couples with children.
706 single-parent households (100 men, 606 women).
90.6% of residents of 23120 zip code speak English at home.
2.1% of residents speak Spanish at home (50% very well, 50% well).
3.6% of residents speak other Indo-European language at home (90% very well, 10% not well).
2.2% of residents speak Asian or Pacific Island language at home (53% very well, 47% well).
0.6% of residents speak other language at home (100% very well).
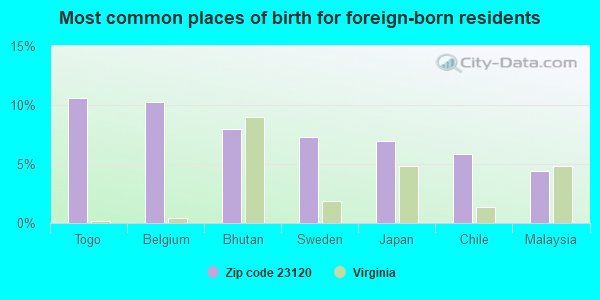
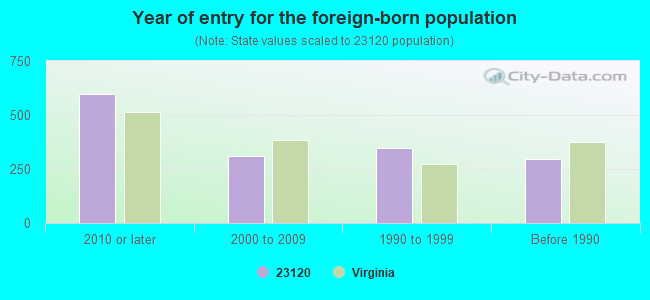
Foreign born population: 1,180 (7.4%) (80.2% of them are naturalized citizens)
This zip code:
7.4%
Whole state:
12.7%
11%Togo
10%Belgium
8%Bhutan
7%Sweden
7%Japan
6%Chile
4%Malaysia
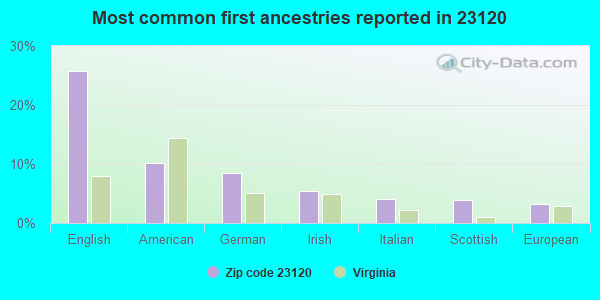
26%English
10%American
9%German
5%Irish
4%Italian
4%Scottish
3%European
Year of entry for the foreign-born population
5992010 or later
3102000 to 2009
3461990 to 1999
297Before 1990
Facilities with environmental interests located in this zip code:
AT AND T - MOSELEY FACILITY (20425 DUVAL RD in MOSELEY, VA)
AIR MINOR (AIRS/AFS) STATE MASTER (Virginia pollutants databases) - CEDS-51212, AIR PROGRAM Conditionally Exempt Small Quantity Generators, less than 100 kg/month of hazardous waste (Resource Conservation and Recovery Act (tracking hazardous waste)) - notification Business SIC classification: TELEPHONE COMMUNICATIONS, EXCEPT RADIOTELEPHONE Business NAICS classification: WIRED TELECOMMUNICATIONS CARRIERS. Organizations: OPERNAME (CONTACT/OPERATOR)
, AT & T COMMUNICATIONS OF VA (CONTACT/OWNER)
Alternative names: AT & T MOSELEY-VA4590, ATAND T, ATT
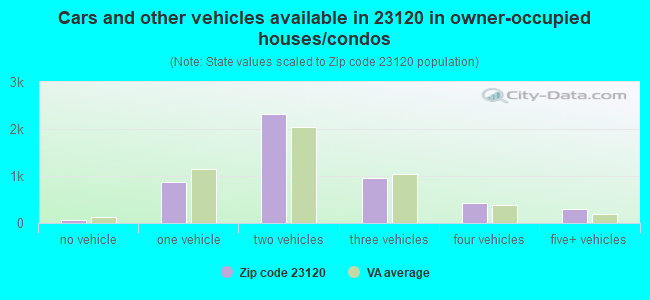
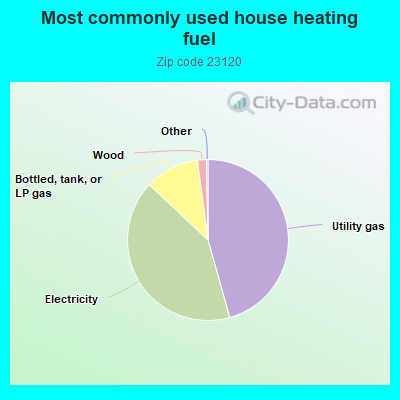
45.7%Utility gas
41.4%Electricity
10.9%Bottled, tank, or LP gas
1.8%Wood
Population in 1990: 1,852. Population change in the 1990s: +917 (+49.5%).
Place of birth for U.S.-born residents:
This state: 8,599
Northeast: 1,715
Midwest: 887
South: 2,378
West: 827
60% of the 23120 zip code residents lived in the same house 5 years ago. Out of people who lived in different houses, 45% lived in this county. Out of people who lived in different counties, 50% lived in Virginia.
87% of the 23120 zip code residents lived in the same house 1 year ago. Out of people who lived in different houses, 52% moved from this county. Out of people who lived in different houses, 15% moved from different county within same state. Out of people who lived in different houses, 28% moved from different state.
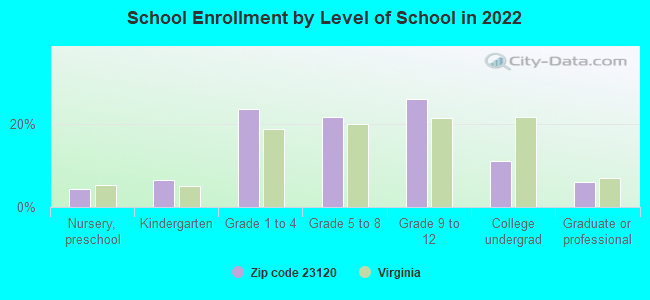
Private vs. public school enrollment:
Students in private schools in grades 1 to 8 (elementary and middle school): 131
Here:
5.6%
Virginia:
13.2%
Students in private schools in grades 9 to 12 (high school): 72
Here:
5.3%
Virginia:
10.2%
Students in private undergraduate colleges: 18
Here:
3.2%
Virginia:
18.7%
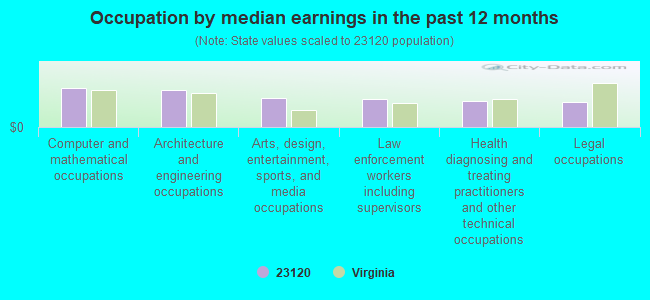
Occupation by median earnings in the past 12 months ($)
142,087Computer and mathematical occupations
137,954Architecture and engineering occupations
106,246Arts, design, entertainment, sports, and media occupations
101,785Law enforcement workers including supervisors
97,023Health diagnosing and treating practitioners and other technical occupations
91,433Legal occupations
Companies with federal contracts located in this zip code:
MCGRAW-MORGAN INC (21403 HULL STREET ROAD in MOSELEY, VA; small business) : $862,948 in 14 contractsfrom 2000 to 2005
Contracts for Lease or Rental of Equipment -- Miscellaneous, Other Utilities, Maintenance, Repair or Alteration of Real Property -- Government-Owned Government-Operated (GOGO) R&D Facilities, Maintenance, Repair or Alteration of Real Property -- Heating and Cooling Plants, and moreby Navy Signed by year:2000: $500,000; 2001: $0; 2002: $13,100; 2003: $209,882; 2004: $48,361; 2005: $91,605; 2006: $0.
Biggest contracts:
$500,000 with Navy for Lease or Rental of Equipment -- Miscellaneous. Signed on 2000-02-04. Completion date: 2000-04-03.
$79,500 with Navy for Other Utilities. Taking place in NC. Signed on 2005-08-29. Completion date: 2005-09-30.
$65,000 with Navy for Maintenance, Repair or Alteration of Real Property -- Government-Owned Government-Operated (GOGO) R&D Facilities. Signed on 2003-11-18. Completion date: 2003-12-19.
$65,000, same as above.Signed on 2003-11-18. Completion date: 2003-12-19.
AUTO MART (17801 HULL STRD in MOSELEY, VA; small business)
$4,950 with Army for Trailers. Signed on 2003-01-31. Completion date: 2003-03-04.
Top industries in this zip code by the number of employees in 2005:
Construction: All Other Specialty Trade Contractors (20-49 employees: 1 establishment, 1-4 employees: 2 establishments)
Arts, Entertainment, and Recreation: Zoos and Botanical Gardens (20-49: 1)
Construction: Poured Concrete Foundation and Structure Contractors (20-49: 1)
Accommodation and Food Services: Limited-Service Restaurants (20-49: 1)
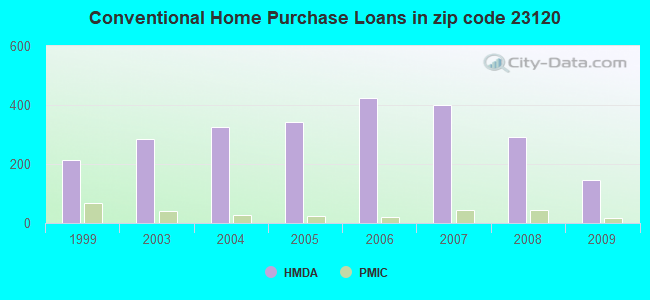
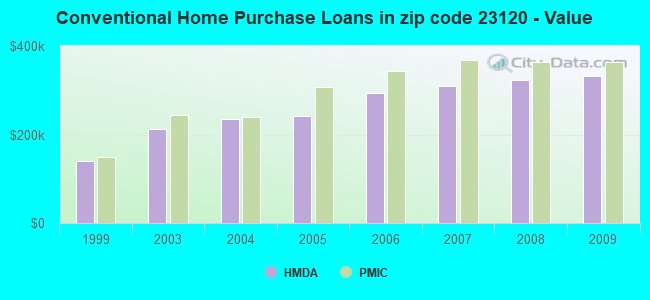
Detailed PMIC statistics for the following Tracts:1010.03
, 1010.04
2002 - 2018 National Fire Incident Reporting System (NFIRS) incidents
According to the data from the years 2002 - 2018 the average number of fires per year is 11. The highest number of fire incidents - 21 took place in 2008, and the least - 0 in 2003. The data has a growing trend.
When looking into fire subcategories, the most incidents belonged to: Outside Fires (50.3%), and Structure Fires (27.0%).
Fire incident types reported to NFIRS in Zip Code 23120


+$1,500
-$5,267
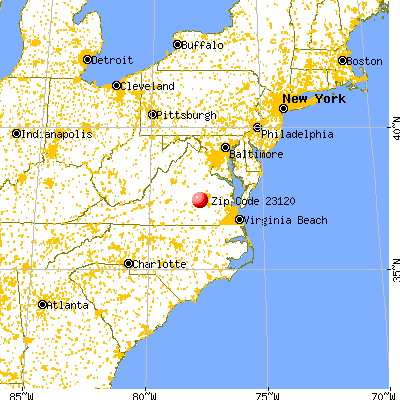
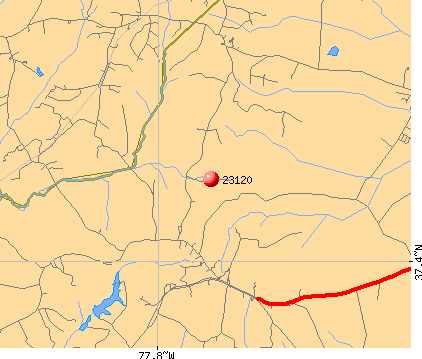 Nearest zip codes: 23112, 23114, 23113, 23838, 23832, 23139.
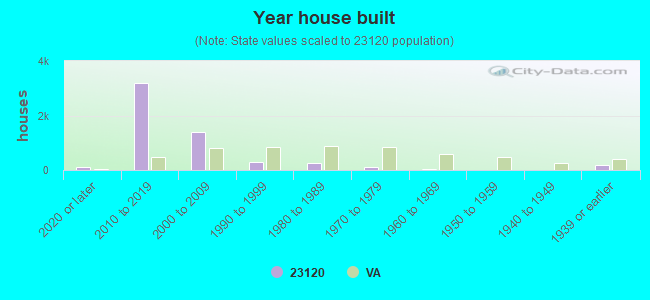


 According to the data from the years 2002 - 2018 the average number of fires per year is 11. The highest number of fire incidents - 21 took place in 2008, and the least - 0 in 2003. The data has a growing trend.
 When looking into fire subcategories, the most incidents belonged to: Outside Fires (50.3%), and Structure Fires (27.0%).