Estimated zip code population in 2022: 2,590 Zip code population in 2010: 3,190 Zip code population in 2000: 2,539
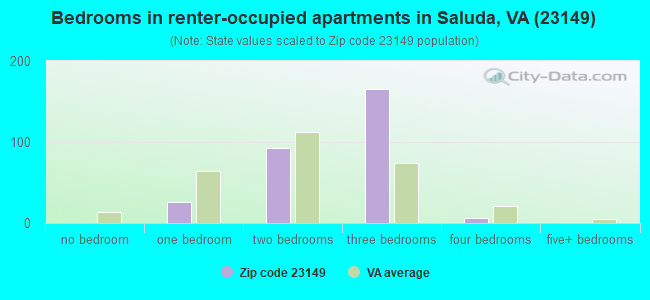
Houses and condos: 1,222 Renter-occupied apartments: 294
% of renters here:
30%
State:
33%
March 2022 cost of living index in zip code 23149: 84.8 (less than average, U.S. average is 100)
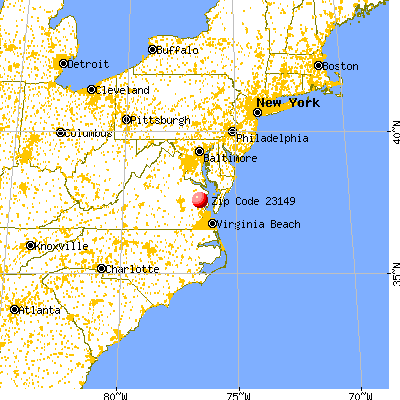
Land area: 50.5 sq. mi. Water area: 3.6 sq. mi.
Population density: 51 people per square mile
(very low).
OSM Map
General Map
Google Map
MSN Map
OSM Map
General Map
Google Map
MSN Map
OSM Map
General Map
Google Map
MSN Map
OSM Map
General Map
Google Map
MSN Map
Please wait while loading the map...
Real estate property taxes paid for housing units in 2022:
This zip code:
0.5% ($1,236)
Virginia:
0.7% ($2,617)
Median real estate property taxes paid for housing units with mortgages in 2022: $1,160 (0.5%) Median real estate property taxes paid for housing units with no mortgage in 2022: $1,473 (0.6%)
Business Search- 14 Million verified businesses
Males: 1,391
(53.7%)
Females: 1,198
(46.3%)
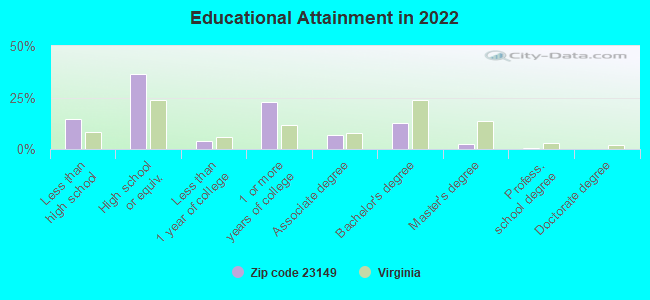
For population 25 years and over in 23149:
High school or higher: 84.0%
Bachelor's degree or higher: 15.3%
Graduate or professional degree: 3.0%
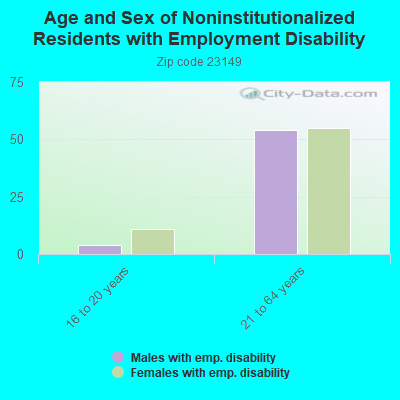
Unemployed: 1.1%
Mean travel time to work (commute): 31.3 minutes
For population 15 years and over in 23149:
Never married: 27.7%
Now married: 52.1%
Separated: 3.0%
Widowed: 7.6%
Divorced: 9.6%
Zip code 23149 compared to state average:
Unemployed percentage significantly below state average.
Median age significantly above state average.
Foreign-born population percentage significantly below state average.
Length of stay since moving in significantly above state average.
Number of college students below state average.
Percentage of population with a bachelor's degree or higher significantly below state average.
Averages for the 2020 tax year for zip code 23149, filed in 2021:
Average Adjusted Gross Income (AGI) in 2020: $53,757 (Individual Income Tax Returns)
Here:
$53,757
State:
$86,446
Salary/wage: $46,625 (reported on 78.7% of returns)
Here:
$46,625
State:
$71,185
(% of AGI for various income ranges: 1221.9% for AGIs below $25k, 3675.2% for AGIs $25k-50k, 6251.3% for AGIs $50k-75k, 8458.8% for AGIs $75k-100k, 16037.1% for AGIs $100k-200k)
Taxable interest for individuals: $1,289 (reported on 28.3% of returns)
This zip code:
$1,289
Virginia:
$1,805
(% of AGI for various income ranges: 17.2% for AGIs below $25k, 28.5% for AGIs $25k-50k, 58.7% for AGIs $50k-75k, 115.0% for AGIs $75k-100k, 217.1% for AGIs $100k-200k)
Ordinary dividends: $7,129 (reported on 16.5% of returns)
Here:
$7,129
State:
$8,327
(% of AGI for various income ranges: 20.3% for AGIs below $25k, 46.3% for AGIs $25k-50k, 66.0% for AGIs $50k-75k, 326.2% for AGIs $75k-100k, 1352.9% for AGIs $100k-200k)
Net capital gain/loss in AGI: +$9,069 (reported on 12.6% of returns)
Here:
+$9,069
State:
+$24,644
(% of AGI for various income ranges: 3.4% for AGIs below $25k, 24.1% for AGIs $25k-50k, 101.2% for AGIs $75k-100k, 1848.6% for AGIs $100k-200k)
Profit/loss from business: +$7,231 (reported on 12.6% of returns)
Here:
+$7,231
State:
+$12,836
(% of AGI for various income ranges: 102.2% for AGIs below $25k, 138.9% for AGIs $25k-50k, 28.0% for AGIs $50k-75k, 516.2% for AGIs $75k-100k)
Taxable individual retirement arrangement distribution: $12,982 (reported on 8.7% of returns)
23149:
$12,982
Virginia:
$21,535
(% of AGI for various income ranges: 36.6% for AGIs below $25k, 108.5% for AGIs $25k-50k, 344.0% for AGIs $50k-75k, 717.1% for AGIs $100k-200k)
Total itemized deductions: $31,450 (reported on 4.7% of returns)
Here:
$31,450
State:
$33,287
(% of AGI for various income ranges: 252.6% for AGIs $25k-50k, 1721.4% for AGIs $100k-200k)
Charity contributions: $6,600 (reported on 3.1% of returns)
Here:
$6,600
State:
$10,381
(% of AGI for various income ranges: 30.4% for AGIs $25k-50k, 260.0% for AGIs $100k-200k)
Taxes paid: $6,683 (reported on 4.7% of returns)
23149:
$6,683
State:
$8,284
(% of AGI for various income ranges: 51.9% for AGIs $25k-50k, 372.9% for AGIs $100k-200k)
Earned income credit: $2,246 (reported on 18.9% of returns)
Here:
$2,246
State:
$2,214
(% of AGI for various income ranges: 112.8% for AGIs below $25k, 65.9% for AGIs $25k-50k)
Percentage of individuals using paid preparers for their 2020 taxes: 92.9%
Here:
93%
State:
92%
(% for various income ranges: 93.0% for AGIs below $25k, 91.9% for AGIs $25k-50k, 94.7% for AGIs $50k-75k, 91.7% for AGIs $75k-100k, 92.9% for AGIs $100k-200k, 100.0% for AGIs over 200k)
Averages for the 2012 tax year for zip code 23149, filed in 2013:
Average Adjusted Gross Income (AGI) in 2012: $44,357 (Individual Income Tax Returns)
Here:
$44,357
State:
$71,192
Salary/wage: $36,729 (reported on 84.9% of returns)
Here:
$36,729
State:
$59,229
(% of AGI for various income ranges: 77.0% for AGIs below $25k, 76.0% for AGIs $25k-50k, 77.4% for AGIs $50k-75k, 73.8% for AGIs $75k-100k, 57.3% for AGIs $100k-200k)
Taxable interest for individuals: $875 (reported on 31.7% of returns)
This zip code:
$875
Virginia:
$1,600
(% of AGI for various income ranges: 0.5% for AGIs below $25k, 0.7% for AGIs $25k-50k, 0.4% for AGIs $50k-75k, 1.1% for AGIs $75k-100k, 0.4% for AGIs $100k-200k)
Ordinary dividends: $3,883 (reported on 18.3% of returns)
Here:
$3,883
State:
$6,959
(% of AGI for various income ranges: 1.3% for AGIs below $25k, 0.5% for AGIs $25k-50k, 0.6% for AGIs $50k-75k, 1.3% for AGIs $75k-100k, 3.3% for AGIs $100k-200k)
Net capital gain/loss in AGI: +$7,185 (reported on 10.3% of returns)
Here:
+$7,185
State:
+$16,672
(% of AGI for various income ranges: 0.3% for AGIs $75k-100k, 5.4% for AGIs $100k-200k)
Profit/loss from business: +$10,281 (reported on 12.7% of returns)
Here:
+$10,281
State:
+$14,116
(% of AGI for various income ranges: 5.7% for AGIs below $25k, 3.7% for AGIs $25k-50k, 1.6% for AGIs $50k-75k, 7.1% for AGIs $75k-100k)
Taxable individual retirement arrangement distribution: $14,536 (reported on 8.7% of returns)
23149:
$14,536
Virginia:
$16,667
(% of AGI for various income ranges: 1.4% for AGIs below $25k, 4.6% for AGIs $25k-50k, 5.4% for AGIs $75k-100k, 2.9% for AGIs $100k-200k)
Total itemized deductions: $20,831 (25% of AGI, reported on 27.8% of returns)
Here:
$20,831
State:
$26,596
Here:
25.4% of AGI
State:
20.1% of AGI
(% of AGI for various income ranges: 9.2% for AGIs below $25k, 9.3% for AGIs $25k-50k, 11.5% for AGIs $50k-75k, 13.6% for AGIs $75k-100k, 17.7% for AGIs $100k-200k)
Charity contributions: $3,079 (reported on 22.2% of returns)
Here:
$3,079
State:
$4,443
(% of AGI for various income ranges: 0.9% for AGIs below $25k, 1.1% for AGIs $25k-50k, 1.2% for AGIs $50k-75k, 1.5% for AGIs $75k-100k, 2.3% for AGIs $100k-200k)
Taxes paid: $5,726 (reported on 27.8% of returns)
23149:
$5,726
State:
$9,951
(% of AGI for various income ranges: 1.2% for AGIs below $25k, 1.8% for AGIs $25k-50k, 3.1% for AGIs $50k-75k, 3.9% for AGIs $75k-100k, 5.9% for AGIs $100k-200k)
Earned income credit: $1,993 (reported on 21.4% of returns)
Here:
$1,993
State:
$2,211
(% of AGI for various income ranges: 6.1% for AGIs below $25k, 1.0% for AGIs $25k-50k)
Percentage of individuals using paid preparers for their 2012 taxes: 46.0%
Here:
46%
State:
46%
(% for various income ranges: 42.6% for AGIs below $25k, 43.3% for AGIs $25k-50k, 42.1% for AGIs $50k-75k, 63.6% for AGIs $75k-100k, 58.3% for AGIs $100k-200k)
Averages for the 2004 tax year for zip code 23149, filed in 2005:
Average Adjusted Gross Income (AGI) in 2004: $37,219 (Individual Income Tax Returns)
Here:
$37,219
State:
$56,704
Salary/wage: $32,024 (reported on 85.0% of returns)
Here:
$32,024
State:
$48,441
(% of AGI for various income ranges: 123.2% for AGIs below $10k, 76.7% for AGIs $10k-25k, 80.1% for AGIs $25k-50k, 81.0% for AGIs $50k-75k, 80.5% for AGIs $75k-100k, 44.3% for AGIs over 100k)
Taxable interest for individuals: $1,224 (reported on 39.8% of returns)
This zip code:
$1,224
Virginia:
$1,688
(% of AGI for various income ranges: 5.9% for AGIs below $10k, 1.4% for AGIs $10k-25k, 1.5% for AGIs $25k-50k, 0.7% for AGIs $50k-75k, 1.7% for AGIs $75k-100k, 1.0% for AGIs over 100k)
Taxable dividends: $2,962 (reported on 20.5% of returns)
Here:
$2,962
State:
$4,028
(% of AGI for various income ranges: 6.8% for AGIs below $10k, 1.2% for AGIs $10k-25k, 0.9% for AGIs $25k-50k, 0.7% for AGIs $50k-75k, 1.9% for AGIs $75k-100k, 3.0% for AGIs over 100k)
Net capital gain/loss: +$5,236 (reported on 14.1% of returns)
Here:
+$5,236
State:
+$14,375
(% of AGI for various income ranges: 0.8% for AGIs below $10k, -0.3% for AGIs $10k-25k, -0.2% for AGIs $25k-50k, 0.4% for AGIs $50k-75k, 1.2% for AGIs $75k-100k, 8.4% for AGIs over 100k)
Profit/loss from business: +$6,482 (reported on 14.9% of returns)
Here:
+$6,482
State:
+$13,342
(% of AGI for various income ranges: 2.8% for AGIs below $10k, 7.0% for AGIs $10k-25k, 1.7% for AGIs $25k-50k, 1.8% for AGIs $50k-75k, 4.8% for AGIs $75k-100k)
IRA payment deduction: $2,741 (reported on 2.4% of returns)
23149:
$2,741
Virginia:
$2,943
Total itemized deductions: $16,180 (24% of AGI, reported on 28.1% of returns)
Here:
$16,180
State:
$21,492
Here:
24.2% of AGI
State:
21.0% of AGI
(% of AGI for various income ranges: 12.7% for AGIs $10k-25k, 12.5% for AGIs $25k-50k, 11.5% for AGIs $50k-75k, 13.4% for AGIs $75k-100k, 12.3% for AGIs over 100k)
Charity contributions deductions: $2,445 (4% of AGI, reported on 24.6% of returns)
Here:
$2,445
State:
$3,794
Here:
3.5% of AGI
State:
3.5% of AGI
(% of AGI for various income ranges: 1.3% for AGIs $10k-25k, 1.2% for AGIs $25k-50k, 1.6% for AGIs $50k-75k, 2.2% for AGIs $75k-100k, 2.0% for AGIs over 100k)
Total tax: $4,905 (reported on 72.7% of returns)
23149:
$4,905
State:
$9,537
(% of AGI for various income ranges: 3.6% for AGIs below $10k, 4.1% for AGIs $10k-25k, 6.9% for AGIs $25k-50k, 8.5% for AGIs $50k-75k, 10.3% for AGIs $75k-100k, 17.4% for AGIs over 100k)
Earned income credit: $1,716 (reported on 19.4% of returns)
Here:
$1,716
State:
$1,734
Percentage of individuals using paid preparers for their 2004 taxes: 55.9%
Here:
56%
State:
52%
(% for various income ranges: 45.7% for AGIs below $10k, 59.1% for AGIs $10k-25k, 60.2% for AGIs $25k-50k, 46.9% for AGIs $50k-75k, 59.0% for AGIs $75k-100k, 78.4% for AGIs over 100k)
Household received Food Stamps/SNAP in the past 12 months: 106 Household did not receive Food Stamps/SNAP in the past 12 months: 869
Women who did not have a birth in the past 12 months: 453 (207 now married, 245 unmarried)
Housing units in zip code 23149 with a mortgage: 301 (19 second mortgage, 11 both second mortgage and home equity loan) Median monthly owner costs for units with a mortgage: $1,241 Median monthly owner costs for units without a mortgage: $451
Residents with income below the poverty level in 2022:
This zip code:
8.5%
Whole state:
10.6%
Residents with income below 50% of the poverty level in 2022:
This zip code:
6.6%
Whole state:
5.2%
Median number of rooms in houses and condos:
Here:
6.9
State:
7.0
Median number of rooms in apartments:
Here:
5.7
State:
4.3
Notable locations in this zip code not listed on our city pages
Notable locations in zip code 23149: Middle Peninsula Landfill (A), Saluda Landing Boat Ramp (B), Jones Store (C), Saluda Landing (D), Lower King and Queen Volunteer Fire Department Substation (E), Middlesex County Courthouse (F), Middlesex County Sheriff's Office (G), Riverside Convalescent Center at Saluda (H), Middlesex County Public Library (I). Display/hide their locations on the map
Churches in zip code 23149 include: Antioch Church (A), Beulah Church (B), Shacklefords Chapel (C), Calvary Church (D), Zion Branch Church (E), Christ Church (F), Emmanuel Church (G), New Hope Church (H). Display/hide their locations on the map
Tourist attraction (not listed on the city page) : Middlesex County Museum (Cultural Attractions- Events- & Facilities; 777 General Puller Hwy) (1). Display/hide its approximate location on the map
In group quarters: 262 (-1 institutionalized population)
Size of family households: 384 2-persons, 116 3-persons, 62 4-persons, 55 5-persons, 20 6-persons
Size of nonfamily households: 243 1-person, 94 2-persons
36 married couples with children.
22 single-parent households (22 women).
93.0% of residents of 23149 zip code speak English at home.
6.0% of residents speak Spanish at home (59% very well, 14% well, 27% not well).
0.7% of residents speak other Indo-European language at home (100% very well).
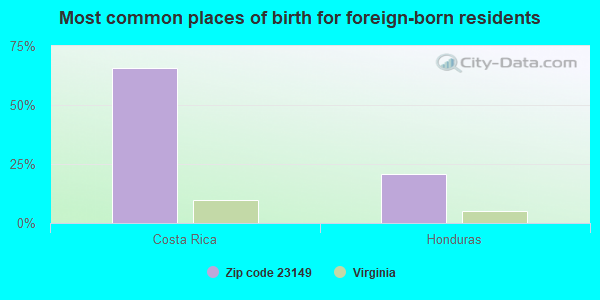
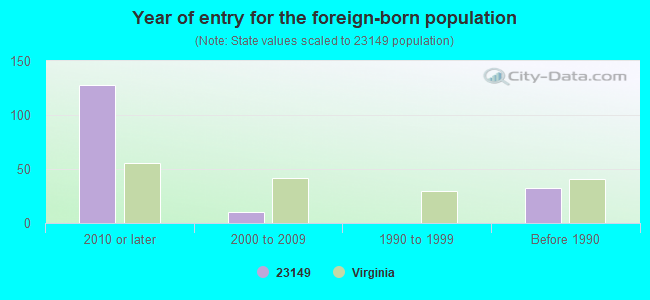
Foreign born population: 127 (4.9%) (24.3% of them are naturalized citizens)
This zip code:
4.9%
Whole state:
12.7%
66%Costa Rica
21%Honduras
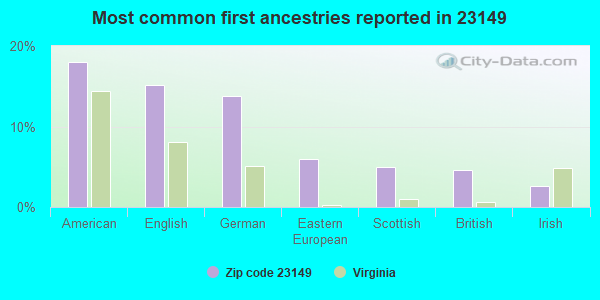
18%American
15%English
14%German
6%Eastern European
5%Scottish
5%British
3%Irish
Year of entry for the foreign-born population
1282010 or later
102000 to 2009
01990 to 1999
32Before 1990
Facilities with environmental interests located in this zip code:
CARLTON AND EDWARDS LUMBER (ROUTE 17 in SALUDA, VA)
AIR MINOR (AIRS/AFS) STATE MASTER (Virginia pollutants databases) - CEDS-40425, AIR PROGRAM Business SIC classification: SAWMILLS AND PLANING MILLS, GENERAL Business NAICS classification: SAWMILLS. Alternative names: CARLTON AND EDWARDS SAWMILL
7-ELEVEN #20570 (14865 GEORGE WASHINGTON ME in SALUDA, VA)
Small Quantity Generators, between 100 kg and 1000 kg of hazardous waste/month (Resource Conservation and Recovery Act (tracking hazardous waste)) - notification Organizations: OPERNAME (CONTACT/OPERATOR)
, SOUTHLAND CORPORATION THE (CONTACT/OWNER)
BRANSCOME INCORPORATED - GLOUCESTER (3542 LEWIS B PULLER MEMORIAL H in GLENNS, VA)
AIR MINOR (AIRS/AFS) Business SIC classification: READY-MIXED CONCRETE
Housing units lacking complete plumbing facilities: 4.2% Housing units lacking complete kitchen facilities: 4.3%
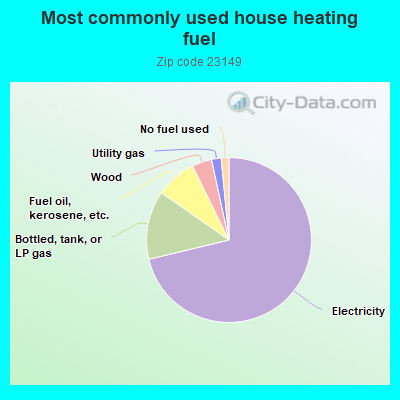
71.4%Electricity
13.5%Bottled, tank, or LP gas
8.0%Fuel oil, kerosene, etc.
3.9%Wood
1.9%Utility gas
1.5%No fuel used
Population in 1990: 3,215.
Place of birth for U.S.-born residents:
This state: 1,625
Northeast: 256
Midwest: 166
South: 347
West: 23
59% of the 23149 zip code residents lived in the same house 5 years ago. Out of people who lived in different houses, 36% lived in this county. Out of people who lived in different counties, 50% lived in Virginia.
92% of the 23149 zip code residents lived in the same house 1 year ago. Out of people who lived in different houses, 13% moved from this county. Out of people who lived in different houses, 83% moved from different county within same state. Out of people who lived in different houses, 8% moved from different state.
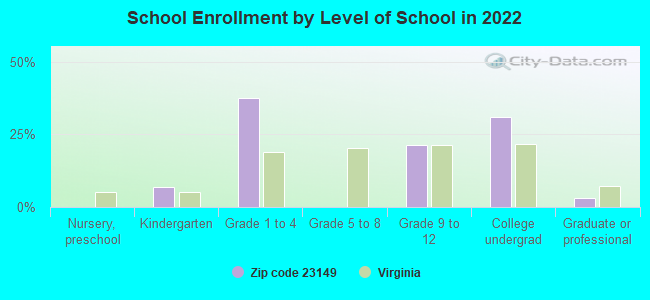
Private vs. public school enrollment:
Students in private schools in grades 1 to 8 (elementary and middle school):
Here:
0.0%
Virginia:
13.2%
Students in private schools in grades 9 to 12 (high school):
Here:
0.0%
Virginia:
10.2%
Students in private undergraduate colleges: 25
Here:
33.0%
Virginia:
18.7%
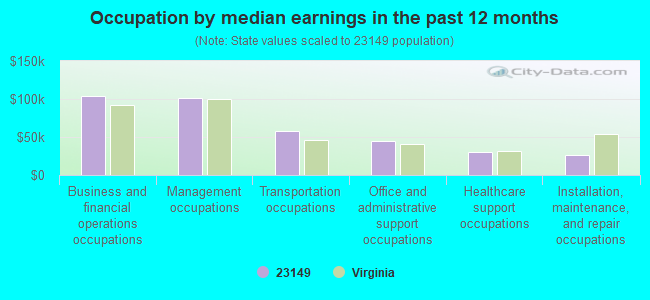
Occupation by median earnings in the past 12 months ($)
103,303Business and financial operations occupations
100,832Management occupations
57,706Transportation occupations
44,664Office and administrative support occupations
29,860Healthcare support occupations
26,955Installation, maintenance, and repair occupations
Companies with federal contracts located in this zip code:
SAWCO LLC (5041 GENERAL PULLER HWY in SALUDA, VA; small business) 50 employees, $0 revenue. Veteran Owned Business, Service Disabled Veteran Owned Firm
$2,000 with Army for Non-nuclear Ship Repair (East) Ship repair (including overhauls and conversions) performed on non-nuclear propelled and nonpropelled ships east of the 108th meridian. Signed on 2004-09-22. Completion date: 2004-09-30.
Top industries in this zip code by the number of employees in 2005:
Health Care and Social Assistance: Nursing Care Facilities (50-99 employees: 2 establishments)
Administrative and Support and Waste Management and Remediation Services: Solid Waste Landfill (50-99: 1)
Accommodation and Food Services: Limited-Service Restaurants (20-49: 1, 1-4: 1)
Accommodation and Food Services: Full-Service Restaurants (10-19: 1, 1-4: 1)
People in group quarters in 2010:
235 people in local jails and other municipal confinement facilities
57 people in nursing facilities/skilled-nursing facilities
21 people in workers' group living quarters and job corps centers
People in group quarters in 2000:
136 people in local jails and other confinement facilities (including police lockups)
115 people in nursing homes
Fatal accident statistics in 2014:
Fatal accident count: 1
Vehicles involved in fatal accidents: 2
Fatal accidents caused by drunken drivers: 1
Fatalities: 1
Persons involved in fatal accidents: 2
Pedestrians involved in fatal accidents: 0
Fatal accident statistics in 2012:
Fatal accident count: 1
Vehicles involved in fatal accidents: 1
Fatal accidents caused by drunken drivers: 0
Fatalities: 1
Persons involved in fatal accidents: 1
Pedestrians involved in fatal accidents: 0
Home Mortgage Disclosure Act Aggregated Statistics For Year 2009 (Based on 2 partial tracts)
A) FHA, FSA/RHS & VA Home Purchase Loans
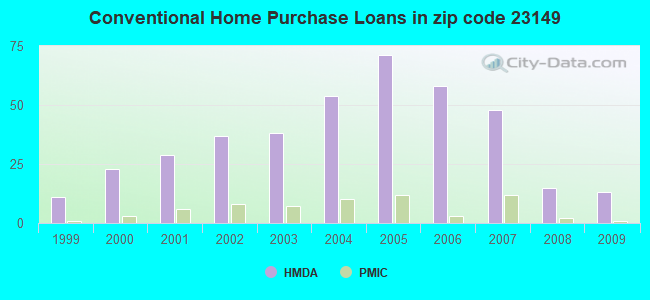
B) Conventional Home Purchase Loans
C) Refinancings
D) Home Improvement Loans
F) Non-occupant Loans on < 5 Family Dwellings (A B C & D)
G) Loans On Manufactured Home Dwelling (A B C & D)
Number
Average Value
Number
Average Value
Number
Average Value
Number
Average Value
Number
Average Value
Number
Average Value
LOANS ORIGINATED
28
$189,971
13
$188,629
95
$195,332
6
$103,645
9
$210,550
7
$109,631
APPLICATIONS APPROVED, NOT ACCEPTED
0
$0
2
$91,020
8
$188,584
0
$0
1
$150,710
1
$99,940
APPLICATIONS DENIED
1
$189,970
5
$120,884
50
$175,551
3
$52,087
4
$149,022
7
$97,507
APPLICATIONS WITHDRAWN
2
$119,970
2
$196,120
28
$179,334
4
$162,508
3
$192,617
1
$96,370
FILES CLOSED FOR INCOMPLETENESS
1
$343,460
1
$195,920
8
$201,472
0
$0
1
$187,990
0
$0
Aggregated Statistics For Year 2008 (Based on 2 partial tracts)
A) FHA, FSA/RHS & VA Home Purchase Loans
B) Conventional Home Purchase Loans
C) Refinancings
D) Home Improvement Loans
F) Non-occupant Loans on < 5 Family Dwellings (A B C & D)
G) Loans On Manufactured Home Dwelling (A B C & D)
Number
Average Value
Number
Average Value
Number
Average Value
Number
Average Value
Number
Average Value
Number
Average Value
LOANS ORIGINATED
17
$191,418
15
$222,731
73
$177,139
15
$81,250
5
$297,926
8
$113,130
APPLICATIONS APPROVED, NOT ACCEPTED
0
$0
0
$0
7
$156,374
2
$80,905
0
$0
0
$0
APPLICATIONS DENIED
2
$150,310
3
$150,310
55
$193,339
9
$49,751
2
$119,180
4
$96,078
APPLICATIONS WITHDRAWN
2
$179,065
3
$185,873
16
$209,058
3
$83,947
1
$262,950
3
$119,510
FILES CLOSED FOR INCOMPLETENESS
0
$0
1
$107,080
5
$175,138
1
$130,880
0
$0
1
$135,640
Aggregated Statistics For Year 2007 (Based on 2 partial tracts)
A) FHA, FSA/RHS & VA Home Purchase Loans
B) Conventional Home Purchase Loans
C) Refinancings
D) Home Improvement Loans
F) Non-occupant Loans on < 5 Family Dwellings (A B C & D)
G) Loans On Manufactured Home Dwelling (A B C & D)
Number
Average Value
Number
Average Value
Number
Average Value
Number
Average Value
Number
Average Value
Number
Average Value
LOANS ORIGINATED
8
$183,428
48
$181,568
89
$170,903
20
$79,756
8
$208,165
10
$108,867
APPLICATIONS APPROVED, NOT ACCEPTED
0
$0
2
$145,950
16
$146,718
3
$56,183
1
$244,700
2
$99,350
APPLICATIONS DENIED
0
$0
10
$178,827
72
$185,086
12
$108,140
2
$91,020
7
$86,741
APPLICATIONS WITHDRAWN
0
$0
4
$219,618
36
$167,762
4
$150,908
0
$0
2
$118,585
FILES CLOSED FOR INCOMPLETENESS
0
$0
1
$289,910
10
$182,912
1
$47,590
1
$162,610
0
$0
Aggregated Statistics For Year 2006 (Based on 2 partial tracts)
A) FHA, FSA/RHS & VA Home Purchase Loans
B) Conventional Home Purchase Loans
C) Refinancings
D) Home Improvement Loans
F) Non-occupant Loans on < 5 Family Dwellings (A B C & D)
G) Loans On Manufactured Home Dwelling (A B C & D)
Number
Average Value
Number
Average Value
Number
Average Value
Number
Average Value
Number
Average Value
Number
Average Value
LOANS ORIGINATED
16
$201,696
58
$158,059
115
$154,012
23
$62,663
13
$212,578
13
$108,638
APPLICATIONS APPROVED, NOT ACCEPTED
0
$0
6
$143,503
18
$140,991
4
$58,002
2
$167,565
3
$68,613
APPLICATIONS DENIED
2
$103,315
15
$121,941
62
$147,759
12
$71,222
5
$100,420
13
$61,138
APPLICATIONS WITHDRAWN
1
$112,630
9
$188,738
44
$138,531
4
$76,545
3
$226,857
3
$125,853
FILES CLOSED FOR INCOMPLETENESS
0
$0
4
$166,075
12
$154,079
0
$0
0
$0
0
$0
Aggregated Statistics For Year 2005 (Based on 2 partial tracts)
A) FHA, FSA/RHS & VA Home Purchase Loans
B) Conventional Home Purchase Loans
C) Refinancings
D) Home Improvement Loans
F) Non-occupant Loans on < 5 Family Dwellings (A B C & D)
G) Loans On Manufactured Home Dwelling (A B C & D)
Number
Average Value
Number
Average Value
Number
Average Value
Number
Average Value
Number
Average Value
Number
Average Value
LOANS ORIGINATED
14
$149,065
71
$141,782
112
$133,112
17
$43,323
15
$139,524
15
$91,218
APPLICATIONS APPROVED, NOT ACCEPTED
1
$173,710
5
$106,764
24
$114,419
2
$48,585
1
$67,030
2
$115,410
APPLICATIONS DENIED
2
$100,540
15
$90,002
66
$122,093
17
$74,654
2
$90,225
16
$79,072
APPLICATIONS WITHDRAWN
2
$141,985
8
$134,596
44
$128,345
7
$119,603
2
$197,310
2
$103,515
FILES CLOSED FOR INCOMPLETENESS
0
$0
2
$171,530
7
$105,383
1
$56,320
0
$0
0
$0
Aggregated Statistics For Year 2004 (Based on 2 partial tracts)
A) FHA, FSA/RHS & VA Home Purchase Loans
B) Conventional Home Purchase Loans
C) Refinancings
D) Home Improvement Loans
F) Non-occupant Loans on < 5 Family Dwellings (A B C & D)
G) Loans On Manufactured Home Dwelling (A B C & D)
Number
Average Value
Number
Average Value
Number
Average Value
Number
Average Value
Number
Average Value
Number
Average Value
LOANS ORIGINATED
17
$127,822
54
$139,970
89
$107,376
14
$36,062
12
$170,340
13
$76,513
APPLICATIONS APPROVED, NOT ACCEPTED
0
$0
8
$149,320
12
$113,692
3
$84,210
1
$258,980
2
$81,305
APPLICATIONS DENIED
2
$118,185
17
$102,159
59
$107,405
13
$39,446
4
$92,805
15
$63,615
APPLICATIONS WITHDRAWN
1
$195,520
4
$119,378
38
$110,057
4
$43,230
1
$99,550
2
$79,120
FILES CLOSED FOR INCOMPLETENESS
0
$0
4
$123,740
6
$106,288
1
$33,710
0
$0
1
$131,670
Aggregated Statistics For Year 2003 (Based on 2 partial tracts)
A) FHA, FSA/RHS & VA Home Purchase Loans
B) Conventional Home Purchase Loans
C) Refinancings
D) Home Improvement Loans
F) Non-occupant Loans on < 5 Family Dwellings (A B C & D)
Number
Average Value
Number
Average Value
Number
Average Value
Number
Average Value
Number
Average Value
LOANS ORIGINATED
20
$121,558
38
$107,520
165
$108,212
15
$15,467
15
$95,977
APPLICATIONS APPROVED, NOT ACCEPTED
1
$63,850
3
$69,933
25
$101,180
1
$19,040
2
$33,910
APPLICATIONS DENIED
4
$110,355
9
$64,470
59
$92,233
6
$32,918
4
$48,385
APPLICATIONS WITHDRAWN
2
$112,040
5
$96,216
40
$100,756
0
$0
1
$103,510
FILES CLOSED FOR INCOMPLETENESS
0
$0
4
$118,385
8
$120,665
0
$0
0
$0
Aggregated Statistics For Year 2002 (Based on 2 partial tracts)
A) FHA, FSA/RHS & VA Home Purchase Loans
B) Conventional Home Purchase Loans
C) Refinancings
D) Home Improvement Loans
F) Non-occupant Loans on < 5 Family Dwellings (A B C & D)
Number
Average Value
Number
Average Value
Number
Average Value
Number
Average Value
Number
Average Value
LOANS ORIGINATED
19
$121,046
37
$102,784
91
$99,329
6
$25,052
12
$92,209
APPLICATIONS APPROVED, NOT ACCEPTED
1
$100,340
7
$68,726
14
$81,275
1
$31,330
1
$130,480
APPLICATIONS DENIED
2
$57,310
12
$93,168
56
$86,324
8
$16,459
3
$45,213
APPLICATIONS WITHDRAWN
2
$72,975
2
$155,865
38
$99,860
2
$39,460
0
$0
FILES CLOSED FOR INCOMPLETENESS
0
$0
1
$70,990
6
$117,525
0
$0
0
$0
Aggregated Statistics For Year 2001 (Based on 2 partial tracts)
A) FHA, FSA/RHS & VA Home Purchase Loans
B) Conventional Home Purchase Loans
C) Refinancings
D) Home Improvement Loans
F) Non-occupant Loans on < 5 Family Dwellings (A B C & D)
Number
Average Value
Number
Average Value
Number
Average Value
Number
Average Value
Number
Average Value
LOANS ORIGINATED
19
$100,403
29
$105,345
74
$101,004
10
$19,275
10
$101,807
APPLICATIONS APPROVED, NOT ACCEPTED
1
$72,970
2
$62,070
13
$73,493
1
$21,420
0
$0
APPLICATIONS DENIED
2
$94,390
12
$61,010
44
$72,596
8
$22,705
1
$44,820
APPLICATIONS WITHDRAWN
1
$182,040
4
$74,660
24
$94,176
1
$15,860
3
$78,130
FILES CLOSED FOR INCOMPLETENESS
0
$0
1
$46,400
8
$95,580
1
$21,810
0
$0
Aggregated Statistics For Year 2000 (Based on 2 partial tracts)
A) FHA, FSA/RHS & VA Home Purchase Loans
B) Conventional Home Purchase Loans
C) Refinancings
D) Home Improvement Loans
F) Non-occupant Loans on < 5 Family Dwellings (A B C & D)
Number
Average Value
Number
Average Value
Number
Average Value
Number
Average Value
Number
Average Value
LOANS ORIGINATED
13
$102,842
23
$88,614
38
$78,391
8
$14,476
6
$113,032
APPLICATIONS APPROVED, NOT ACCEPTED
1
$54,330
4
$70,695
7
$51,104
2
$21,020
1
$21,810
APPLICATIONS DENIED
4
$49,378
19
$50,827
36
$61,738
7
$29,066
0
$0
APPLICATIONS WITHDRAWN
4
$84,872
3
$119,113
12
$72,512
1
$64,650
0
$0
FILES CLOSED FOR INCOMPLETENESS
0
$0
0
$0
3
$71,257
0
$0
0
$0
Aggregated Statistics For Year 1999 (Based on 1 partial tract)
A) FHA, FSA/RHS & VA Home Purchase Loans
B) Conventional Home Purchase Loans
C) Refinancings
D) Home Improvement Loans
F) Non-occupant Loans on < 5 Family Dwellings (A B C & D)
Detailed PMIC statistics for the following Tracts:1001.00
2003 - 2018 National Fire Incident Reporting System (NFIRS) incidents
According to the data from the years 2003 - 2018 the average number of fire incidents per year is 6. The highest number of fire incidents - 13 took place in 2016, and the least - 1 in 2005. The data has a declining trend.
When looking into fire subcategories, the most incidents belonged to: Structure Fires (49.0%), and Outside Fires (22.0%).
Fire incident types reported to NFIRS in Zip Code 23149


 Nearest zip codes: 23175, 23032, 23092, 23156, 23180, 23108.


 According to the data from the years 2003 - 2018 the average number of fire incidents per year is 6. The highest number of fire incidents - 13 took place in 2016, and the least - 1 in 2005. The data has a declining trend.
 When looking into fire subcategories, the most incidents belonged to: Structure Fires (49.0%), and Outside Fires (22.0%).