Estimated zip code population in 2022: 1,648 Zip code population in 2010: 1,907 Zip code population in 2000: 1,868
Houses and condos: 1,302 Renter-occupied apartments: 203
% of renters here:
24%
State:
33%
March 2022 cost of living index in zip code 23175: 87.3 (less than average, U.S. average is 100)
Land area: 16.3 sq. mi. Water area: 3.4 sq. mi.
Population density: 101 people per square mile
(very low).
OSM Map
General Map
Google Map
MSN Map
OSM Map
General Map
Google Map
MSN Map
OSM Map
General Map
Google Map
MSN Map
OSM Map
General Map
Google Map
MSN Map
Please wait while loading the map...
Real estate property taxes paid for housing units in 2022:
This zip code:
0.5% ($1,682)
Virginia:
0.7% ($2,617)
Median real estate property taxes paid for housing units with mortgages in 2022: $1,369 (0.4%) Median real estate property taxes paid for housing units with no mortgage in 2022: $1,963 (0.6%)
Business Search- 14 Million verified businesses
Males: 778
(47.2%)
Females: 869
(52.8%)
For population 25 years and over in 23175:
High school or higher: 96.8%
Bachelor's degree or higher: 30.0%
Graduate or professional degree: 11.2%
Unemployed: 1.4%
Mean travel time to work (commute): 28.1 minutes
For population 15 years and over in 23175:
Never married: 12.9%
Now married: 61.1%
Separated: 2.5%
Widowed: 7.4%
Divorced: 16.0%
Zip code 23175 compared to state average:
Median household income below state average.
Unemployed percentage below state average.
Hispanic race population percentage significantly below state average.
Median age significantly above state average.
Foreign-born population percentage significantly below state average.
Length of stay since moving in significantly above state average.
Averages for the 2020 tax year for zip code 23175, filed in 2021:
Average Adjusted Gross Income (AGI) in 2020: $76,868 (Individual Income Tax Returns)
Here:
$76,868
State:
$86,446
Salary/wage: $57,260 (reported on 72.7% of returns)
Here:
$57,260
State:
$71,185
(% of AGI for various income ranges: 1170.0% for AGIs below $25k, 3764.4% for AGIs $25k-50k, 5091.2% for AGIs $50k-75k, 7720.0% for AGIs $75k-100k, 11838.8% for AGIs $100k-200k)
Taxable interest for individuals: $1,972 (reported on 46.5% of returns)
This zip code:
$1,972
Virginia:
$1,805
(% of AGI for various income ranges: 22.4% for AGIs below $25k, 91.9% for AGIs $25k-50k, 92.5% for AGIs $50k-75k, 230.0% for AGIs $75k-100k, 457.5% for AGIs $100k-200k)
Ordinary dividends: $12,575 (reported on 32.3% of returns)
Here:
$12,575
State:
$8,327
(% of AGI for various income ranges: 63.8% for AGIs below $25k, 110.0% for AGIs $25k-50k, 442.5% for AGIs $50k-75k, 561.7% for AGIs $75k-100k, 1555.0% for AGIs $100k-200k)
Net capital gain/loss in AGI: +$16,359 (reported on 27.3% of returns)
Here:
+$16,359
State:
+$24,644
(% of AGI for various income ranges: 7.1% for AGIs below $25k, 60.0% for AGIs $25k-50k, 75.0% for AGIs $50k-75k, 435.0% for AGIs $75k-100k, 808.8% for AGIs $100k-200k)
Profit/loss from business: +$14,171 (reported on 17.2% of returns)
Here:
+$14,171
State:
+$12,836
(% of AGI for various income ranges: 153.3% for AGIs below $25k, 207.5% for AGIs $25k-50k, 207.5% for AGIs $50k-75k, 1986.2% for AGIs $100k-200k)
Taxable individual retirement arrangement distribution: $27,986 (reported on 14.1% of returns)
23175:
$27,986
Virginia:
$21,535
(% of AGI for various income ranges: 42.4% for AGIs below $25k, 148.1% for AGIs $25k-50k, 437.5% for AGIs $50k-75k, 618.3% for AGIs $75k-100k, 3588.8% for AGIs $100k-200k)
Total itemized deductions: $32,027 (reported on 11.1% of returns)
Here:
$32,027
State:
$33,287
(% of AGI for various income ranges: 211.9% for AGIs below $25k, 1343.8% for AGIs $50k-75k, 1311.2% for AGIs $100k-200k)
Charity contributions: $7,567 (reported on 9.1% of returns)
Here:
$7,567
State:
$10,381
(% of AGI for various income ranges: 106.9% for AGIs $25k-50k, 397.5% for AGIs $100k-200k)
Taxes paid: $6,645 (reported on 11.1% of returns)
23175:
$6,645
State:
$8,284
(% of AGI for various income ranges: 30.0% for AGIs below $25k, 160.0% for AGIs $50k-75k, 298.8% for AGIs $100k-200k)
Earned income credit: $2,071 (reported on 14.1% of returns)
Here:
$2,071
State:
$2,214
(% of AGI for various income ranges: 94.3% for AGIs below $25k, 57.5% for AGIs $25k-50k)
Percentage of individuals using paid preparers for their 2020 taxes: 92.9%
Here:
93%
State:
92%
(% for various income ranges: 90.3% for AGIs below $25k, 92.0% for AGIs $25k-50k, 91.7% for AGIs $50k-75k, 100.0% for AGIs $75k-100k, 93.3% for AGIs $100k-200k, 100.0% for AGIs over 200k)
Averages for the 2012 tax year for zip code 23175, filed in 2013:
Average Adjusted Gross Income (AGI) in 2012: $54,723 (Individual Income Tax Returns)
Here:
$54,723
State:
$71,192
Salary/wage: $41,352 (reported on 75.5% of returns)
Here:
$41,352
State:
$59,229
(% of AGI for various income ranges: 68.6% for AGIs below $25k, 68.3% for AGIs $25k-50k, 59.9% for AGIs $50k-75k, 60.8% for AGIs $75k-100k, 55.3% for AGIs $100k-200k, 43.1% for AGIs over 200k)
Taxable interest for individuals: $1,513 (reported on 44.3% of returns)
This zip code:
$1,513
Virginia:
$1,600
(% of AGI for various income ranges: 1.0% for AGIs below $25k, 1.3% for AGIs $25k-50k, 1.0% for AGIs $50k-75k, 1.0% for AGIs $75k-100k, 1.6% for AGIs $100k-200k, 1.2% for AGIs over 200k)
Ordinary dividends: $8,578 (reported on 30.2% of returns)
Here:
$8,578
State:
$6,959
(% of AGI for various income ranges: 2.4% for AGIs below $25k, 2.7% for AGIs $25k-50k, 4.0% for AGIs $50k-75k, 4.5% for AGIs $75k-100k, 6.4% for AGIs $100k-200k, 5.8% for AGIs over 200k)
Net capital gain/loss in AGI: +$4,908 (reported on 23.6% of returns)
Here:
+$4,908
State:
+$16,672
(% of AGI for various income ranges: 3.6% for AGIs $50k-75k, 4.0% for AGIs $100k-200k, 3.1% for AGIs over 200k)
Profit/loss from business: +$9,218 (reported on 20.8% of returns)
Here:
+$9,218
State:
+$14,116
(% of AGI for various income ranges: 10.6% for AGIs below $25k, 6.6% for AGIs $25k-50k, 2.9% for AGIs $50k-75k, 4.6% for AGIs $100k-200k)
Taxable individual retirement arrangement distribution: $12,865 (reported on 16.0% of returns)
23175:
$12,865
Virginia:
$16,667
(% of AGI for various income ranges: 4.8% for AGIs below $25k, 2.2% for AGIs $25k-50k, 5.2% for AGIs $50k-75k, 4.7% for AGIs $75k-100k, 6.8% for AGIs $100k-200k)
Total itemized deductions: $22,925 (23% of AGI, reported on 34.0% of returns)
Here:
$22,925
State:
$26,596
Here:
22.7% of AGI
State:
20.1% of AGI
(% of AGI for various income ranges: 14.2% for AGIs below $25k, 11.1% for AGIs $25k-50k, 13.6% for AGIs $50k-75k, 12.5% for AGIs $75k-100k, 15.8% for AGIs $100k-200k, 16.1% for AGIs over 200k)
Charity contributions: $3,823 (reported on 28.3% of returns)
Here:
$3,823
State:
$4,443
(% of AGI for various income ranges: 1.1% for AGIs below $25k, 1.2% for AGIs $25k-50k, 1.7% for AGIs $50k-75k, 2.1% for AGIs $75k-100k, 2.5% for AGIs $100k-200k, 2.4% for AGIs over 200k)
Taxes paid: $7,197 (reported on 34.0% of returns)
23175:
$7,197
State:
$9,951
(% of AGI for various income ranges: 2.0% for AGIs below $25k, 2.2% for AGIs $25k-50k, 3.3% for AGIs $50k-75k, 3.5% for AGIs $75k-100k, 5.6% for AGIs $100k-200k, 6.9% for AGIs over 200k)
Earned income credit: $2,047 (reported on 17.9% of returns)
Here:
$2,047
State:
$2,211
(% of AGI for various income ranges: 6.5% for AGIs below $25k, 0.6% for AGIs $25k-50k)
Percentage of individuals using paid preparers for their 2012 taxes: 50.9%
Here:
51%
State:
46%
(% for various income ranges: 46.5% for AGIs below $25k, 48.0% for AGIs $25k-50k, 57.1% for AGIs $50k-75k, 44.4% for AGIs $75k-100k, 54.5% for AGIs $100k-200k, 100.0% for AGIs over 200k)
Averages for the 2004 tax year for zip code 23175, filed in 2005:
Average Adjusted Gross Income (AGI) in 2004: $50,865 (Individual Income Tax Returns)
Here:
$50,865
State:
$56,704
Salary/wage: $37,769 (reported on 80.0% of returns)
Here:
$37,769
State:
$48,441
(% of AGI for various income ranges: 112.5% for AGIs below $10k, 71.8% for AGIs $10k-25k, 70.7% for AGIs $25k-50k, 68.9% for AGIs $50k-75k, 66.2% for AGIs $75k-100k, 46.4% for AGIs over 100k)
Taxable interest for individuals: $3,069 (reported on 52.5% of returns)
This zip code:
$3,069
Virginia:
$1,688
(% of AGI for various income ranges: 7.0% for AGIs below $10k, 4.1% for AGIs $10k-25k, 1.8% for AGIs $25k-50k, 2.5% for AGIs $50k-75k, 1.5% for AGIs $75k-100k, 4.1% for AGIs over 100k)
Taxable dividends: $7,187 (reported on 34.7% of returns)
Here:
$7,187
State:
$4,028
(% of AGI for various income ranges: 25.6% for AGIs below $10k, 2.8% for AGIs $10k-25k, 1.4% for AGIs $25k-50k, 3.9% for AGIs $50k-75k, 4.1% for AGIs $75k-100k, 6.5% for AGIs over 100k)
Net capital gain/loss: +$11,766 (reported on 26.2% of returns)
Here:
+$11,766
State:
+$14,375
(% of AGI for various income ranges: 2.6% for AGIs below $10k, 0.8% for AGIs $10k-25k, 0.1% for AGIs $25k-50k, 2.5% for AGIs $50k-75k, 2.1% for AGIs $75k-100k, 11.6% for AGIs over 100k)
Profit/loss from business: +$10,774 (reported on 19.0% of returns)
Here:
+$10,774
State:
+$13,342
(% of AGI for various income ranges: 14.0% for AGIs below $10k, 4.6% for AGIs $10k-25k, 2.9% for AGIs $25k-50k, 3.0% for AGIs $50k-75k, 0.2% for AGIs $75k-100k, 5.6% for AGIs over 100k)
IRA payment deduction: $3,250 (reported on 4.2% of returns)
23175:
$3,250
Virginia:
$2,943
Total itemized deductions: $21,264 (21% of AGI, reported on 34.4% of returns)
Here:
$21,264
State:
$21,492
Here:
21.4% of AGI
State:
21.0% of AGI
(% of AGI for various income ranges: 17.9% for AGIs below $10k, 10.2% for AGIs $10k-25k, 11.4% for AGIs $25k-50k, 15.1% for AGIs $50k-75k, 14.7% for AGIs $75k-100k, 15.8% for AGIs over 100k)
Charity contributions deductions: $3,935 (4% of AGI, reported on 31.0% of returns)
Here:
$3,935
State:
$3,794
Here:
3.7% of AGI
State:
3.5% of AGI
(% of AGI for various income ranges: 1.4% for AGIs $10k-25k, 1.7% for AGIs $25k-50k, 2.3% for AGIs $50k-75k, 2.8% for AGIs $75k-100k, 2.8% for AGIs over 100k)
Total tax: $8,605 (reported on 75.5% of returns)
23175:
$8,605
State:
$9,537
(% of AGI for various income ranges: 3.6% for AGIs below $10k, 3.8% for AGIs $10k-25k, 7.4% for AGIs $25k-50k, 9.3% for AGIs $50k-75k, 10.8% for AGIs $75k-100k, 18.4% for AGIs over 100k)
Earned income credit: $1,844 (reported on 15.3% of returns)
Here:
$1,844
State:
$1,734
Percentage of individuals using paid preparers for their 2004 taxes: 57.4%
Here:
57%
State:
52%
(% for various income ranges: 55.1% for AGIs below $10k, 50.5% for AGIs $10k-25k, 56.0% for AGIs $25k-50k, 60.9% for AGIs $50k-75k, 55.6% for AGIs $75k-100k, 77.5% for AGIs over 100k)
Notable locations in zip code 23175: Urbanna Wharf (A), Locklies Landing (B), Virginian Landing (C), Central Middlesex Volunteer Rescue Squad (D), Middlesex Volunteer Fire Department (E). Display/hide their locations on the map
Churches in zip code 23175 include: Remlik Pilgrim Church (A), Valley Queen Church (B), Forest Chapel (C), Lebannon Church (D). Display/hide their locations on the map
Streams, rivers, and creeks: Urbanna Creek (A), Town Bridge Swamp (B), Robinson Creek (C), Perkins Creek (D), Nickleberry Swamp (E). Display/hide their locations on the map
In group quarters: 35 (-1 institutionalized population)
Size of family households: 440 2-persons, 45 3-persons, 18 4-persons, 11 7-or-more-persons
Size of nonfamily households: 324 1-person, 26 2-persons
60 married couples with children.
81 single-parent households (21 men, 60 women).
95.8% of residents of 23175 zip code speak English at home.
2.2% of residents speak Spanish at home (19% very well, 81% well).
0.9% of residents speak other Indo-European language at home (100% very well).
1.9% of residents speak Asian or Pacific Island language at home (100% very well).
Foreign born population: 46 (2.8%) (93.8% of them are naturalized citizens)
This zip code:
2.8%
Whole state:
12.7%
73%Micronesia
16%Austria
16%Guatemala
14%Serbia
5%Japan
45%American
16%English
3%European
3%Irish
2%German
1%French Canadian
1%Belgian
Year of entry for the foreign-born population
02010 or later
22000 to 2009
181990 to 1999
27Before 1990
Housing units lacking complete plumbing facilities: 5.2% Housing units lacking complete kitchen facilities: 5.9%
87.6%Electricity
7.8%Fuel oil, kerosene, etc.
3.5%Bottled, tank, or LP gas
1.0%Solar energy
Population in 1990: 698. Population change in the 1990s: +1,170 (+167.6%).
Place of birth for U.S.-born residents:
This state: 1,127
Northeast: 228
Midwest: 43
South: 136
West: 54
63% of the 23175 zip code residents lived in the same house 5 years ago. Out of people who lived in different houses, 45% lived in this county. Out of people who lived in different counties, 50% lived in Virginia.
91% of the 23175 zip code residents lived in the same house 1 year ago. Out of people who lived in different houses, 9% moved from this county. Out of people who lived in different houses, 84% moved from different county within same state. Out of people who lived in different houses, 11% moved from different state.
Private vs. public school enrollment:
Students in private schools in grades 1 to 8 (elementary and middle school): 10
Here:
10.4%
Virginia:
13.2%
Students in private schools in grades 9 to 12 (high school):
Here:
0.0%
Virginia:
10.2%
Students in private undergraduate colleges: 26
Here:
61.2%
Virginia:
18.7%
Occupation by median earnings in the past 12 months ($)
101,975Production occupations
68,353Health diagnosing and treating practitioners and other technical occupations
40,609Material moving occupations
39,839Office and administrative support occupations
32,757Management occupations
27,867Food preparation and serving related occupations
Companies with federal contracts located in this zip code:
RAPPAHANNOCK PRESS INC (276 VIRGINIA STREET in URBANNA, VA; small business) : $66 in 2 contractsin 2003
$43 with U.S. Army Corps of Engineers - civil program financing only for Administrative and Service Buildings. Signed on 2003-03-18. Completion date: 2003-04-17.
$23 with U.S. Army Corps of Engineers - civil program financing only for Other Administrative Support Services. Signed on 2003-01-08. Completion date: 2003-02-06.
Top industries in this zip code by the number of employees in 2005:
Health Care and Social Assistance: Services for the Elderly and Persons with Disabilities (100-249 employees: 1 establishment)
Accommodation and Food Services: Full-Service Restaurants (10-19: 4)
Information: Newspaper Publishers (20-49: 1)
Administrative and Support and Waste Management and Remediation Services: Temporary Help Services (20-49: 1)
Professional, Scientific, and Technical Services: Administrative Management and General Management Consulting Services (10-19: 1, 1-4: 3)
People in group quarters in 2010:
6 people in group homes intended for adults
6 people in residential treatment centers for adults
People in group quarters in 2000:
4 people in homes for the mentally retarded
Fatal accident statistics in 2010:
Fatal accident count: 1
Vehicles involved in fatal accidents: 1
Fatal accidents caused by drunken drivers: 0
Fatalities: 1
Persons involved in fatal accidents: 1
Pedestrians involved in fatal accidents: 0
2003 - 2018 National Fire Incident Reporting System (NFIRS) incidents
According to the data from the years 2003 - 2018 the average number of fire incidents per year is 13. The highest number of reported fires - 23 took place in 2016, and the least - 4 in 2012. The data has a dropping trend.
When looking into fire subcategories, the most incidents belonged to: Structure Fires (42.2%), and Other (22.3%).
Fire incident types reported to NFIRS in Zip Code 23175

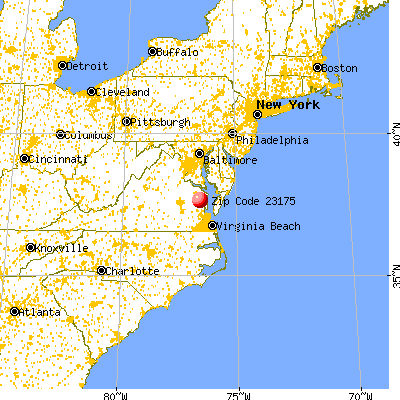


 Nearest zip codes: 23032, 23180, 23149, 23079, 23108, 23092.


 : $66 in 2 contracts in 2003


 According to the data from the years 2003 - 2018 the average number of fire incidents per year is 13. The highest number of reported fires - 23 took place in 2016, and the least - 4 in 2012. The data has a dropping trend.
 When looking into fire subcategories, the most incidents belonged to: Structure Fires (42.2%), and Other (22.3%).