Estimated zip code population in 2022: 4,227 Zip code population in 2010: 3,669 Zip code population in 2000: 3,441
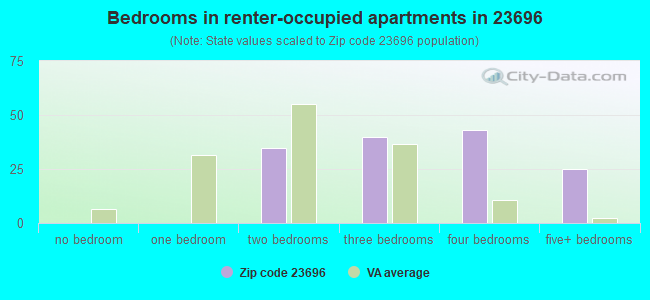
Houses and condos: 1,449 Renter-occupied apartments: 143
% of renters here:
10%
State:
33%
March 2022 cost of living index in zip code 23696: 97.0 (near average, U.S. average is 100)
Land area: 5.6 sq. mi. Water area: 2.0 sq. mi.
Population density: 754 people per square mile
(low).
OSM Map
General Map
Google Map
MSN Map
OSM Map
General Map
Google Map
MSN Map
OSM Map
General Map
Google Map
MSN Map
OSM Map
General Map
Google Map
MSN Map
Please wait while loading the map...
Real estate property taxes paid for housing units in 2022:
This zip code:
0.6% ($2,694)
Virginia:
0.7% ($2,617)
Median real estate property taxes paid for housing units with mortgages in 2022: $2,685 (0.6%) Median real estate property taxes paid for housing units with no mortgage in 2022: $2,775 (0.6%)
Business Search- 14 Million verified businesses
Males: 2,138
(50.6%)
Females: 2,089
(49.4%)
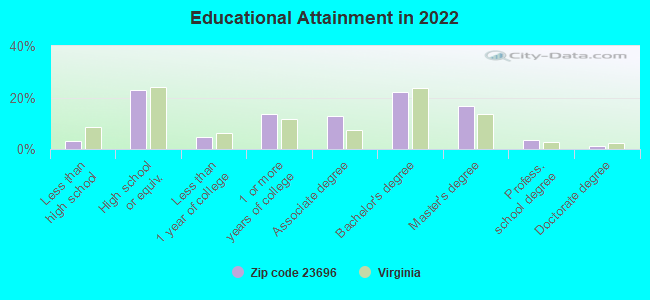
For population 25 years and over in 23696:
High school or higher: 96.8%
Bachelor's degree or higher: 43.0%
Graduate or professional degree: 21.1%
Unemployed: 1.8%
Mean travel time to work (commute): 23.0 minutes
For population 15 years and over in 23696:
Never married: 30.2%
Now married: 61.9%
Separated: 1.1%
Widowed: 2.9%
Divorced: 3.9%
Zip code 23696 compared to state average:
Unemployed percentage below state average.
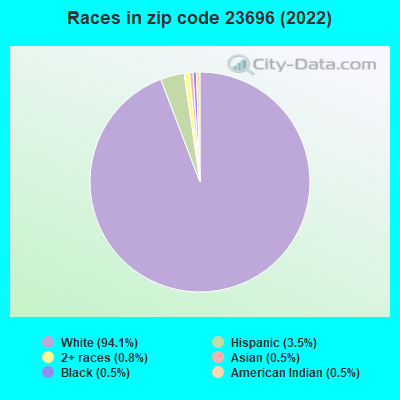
Black race population percentage significantly below state average.
Hispanic race population percentage below state average.
Foreign-born population percentage significantly below state average.
Renting percentage significantly below state average.
Length of stay since moving in significantly above state average.
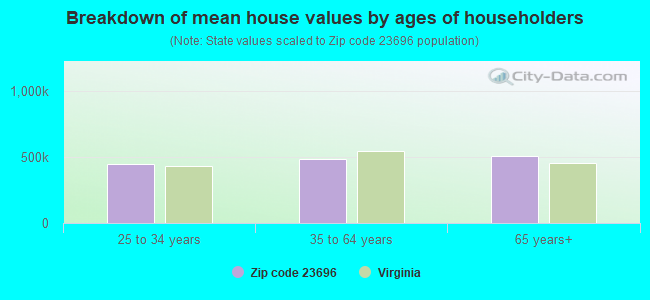
Estimated median house/condo value in 2022: $457,286
23696:
$457,286
Virginia:
$365,700
According to our research of Virginia and other state lists, there were 3 registered sex offenders living in 23696 zip code as of May 28, 2024. The ratio of all residents to sex offenders in zip code 23696 is 1,249 to 1. The ratio of registered sex offenders to all residents in this zip code is much lower than the state average.
Median resident age:
This zip code:
37.9 years
Virginia median age:
39.0 years
Average household size:
This zip code:
3.0 people
Virginia:
2.5 people
Averages for the 2020 tax year for zip code 23696, filed in 2021:
Average Adjusted Gross Income (AGI) in 2020: $98,673 (Individual Income Tax Returns)
Here:
$98,673
State:
$86,446
Salary/wage: $81,673 (reported on 79.5% of returns)
Here:
$81,673
State:
$71,185
(% of AGI for various income ranges: 1072.1% for AGIs below $25k, 3184.8% for AGIs $25k-50k, 5504.0% for AGIs $50k-75k, 9102.3% for AGIs $75k-100k, 19150.8% for AGIs $100k-200k, 61655.0% for AGIs over 200k)
Taxable interest for individuals: $1,130 (reported on 51.9% of returns)
This zip code:
$1,130
Virginia:
$1,805
(% of AGI for various income ranges: 28.6% for AGIs below $25k, 66.5% for AGIs $25k-50k, 66.0% for AGIs $50k-75k, 80.8% for AGIs $75k-100k, 151.5% for AGIs $100k-200k, 363.3% for AGIs over 200k)
Ordinary dividends: $6,094 (reported on 33.5% of returns)
Here:
$6,094
State:
$8,327
(% of AGI for various income ranges: 65.2% for AGIs below $25k, 85.2% for AGIs $25k-50k, 140.5% for AGIs $50k-75k, 226.9% for AGIs $75k-100k, 450.8% for AGIs $100k-200k, 2741.7% for AGIs over 200k)
Net capital gain/loss in AGI: +$10,829 (reported on 28.1% of returns)
Here:
+$10,829
State:
+$24,644
(% of AGI for various income ranges: 12.1% for AGIs below $25k, 51.3% for AGIs $25k-50k, 108.0% for AGIs $50k-75k, 190.8% for AGIs $75k-100k, 661.2% for AGIs $100k-200k, 5491.7% for AGIs over 200k)
Profit/loss from business: +$14,515 (reported on 14.6% of returns)
Here:
+$14,515
State:
+$12,836
(% of AGI for various income ranges: 101.0% for AGIs below $25k, 94.8% for AGIs $25k-50k, 138.5% for AGIs $50k-75k, 129.2% for AGIs $75k-100k, 490.0% for AGIs $100k-200k, 2815.0% for AGIs over 200k)
Taxable individual retirement arrangement distribution: $16,982 (reported on 15.1% of returns)
23696:
$16,982
Virginia:
$21,535
(% of AGI for various income ranges: 48.6% for AGIs below $25k, 135.7% for AGIs $25k-50k, 318.5% for AGIs $50k-75k, 438.5% for AGIs $75k-100k, 692.3% for AGIs $100k-200k, 2158.3% for AGIs over 200k)
Total itemized deductions: $29,729 (reported on 18.9% of returns)
Here:
$29,729
State:
$33,287
(% of AGI for various income ranges: 346.5% for AGIs $25k-50k, 474.0% for AGIs $50k-75k, 760.0% for AGIs $75k-100k, 1595.0% for AGIs $100k-200k, 5875.0% for AGIs over 200k)
Charity contributions: $8,764 (reported on 15.1% of returns)
Here:
$8,764
State:
$10,381
(% of AGI for various income ranges: 37.2% for AGIs below $25k, 62.5% for AGIs $50k-75k, 95.4% for AGIs $75k-100k, 420.0% for AGIs $100k-200k, 1675.0% for AGIs over 200k)
Taxes paid: $8,317 (reported on 18.9% of returns)
23696:
$8,317
State:
$8,284
(% of AGI for various income ranges: 48.7% for AGIs $25k-50k, 105.0% for AGIs $50k-75k, 251.5% for AGIs $75k-100k, 486.2% for AGIs $100k-200k, 1663.3% for AGIs over 200k)
Earned income credit: $1,793 (reported on 7.6% of returns)
Here:
$1,793
State:
$2,214
(% of AGI for various income ranges: 47.9% for AGIs below $25k, 48.7% for AGIs $25k-50k)
Percentage of individuals using paid preparers for their 2020 taxes: 92.4%
Here:
92%
State:
92%
(% for various income ranges: 90.2% for AGIs below $25k, 93.1% for AGIs $25k-50k, 96.2% for AGIs $50k-75k, 90.0% for AGIs $75k-100k, 92.2% for AGIs $100k-200k, 94.4% for AGIs over 200k)
Averages for the 2012 tax year for zip code 23696, filed in 2013:
Average Adjusted Gross Income (AGI) in 2012: $80,832 (Individual Income Tax Returns)
Here:
$80,832
State:
$71,192
Salary/wage: $66,411 (reported on 79.5% of returns)
Here:
$66,411
State:
$59,229
(% of AGI for various income ranges: 67.4% for AGIs below $25k, 71.0% for AGIs $25k-50k, 63.9% for AGIs $50k-75k, 70.5% for AGIs $75k-100k, 72.3% for AGIs $100k-200k, 49.5% for AGIs over 200k)
Taxable interest for individuals: $1,344 (reported on 50.0% of returns)
This zip code:
$1,344
Virginia:
$1,600
(% of AGI for various income ranges: 1.2% for AGIs below $25k, 1.0% for AGIs $25k-50k, 1.3% for AGIs $50k-75k, 0.3% for AGIs $75k-100k, 0.8% for AGIs $100k-200k, 0.9% for AGIs over 200k)
Ordinary dividends: $4,439 (reported on 36.4% of returns)
Here:
$4,439
State:
$6,959
(% of AGI for various income ranges: 3.3% for AGIs below $25k, 1.3% for AGIs $25k-50k, 1.5% for AGIs $50k-75k, 2.0% for AGIs $75k-100k, 1.5% for AGIs $100k-200k, 3.0% for AGIs over 200k)
Net capital gain/loss in AGI: +$7,781 (reported on 24.4% of returns)
Here:
+$7,781
State:
+$16,672
(% of AGI for various income ranges: 0.9% for AGIs below $25k, 1.0% for AGIs $50k-75k, 1.6% for AGIs $100k-200k, 6.8% for AGIs over 200k)
Profit/loss from business: +$11,762 (reported on 13.6% of returns)
Here:
+$11,762
State:
+$14,116
(% of AGI for various income ranges: 7.0% for AGIs below $25k, 0.8% for AGIs $25k-50k, 1.2% for AGIs $50k-75k, 2.3% for AGIs $75k-100k, 3.1% for AGIs $100k-200k)
Taxable individual retirement arrangement distribution: $16,390 (reported on 16.5% of returns)
23696:
$16,390
Virginia:
$16,667
(% of AGI for various income ranges: 4.3% for AGIs below $25k, 3.9% for AGIs $25k-50k, 3.9% for AGIs $50k-75k, 3.4% for AGIs $75k-100k, 5.0% for AGIs $100k-200k)
Total itemized deductions: $25,261 (21% of AGI, reported on 51.1% of returns)
Here:
$25,261
State:
$26,596
Here:
20.7% of AGI
State:
20.1% of AGI
(% of AGI for various income ranges: 18.9% for AGIs below $25k, 13.0% for AGIs $25k-50k, 16.6% for AGIs $50k-75k, 17.6% for AGIs $75k-100k, 17.3% for AGIs $100k-200k, 13.0% for AGIs over 200k)
Charity contributions: $3,697 (reported on 43.8% of returns)
Here:
$3,697
State:
$4,443
(% of AGI for various income ranges: 0.7% for AGIs below $25k, 1.3% for AGIs $25k-50k, 2.1% for AGIs $50k-75k, 2.2% for AGIs $75k-100k, 2.5% for AGIs $100k-200k, 1.5% for AGIs over 200k)
Taxes paid: $9,270 (reported on 50.6% of returns)
23696:
$9,270
State:
$9,951
(% of AGI for various income ranges: 3.4% for AGIs below $25k, 3.2% for AGIs $25k-50k, 4.4% for AGIs $50k-75k, 5.8% for AGIs $75k-100k, 6.7% for AGIs $100k-200k, 6.2% for AGIs over 200k)
Earned income credit: $1,908 (reported on 7.4% of returns)
Here:
$1,908
State:
$2,211
(% of AGI for various income ranges: 3.3% for AGIs below $25k, 0.7% for AGIs $25k-50k)
Percentage of individuals using paid preparers for their 2012 taxes: 41.5%
Here:
41%
State:
46%
(% for various income ranges: 32.6% for AGIs below $25k, 40.0% for AGIs $25k-50k, 44.4% for AGIs $50k-75k, 40.9% for AGIs $75k-100k, 45.2% for AGIs $100k-200k, 66.7% for AGIs over 200k)
Averages for the 2004 tax year for zip code 23696, filed in 2005:
Average Adjusted Gross Income (AGI) in 2004: $66,035 (Individual Income Tax Returns)
Here:
$66,035
State:
$56,704
Salary/wage: $54,793 (reported on 81.8% of returns)
Here:
$54,793
State:
$48,441
(% of AGI for various income ranges: 128.7% for AGIs below $10k, 66.6% for AGIs $10k-25k, 66.3% for AGIs $25k-50k, 72.6% for AGIs $50k-75k, 75.3% for AGIs $75k-100k, 63.0% for AGIs over 100k)
Taxable interest for individuals: $1,364 (reported on 66.1% of returns)
This zip code:
$1,364
Virginia:
$1,688
(% of AGI for various income ranges: 9.4% for AGIs below $10k, 2.2% for AGIs $10k-25k, 2.8% for AGIs $25k-50k, 1.6% for AGIs $50k-75k, 0.8% for AGIs $75k-100k, 1.0% for AGIs over 100k)
Taxable dividends: $2,633 (reported on 38.1% of returns)
Here:
$2,633
State:
$4,028
(% of AGI for various income ranges: 4.9% for AGIs below $10k, 2.2% for AGIs $10k-25k, 1.5% for AGIs $25k-50k, 1.7% for AGIs $50k-75k, 1.5% for AGIs $75k-100k, 1.3% for AGIs over 100k)
Net capital gain/loss: +$6,051 (reported on 28.2% of returns)
Here:
+$6,051
State:
+$14,375
(% of AGI for various income ranges: -3.2% for AGIs below $10k, -0.5% for AGIs $10k-25k, -0.3% for AGIs $25k-50k, 1.3% for AGIs $50k-75k, 1.8% for AGIs $75k-100k, 4.1% for AGIs over 100k)
Profit/loss from business: +$12,151 (reported on 12.5% of returns)
Here:
+$12,151
State:
+$13,342
(% of AGI for various income ranges: 10.6% for AGIs below $10k, 4.1% for AGIs $10k-25k, 2.0% for AGIs $25k-50k, 0.5% for AGIs $50k-75k, 0.8% for AGIs $75k-100k, 3.2% for AGIs over 100k)
IRA payment deduction: $3,417 (reported on 3.4% of returns)
23696:
$3,417
Virginia:
$2,943
(% of AGI for various income ranges: 0.3% for AGIs $25k-50k, 0.3% for AGIs $50k-75k, 0.3% for AGIs $75k-100k, 0.1% for AGIs over 100k)
Self-employed pension: $19,615 (reported on 0.7% of returns)
Here:
$19,615
Virginia:
$17,430
Total itemized deductions: $19,882 (19% of AGI, reported on 49.8% of returns)
Here:
$19,882
State:
$21,492
Here:
19.1% of AGI
State:
21.0% of AGI
(% of AGI for various income ranges: 23.9% for AGIs below $10k, 9.9% for AGIs $10k-25k, 13.8% for AGIs $25k-50k, 17.9% for AGIs $50k-75k, 18.0% for AGIs $75k-100k, 13.5% for AGIs over 100k)
Charity contributions deductions: $3,292 (3% of AGI, reported on 45.7% of returns)
Here:
$3,292
State:
$3,794
Here:
3.1% of AGI
State:
3.5% of AGI
(% of AGI for various income ranges: 1.6% for AGIs below $10k, 1.1% for AGIs $10k-25k, 1.5% for AGIs $25k-50k, 2.3% for AGIs $50k-75k, 2.7% for AGIs $75k-100k, 2.4% for AGIs over 100k)
Total tax: $10,897 (reported on 82.8% of returns)
23696:
$10,897
State:
$9,537
(% of AGI for various income ranges: 2.8% for AGIs below $10k, 4.5% for AGIs $10k-25k, 7.2% for AGIs $25k-50k, 8.2% for AGIs $50k-75k, 9.6% for AGIs $75k-100k, 19.0% for AGIs over 100k)
Earned income credit: $1,520 (reported on 5.7% of returns)
Here:
$1,520
State:
$1,734
Percentage of individuals using paid preparers for their 2004 taxes: 45.7%
Here:
46%
State:
52%
(% for various income ranges: 30.7% for AGIs below $10k, 44.9% for AGIs $10k-25k, 51.8% for AGIs $25k-50k, 52.1% for AGIs $50k-75k, 45.0% for AGIs $75k-100k, 50.3% for AGIs over 100k)
Household received Food Stamps/SNAP in the past 12 months: 54 Household did not receive Food Stamps/SNAP in the past 12 months: 1,325
Women who had a birth in the past 12 months: 22 (22 now married, 0 unmarried) Women who did not have a birth in the past 12 months: 900 (414 now married, 485 unmarried)
Housing units in zip code 23696 with a mortgage: 916 (234 second mortgage, 29 home equity loan, 172 both second mortgage and home equity loan) Median monthly owner costs for units with a mortgage: $2,217 Median monthly owner costs for units without a mortgage: $650
Residents with income below the poverty level in 2022:
This zip code:
6.6%
Whole state:
10.6%
Residents with income below 50% of the poverty level in 2022:
This zip code:
2.2%
Whole state:
5.2%
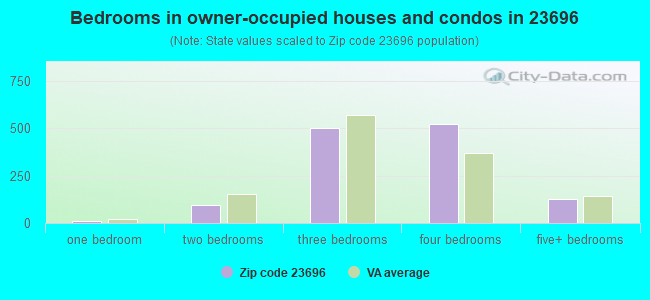
Median number of rooms in houses and condos:
Here:
7.6
State:
7.0
Median number of rooms in apartments:
Here:
6.1
State:
4.3
Notable locations in this zip code not listed on our city pages
Notable locations in zip code 23696: Slates Wharf (A), Hampton Roads Sanitation District York River Sewage Treatment Plant (B), Western Refining Yorktown Incorporated Wastewater Treatment Facility (C), York County Department of Fire and Life Safety Station 6 Seaford (D). Display/hide their locations on the map
Size of family households: 491 2-persons, 204 3-persons, 256 4-persons, 155 5-persons
Size of nonfamily households: 216 1-person, 54 2-persons
660 married couples with children.
119 single-parent households (45 men, 74 women).
97.5% of residents of 23696 zip code speak English at home.
1.2% of residents speak other Indo-European language at home (100% very well).
0.5% of residents speak Asian or Pacific Island language at home (100% very well).
0.2% of residents speak other language at home (100% very well).
Foreign born population: 114 (2.7%) (81.7% of them are naturalized citizens)
This zip code:
2.7%
Whole state:
12.7%
31%Sweden
8%Singapore
6%Denmark
6%United Kingdom, excluding England and Scotland
6%Romania
5%France
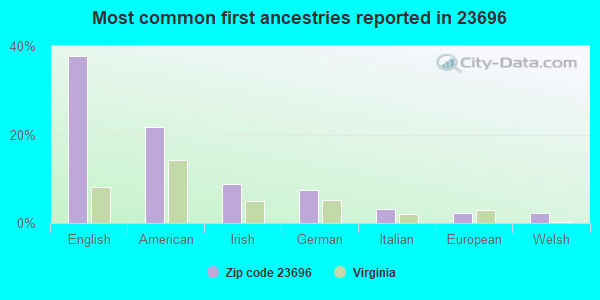
38%English
22%American
9%Irish
8%German
3%Italian
2%European
2%Welsh
Year of entry for the foreign-born population
432010 or later
02000 to 2009
321990 to 1999
195Before 1990
Facilities with environmental interests located in this zip code:
CHESAPEAKE & POTOMAC TELEPHONE CO (OLD SEAFORD RD in SEAFORD, VA)
(Resource Conservation and Recovery Act (tracking hazardous waste)) Organizations: OPERNAME (CONTACT/OPERATOR)
, CHESAPEAKE & POTOMAC TELEPHONE COMPANY (CONTACT/OWNER)
Housing units lacking complete plumbing facilities: 1.2% Housing units lacking complete kitchen facilities: 0.6%
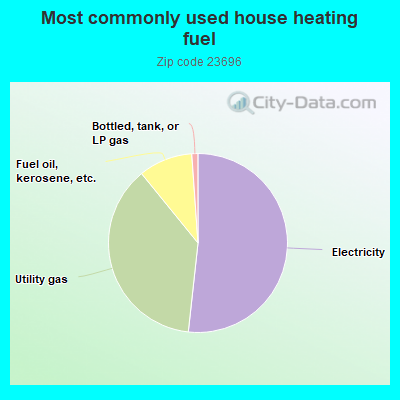
51.9%Electricity
37.5%Utility gas
9.8%Fuel oil, kerosene, etc.
1.1%Bottled, tank, or LP gas
Population in 1990: 3,009. Population change in the 1990s: +432 (+14.4%).
Place of birth for U.S.-born residents:
This state: 2,320
Northeast: 504
Midwest: 117
South: 861
West: 137
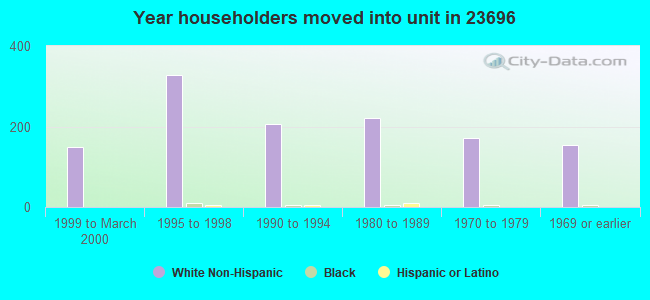
56% of the 23696 zip code residents lived in the same house 5 years ago. Out of people who lived in different houses, 25% lived in this county. Out of people who lived in different counties, 50% lived in Virginia.
95% of the 23696 zip code residents lived in the same house 1 year ago. Out of people who lived in different houses, 7% moved from this county. Out of people who lived in different houses, 79% moved from different county within same state. Out of people who lived in different houses, 25% moved from different state.
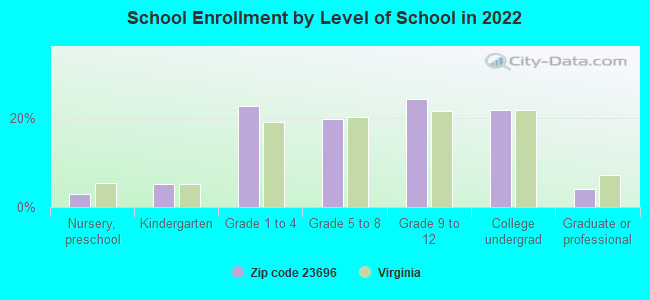
Private vs. public school enrollment:
Students in private schools in grades 1 to 8 (elementary and middle school):
Here:
0.0%
Virginia:
13.2%
Students in private schools in grades 9 to 12 (high school):
Here:
0.0%
Virginia:
10.2%
Students in private undergraduate colleges: 13
Here:
5.3%
Virginia:
18.7%
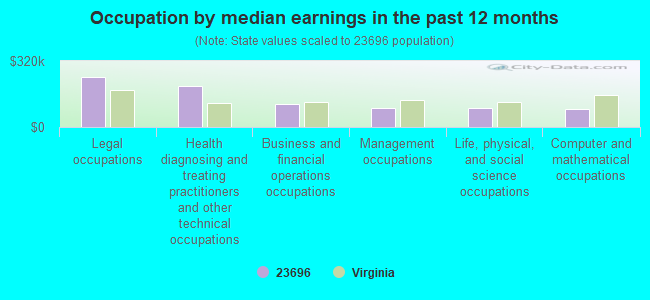
Occupation by median earnings in the past 12 months ($)
243,822Legal occupations
199,839Health diagnosing and treating practitioners and other technical occupations
113,064Business and financial operations occupations
90,924Management occupations
89,834Life, physical, and social science occupations
86,055Computer and mathematical occupations
Companies with federal contracts located in this zip code:
ADVANCE SEPTIC & SEWER, INC (505 SEAFORD RD UNIT F in SEAFORD, VA; small business) : $48,305 in 8 contractsfrom 2001 to 2005
Contracts for Waste Treatment and Storage by Army Signed by year:2000: $0; 2001: $12,290; 2002: $4,710; 2003: $12,320; 2004: $14,750; 2005: $4,235; 2006: $0.
Biggest contracts:
$14,750 with Army for Waste Treatment and Storage. Signed on 2004-12-02. Completion date: 2005-11-30.
$12,320, same as above.Signed on 2003-10-27. Completion date: 2004-09-30.
$12,290, same as above.Signed on 2001-11-06. Completion date: 2002-09-30.
$10,200, same as above.Signed on 2002-10-16. Completion date: 2002-10-16.
POKORNIK, MARTHA (111 SIR JOHN WAY in SEAFORD, VA; small business) : $36,101 in 5 contractsfrom 2005 to 2006
Contracts for Other Professional Services by Army Signed by year:2000: $0; 2001: $0; 2002: $0; 2003: $0; 2004: $0; 2005: $6,059; 2006: $30,042.
Biggest contracts:
$28,540 with Army for Other Professional Services. Signed on 2006-01-31. Completion date: 2006-02-01.
$6,008, same as above.Signed on 2005-11-17. Completion date: 2005-11-07.
$1,502, same as above.Signed on 2006-01-17. Completion date: 2006-01-18.
$51, same as above.Signed on 2005-06-17. Completion date: 2005-11-07.
Top industries in this zip code by the number of employees in 2005:
Wholesale Trade: Other Grocery and Related Products Merchant Wholesalers (50-99 employees: 1 establishment)
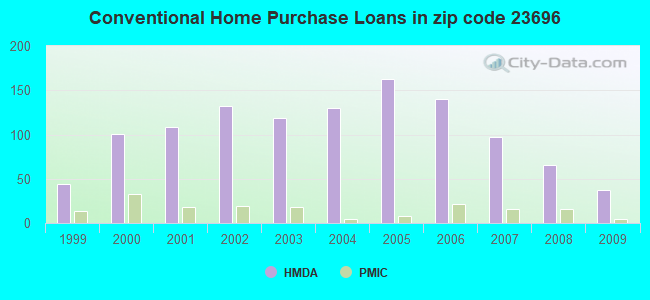
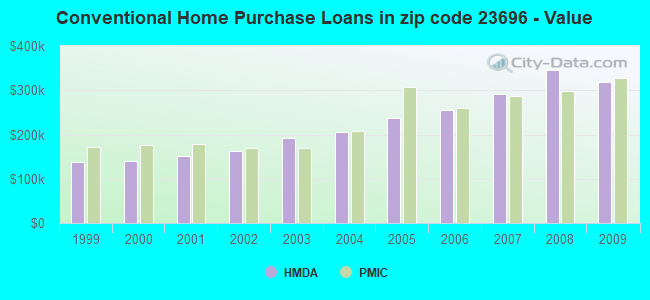
Detailed PMIC statistics for the following Tracts:0504.02
2002 - 2018 National Fire Incident Reporting System (NFIRS) incidents
Based on the data from the years 2002 - 2018 the average number of fires per year is 8. The highest number of fire incidents - 26 took place in 2002, and the least - 2 in 2018. The data has a dropping trend.
When looking into fire subcategories, the most incidents belonged to: Outside Fires (45.8%), and Structure Fires (38.0%).
Fire incident types reported to NFIRS in Zip Code 23696

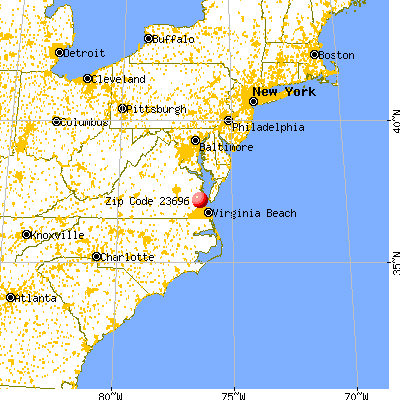


 Nearest zip codes: 23692, 23693, 23662, 23690, 23062, 23072.
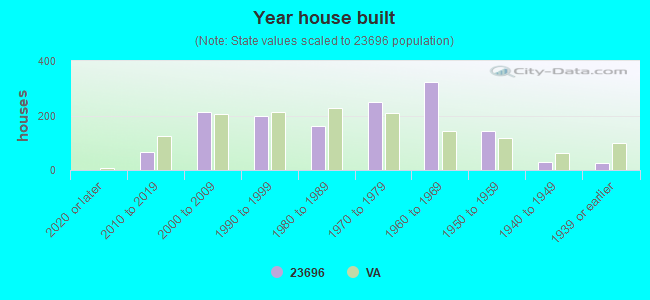


 Based on the data from the years 2002 - 2018 the average number of fires per year is 8. The highest number of fire incidents - 26 took place in 2002, and the least - 2 in 2018. The data has a dropping trend.
 When looking into fire subcategories, the most incidents belonged to: Outside Fires (45.8%), and Structure Fires (38.0%).