Estimated zip code population in 2022: 2,302 Zip code population in 2010: 2,297 Zip code population in 2000: 2,084
Houses and condos: 939 Renter-occupied apartments: 54
% of renters here:
6%
State:
33%
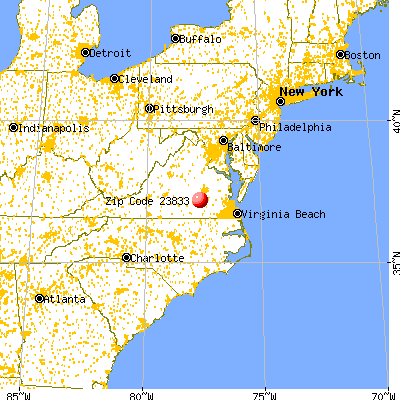
March 2022 cost of living index in zip code 23833: 85.8 (less than average, U.S. average is 100)
Land area: 57.1 sq. mi. Water area: 2.0 sq. mi.
Population density: 40 people per square mile
(very low).
OSM Map
General Map
Google Map
MSN Map
OSM Map
General Map
Google Map
MSN Map
OSM Map
General Map
Google Map
MSN Map
OSM Map
General Map
Google Map
MSN Map
Please wait while loading the map...
Real estate property taxes paid for housing units in 2022:
This zip code:
0.6% ($1,895)
Virginia:
0.7% ($2,617)
Median real estate property taxes paid for housing units with mortgages in 2022: $1,951 (0.6%) Median real estate property taxes paid for housing units with no mortgage in 2022: $1,812 (0.7%)
Business Search- 14 Million verified businesses
Males: 1,285
(55.8%)
Females: 1,017
(44.2%)
For population 25 years and over in 23833:
High school or higher: 90.1%
Bachelor's degree or higher: 11.0%
Graduate or professional degree: 2.2%
Unemployed: 1.9%
Mean travel time to work (commute): 32.1 minutes
For population 15 years and over in 23833:
Never married: 22.1%
Now married: 63.4%
Separated: 0.8%
Widowed: 7.2%
Divorced: 6.5%
Zip code 23833 compared to state average:
Unemployed percentage below state average.
Black race population percentage below state average.
Hispanic race population percentage significantly below state average.
Foreign-born population percentage significantly below state average.
Renting percentage significantly below state average.
Length of stay since moving in significantly above state average.
Number of college students below state average.
Percentage of population with a bachelor's degree or higher significantly below state average.
Estimated median house/condo value in 2022: $327,925
23833:
$327,925
Virginia:
$365,700
According to our research of Virginia and other state lists, there were 7 registered sex offenders living in 23833 zip code as of May 28, 2024. The ratio of all residents to sex offenders in zip code 23833 is 450 to 1. The ratio of registered sex offenders to all residents in this zip code is lower than the state average.
Median resident age:
This zip code:
42.1 years
Virginia median age:
39.0 years
Average household size:
This zip code:
2.6 people
Virginia:
2.5 people
Averages for the 2020 tax year for zip code 23833, filed in 2021:
Average Adjusted Gross Income (AGI) in 2020: $65,214 (Individual Income Tax Returns)
Here:
$65,214
State:
$86,446
Salary/wage: $56,600 (reported on 81.7% of returns)
Here:
$56,600
State:
$71,185
(% of AGI for various income ranges: 1021.3% for AGIs below $25k, 3590.0% for AGIs $25k-50k, 6139.2% for AGIs $50k-75k, 9927.5% for AGIs $75k-100k, 14481.5% for AGIs $100k-200k)
Taxable interest for individuals: $1,000 (reported on 26.9% of returns)
This zip code:
$1,000
Virginia:
$1,805
(% of AGI for various income ranges: 9.6% for AGIs below $25k, 25.0% for AGIs $25k-50k, 21.7% for AGIs $50k-75k, 18.8% for AGIs $75k-100k, 87.7% for AGIs $100k-200k)
Ordinary dividends: $2,788 (reported on 16.3% of returns)
Here:
$2,788
State:
$8,327
(% of AGI for various income ranges: 21.3% for AGIs below $25k, 23.9% for AGIs $25k-50k, 178.3% for AGIs $50k-75k, 129.2% for AGIs $100k-200k)
Net capital gain/loss in AGI: +$9,527 (reported on 14.4% of returns)
Here:
+$9,527
State:
+$24,644
(% of AGI for various income ranges: 28.9% for AGIs $25k-50k, 169.2% for AGIs $50k-75k, 903.1% for AGIs $100k-200k)
Profit/loss from business: +$7,750 (reported on 11.5% of returns)
Here:
+$7,750
State:
+$12,836
(% of AGI for various income ranges: 38.3% for AGIs below $25k, 63.9% for AGIs $25k-50k, 9.2% for AGIs $50k-75k, 550.8% for AGIs $100k-200k)
Taxable individual retirement arrangement distribution: $18,264 (reported on 10.6% of returns)
23833:
$18,264
Virginia:
$21,535
(% of AGI for various income ranges: 152.2% for AGIs below $25k, 430.0% for AGIs $50k-75k, 879.2% for AGIs $100k-200k)
Total itemized deductions: $23,730 (reported on 9.6% of returns)
Here:
$23,730
State:
$33,287
(% of AGI for various income ranges: 977.5% for AGIs $50k-75k, 923.1% for AGIs $100k-200k)
Charity contributions: $9,029 (reported on 6.7% of returns)
Here:
$9,029
State:
$10,381
(% of AGI for various income ranges: 189.2% for AGIs $50k-75k, 311.5% for AGIs $100k-200k)
Taxes paid: $6,844 (reported on 8.7% of returns)
23833:
$6,844
State:
$8,284
(% of AGI for various income ranges: 220.8% for AGIs $50k-75k, 270.0% for AGIs $100k-200k)
Earned income credit: $2,192 (reported on 11.5% of returns)
Here:
$2,192
State:
$2,214
(% of AGI for various income ranges: 71.7% for AGIs below $25k, 54.4% for AGIs $25k-50k)
Percentage of individuals using paid preparers for their 2020 taxes: 91.3%
Here:
91%
State:
92%
(% for various income ranges: 89.7% for AGIs below $25k, 91.7% for AGIs $25k-50k, 93.8% for AGIs $50k-75k, 91.7% for AGIs $75k-100k, 90.0% for AGIs $100k-200k, 100.0% for AGIs over 200k)
Averages for the 2012 tax year for zip code 23833, filed in 2013:
Average Adjusted Gross Income (AGI) in 2012: $55,792 (Individual Income Tax Returns)
Here:
$55,792
State:
$71,192
Salary/wage: $48,581 (reported on 84.2% of returns)
Here:
$48,581
State:
$59,229
(% of AGI for various income ranges: 73.0% for AGIs below $25k, 77.0% for AGIs $25k-50k, 73.5% for AGIs $50k-75k, 75.7% for AGIs $75k-100k, 70.6% for AGIs $100k-200k)
Taxable interest for individuals: $1,164 (reported on 34.7% of returns)
This zip code:
$1,164
Virginia:
$1,600
(% of AGI for various income ranges: 0.8% for AGIs below $25k, 0.6% for AGIs $25k-50k, 0.4% for AGIs $50k-75k, 0.9% for AGIs $75k-100k, 0.8% for AGIs $100k-200k)
Ordinary dividends: $989 (reported on 20.0% of returns)
Here:
$989
State:
$6,959
(% of AGI for various income ranges: 0.4% for AGIs $25k-50k, 0.6% for AGIs $50k-75k, 0.4% for AGIs $75k-100k, 0.2% for AGIs $100k-200k)
Net capital gain/loss in AGI: +$2,000 (reported on 11.6% of returns)
Here:
+$2,000
State:
+$16,672
(% of AGI for various income ranges: 0.8% for AGIs $75k-100k, 0.7% for AGIs $100k-200k)
Profit/loss from business: +$5,645 (reported on 11.6% of returns)
Here:
+$5,645
State:
+$14,116
(% of AGI for various income ranges: 9.2% for AGIs below $25k, 2.5% for AGIs $50k-75k, 0.2% for AGIs $100k-200k)
Taxable individual retirement arrangement distribution: $14,000 (reported on 10.5% of returns)
23833:
$14,000
Virginia:
$16,667
Total itemized deductions: $19,331 (22% of AGI, reported on 37.9% of returns)
Here:
$19,331
State:
$26,596
Here:
21.6% of AGI
State:
20.1% of AGI
(% of AGI for various income ranges: 9.6% for AGIs below $25k, 11.0% for AGIs $25k-50k, 13.1% for AGIs $50k-75k, 14.5% for AGIs $75k-100k, 13.9% for AGIs $100k-200k)
Charity contributions: $2,918 (reported on 29.5% of returns)
Here:
$2,918
State:
$4,443
(% of AGI for various income ranges: 1.3% for AGIs $25k-50k, 1.5% for AGIs $50k-75k, 2.4% for AGIs $75k-100k, 1.5% for AGIs $100k-200k)
Taxes paid: $6,656 (reported on 37.9% of returns)
23833:
$6,656
State:
$9,951
(% of AGI for various income ranges: 1.9% for AGIs below $25k, 2.4% for AGIs $25k-50k, 3.9% for AGIs $50k-75k, 5.0% for AGIs $75k-100k, 6.0% for AGIs $100k-200k)
Earned income credit: $2,215 (reported on 13.7% of returns)
Here:
$2,215
State:
$2,211
(% of AGI for various income ranges: 5.9% for AGIs below $25k, 0.9% for AGIs $25k-50k)
Percentage of individuals using paid preparers for their 2012 taxes: 42.1%
Here:
42%
State:
46%
(% for various income ranges: 34.5% for AGIs below $25k, 39.1% for AGIs $25k-50k, 43.8% for AGIs $50k-75k, 50.0% for AGIs $75k-100k, 53.3% for AGIs $100k-200k)
Averages for the 2004 tax year for zip code 23833, filed in 2005:
Average Adjusted Gross Income (AGI) in 2004: $50,234 (Individual Income Tax Returns)
Here:
$50,234
State:
$56,704
Salary/wage: $42,574 (reported on 87.3% of returns)
Here:
$42,574
State:
$48,441
(% of AGI for various income ranges: 94.2% for AGIs below $10k, 79.3% for AGIs $10k-25k, 81.2% for AGIs $25k-50k, 81.3% for AGIs $50k-75k, 91.1% for AGIs $75k-100k, 49.3% for AGIs over 100k)
Taxable interest for individuals: $1,623 (reported on 42.6% of returns)
This zip code:
$1,623
Virginia:
$1,688
(% of AGI for various income ranges: 3.5% for AGIs below $10k, 1.0% for AGIs $10k-25k, 2.2% for AGIs $25k-50k, 1.3% for AGIs $50k-75k, 0.4% for AGIs $75k-100k, 1.5% for AGIs over 100k)
Taxable dividends: $1,322 (reported on 22.7% of returns)
Here:
$1,322
State:
$4,028
(% of AGI for various income ranges: 1.4% for AGIs below $10k, 0.4% for AGIs $10k-25k, 0.4% for AGIs $25k-50k, 0.6% for AGIs $50k-75k, 0.5% for AGIs $75k-100k, 0.8% for AGIs over 100k)
Net capital gain/loss: +$6,037 (reported on 14.8% of returns)
Here:
+$6,037
State:
+$14,375
(% of AGI for various income ranges: -0.8% for AGIs $10k-25k, -0.0% for AGIs $25k-50k, 0.5% for AGIs $50k-75k, 0.3% for AGIs $75k-100k, 5.8% for AGIs over 100k)
Profit/loss from business: +$5,312 (reported on 10.2% of returns)
Here:
+$5,312
State:
+$13,342
(% of AGI for various income ranges: 3.5% for AGIs $10k-25k, 1.9% for AGIs $25k-50k, 2.3% for AGIs $50k-75k, -0.3% for AGIs over 100k)
IRA payment deduction: $2,704 (reported on 3.0% of returns)
23833:
$2,704
Virginia:
$2,943
Total itemized deductions: $14,774 (20% of AGI, reported on 39.1% of returns)
Here:
$14,774
State:
$21,492
Here:
19.8% of AGI
State:
21.0% of AGI
(% of AGI for various income ranges: 9.2% for AGIs $10k-25k, 10.9% for AGIs $25k-50k, 13.7% for AGIs $50k-75k, 15.7% for AGIs $75k-100k, 8.5% for AGIs over 100k)
Charity contributions deductions: $2,322 (3% of AGI, reported on 31.6% of returns)
Here:
$2,322
State:
$3,794
Here:
3.0% of AGI
State:
3.5% of AGI
(% of AGI for various income ranges: 1.3% for AGIs $10k-25k, 1.3% for AGIs $25k-50k, 1.6% for AGIs $50k-75k, 1.8% for AGIs $75k-100k, 1.4% for AGIs over 100k)
Total tax: $6,496 (reported on 82.4% of returns)
23833:
$6,496
State:
$9,537
(% of AGI for various income ranges: 2.7% for AGIs below $10k, 4.4% for AGIs $10k-25k, 6.8% for AGIs $25k-50k, 8.6% for AGIs $50k-75k, 9.8% for AGIs $75k-100k, 17.6% for AGIs over 100k)
Earned income credit: $1,552 (reported on 10.5% of returns)
Here:
$1,552
State:
$1,734
Percentage of individuals using paid preparers for their 2004 taxes: 52.2%
Here:
52%
State:
52%
(% for various income ranges: 33.9% for AGIs below $10k, 48.1% for AGIs $10k-25k, 57.2% for AGIs $25k-50k, 52.5% for AGIs $50k-75k, 48.6% for AGIs $75k-100k, 78.9% for AGIs over 100k)
Household received Food Stamps/SNAP in the past 12 months: 54 Household did not receive Food Stamps/SNAP in the past 12 months: 829
Women who had a birth in the past 12 months: 48 (36 now married, 11 unmarried) Women who did not have a birth in the past 12 months: 440 (248 now married, 189 unmarried)
Housing units in zip code 23833 with a mortgage: 551 (52 second mortgage, 33 both second mortgage and home equity loan) Houses without a mortgage: 6
Median monthly owner costs for units with a mortgage: $1,515 Median monthly owner costs for units without a mortgage: $391
Residents with income below the poverty level in 2022:
This zip code:
5.9%
Whole state:
10.6%
Residents with income below 50% of the poverty level in 2022:
This zip code:
3.1%
Whole state:
5.2%
Median number of rooms in houses and condos:
Here:
6.2
State:
7.0
Median number of rooms in apartments:
Here:
4.0
State:
4.3
Notable locations in this zip code not listed on our city pages
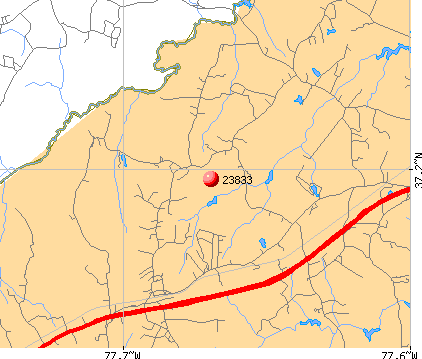
Notable locations in zip code 23833: Poole Siding (A), Whites Store (B), Church Road (C), Ford Volunteer Fire Department Station 2 (D). Display/hide their locations on the map
Churches in zip code 23833 include: Saint Peters Church (A), Springfield Church (B), Corinth Church (C), Trinity Church (D), Marmora Church (E), Central Baptist Church (F), Poole Christian Church (G). Display/hide their locations on the map
Cemeteries: Mispah Cemetery (1), Trinity Cemetery (2), Corinth Cemetery (3), Norris Cemetery (4), Smith Cemetery (5). Display/hide their locations on the map
Streams, rivers, and creeks: Winticomack Creek (A), Whipponock Creek (B), Namozine Creek (C), Kit Branch (D), Georges Branch (E), Fellowbed Branch (F). Display/hide their locations on the map
In group quarters: 5 (-1 institutionalized population)
Size of family households: 244 2-persons, 210 3-persons, 95 4-persons, 57 5-persons, 17 6-persons, 11 7-or-more-persons
Size of nonfamily households: 208 1-person, 42 2-persons
402 married couples with children.
10 single-parent households (10 men).
99.5% of residents of 23833 zip code speak English at home.
0.1% of residents speak other Indo-European language at home (100% very well).
Foreign born population: 7 (0.3%) (100.0% of them are naturalized citizens)
This zip code:
0.3%
Whole state:
12.7%
57%France
21%English
18%American
9%Irish
4%German
3%European
2%Hungarian
2%Russian
Year of entry for the foreign-born population
02010 or later
02000 to 2009
11990 to 1999
12Before 1990
Facilities with environmental interests located in this zip code:
DOC DINWIDDIE FIELD UNIT 27 WWTP (13510 COX RD in CHURCH ROAD, VA)
AIR MINOR (AIRS/AFS) STATE MASTER (Virginia pollutants databases) - CEDS-50736, AIR PROGRAM (National Center for Education Statistics) - STATE ID-9000029 National Pollutant Discharge Elimination System NON-MAJOR (Tracking pollutant discharge elimination systems) - permit Conditionally Exempt Small Quantity Generators, less than 100 kg/month of hazardous waste (Resource Conservation and Recovery Act (tracking hazardous waste)) - notification COMMUNITY WATER SYSTEM (SDWIS) Business SIC classification: SEWERAGE SYSTEMS; CORRECTIONAL INSTITUTIONS Business NAICS classification: CORRECTIONAL INSTITUTIONS. Organizations: VA DEPT OF CORRECTIONS (CONTACT/OWNER)
, DEPARTMENT OF CORRECTIONAL EDUCATION (SCHOOL DISTRICT)
Alternative names: DINWIDDIE COR UNIT #27, DINWIDDIE CORRECTIONAL UNIT 27, FIELD UNIT NO. 27, VA DEPT OF WEL AND INST,
Housing units lacking complete plumbing facilities: 2.6% Housing units lacking complete kitchen facilities: 2.7%
83.0%Electricity
6.5%Wood
5.9%Bottled, tank, or LP gas
4.9%Fuel oil, kerosene, etc.
Population in 1990: 1,515. Population change in the 1990s: +569 (+37.6%).
Place of birth for U.S.-born residents:
This state: 1,748
Northeast: 175
Midwest: 57
South: 228
West: 65
58% of the 23833 zip code residents lived in the same house 5 years ago. Out of people who lived in different houses, 36% lived in this county. Out of people who lived in different counties, 50% lived in Virginia.
96% of the 23833 zip code residents lived in the same house 1 year ago. Out of people who lived in different houses, 13% moved from this county. Out of people who lived in different houses, 99% moved from different county within same state.
Private vs. public school enrollment:
Students in private schools in grades 1 to 8 (elementary and middle school):
Here:
0.0%
Virginia:
13.2%
Students in private schools in grades 9 to 12 (high school):
Here:
0.0%
Virginia:
10.2%
Students in private undergraduate colleges: 35
Here:
49.4%
Virginia:
18.7%
Occupation by median earnings in the past 12 months ($)
130,477Management occupations
90,655Health diagnosing and treating practitioners and other technical occupations
65,680Installation, maintenance, and repair occupations
59,701Production occupations
58,834Sales and related occupations
49,200Transportation occupations
Top industries in this zip code by the number of employees in 2005:
Other Services (except Public Administration): Other Similar Organizations (except Business, Professional, Labor, and Political Organizations) (1-4: 1)
People in group quarters in 2010:
6 people in group homes intended for adults
People in group quarters in 2000:
113 people in state prisons
Fatal accident statistics in 2014:
Fatal accident count: 1
Vehicles involved in fatal accidents: 2
Fatal accidents caused by drunken drivers: 1
Fatalities: 1
Persons involved in fatal accidents: 3
Pedestrians involved in fatal accidents: 0
Fatal accident statistics in 2012:
Fatal accident count: 1
Vehicles involved in fatal accidents: 1
Fatal accidents caused by drunken drivers: 0
Fatalities: 1
Persons involved in fatal accidents: 1
Pedestrians involved in fatal accidents: 0
2004 - 2017 National Fire Incident Reporting System (NFIRS) incidents
According to the data from the years 2004 - 2017 the average number of fire incidents per year is 12. The highest number of reported fire incidents - 28 took place in 2008, and the least - 1 in 2004. The data has a constant trend.
When looking into fire subcategories, the most incidents belonged to: Outside Fires (48.1%), and Structure Fires (34.6%).
Fire incident types reported to NFIRS in Zip Code 23833


 Nearest zip codes: 23850, 23885, 23838, 23840, 23894, 23803.


 According to the data from the years 2004 - 2017 the average number of fire incidents per year is 12. The highest number of reported fire incidents - 28 took place in 2008, and the least - 1 in 2004. The data has a constant trend.
 When looking into fire subcategories, the most incidents belonged to: Outside Fires (48.1%), and Structure Fires (34.6%).