Estimated zip code population in 2022: 2,774 Zip code population in 2010: 3,489 Zip code population in 2000: 3,603
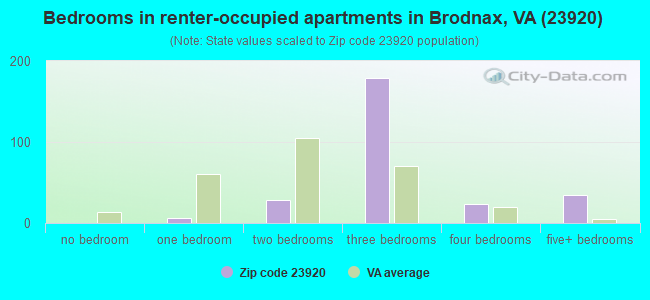
Houses and condos: 1,635 Renter-occupied apartments: 275
% of renters here:
21%
State:
33%
March 2022 cost of living index in zip code 23920: 84.5 (less than average, U.S. average is 100)
Land area: 121.7 sq. mi. Water area: 0.0 sq. mi.
Population density: 23 people per square mile
(very low).
OSM Map
General Map
Google Map
MSN Map
OSM Map
General Map
Google Map
MSN Map
OSM Map
General Map
Google Map
MSN Map
OSM Map
General Map
Google Map
MSN Map
Please wait while loading the map...
Real estate property taxes paid for housing units in 2022:
This zip code:
0.4% ($682)
Virginia:
0.7% ($2,617)
Median real estate property taxes paid for housing units with mortgages in 2022: $686 (0.7%) Median real estate property taxes paid for housing units with no mortgage in 2022: $694 (0.5%)
Averages for the 2020 tax year for zip code 23920, filed in 2021:
Average Adjusted Gross Income (AGI) in 2020: $42,915 (Individual Income Tax Returns)
Here:
$42,915
State:
$86,446
Salary/wage: $38,217 (reported on 86.0% of returns)
Here:
$38,217
State:
$71,185
(% of AGI for various income ranges: 1323.6% for AGIs below $25k, 3859.1% for AGIs $25k-50k, 6718.3% for AGIs $50k-75k, 12058.3% for AGIs $75k-100k, 19970.0% for AGIs $100k-200k)
Taxable interest for individuals: $876 (reported on 17.5% of returns)
This zip code:
$876
Virginia:
$1,805
(% of AGI for various income ranges: 1.9% for AGIs below $25k, 16.3% for AGIs $25k-50k, 23.3% for AGIs $50k-75k, 25.0% for AGIs $75k-100k, 183.3% for AGIs $100k-200k)
Ordinary dividends: $3,342 (reported on 8.4% of returns)
Here:
$3,342
State:
$8,327
(% of AGI for various income ranges: 27.7% for AGIs $25k-50k, 40.8% for AGIs $50k-75k, 40.0% for AGIs $75k-100k, 385.0% for AGIs $100k-200k)
Net capital gain/loss in AGI: +$6,527 (reported on 7.7% of returns)
Here:
+$6,527
State:
+$24,644
(% of AGI for various income ranges: 18.0% for AGIs $25k-50k, 198.3% for AGIs $50k-75k, 695.0% for AGIs $100k-200k)
Profit/loss from business: +$1,911 (reported on 13.3% of returns)
Here:
+$1,911
State:
+$12,836
(% of AGI for various income ranges: 33.3% for AGIs $50k-75k, 603.3% for AGIs $75k-100k)
Taxable individual retirement arrangement distribution: $10,638 (reported on 5.6% of returns)
23920:
$10,638
Virginia:
$21,535
(% of AGI for various income ranges: 69.4% for AGIs below $25k, 437.5% for AGIs $50k-75k)
Total itemized deductions: $33,729 (reported on 4.9% of returns)
Here:
$33,729
State:
$33,287
(% of AGI for various income ranges: 207.7% for AGIs $25k-50k, 714.2% for AGIs $50k-75k, 1295.0% for AGIs $100k-200k)
Charity contributions: $8,750 (reported on 4.2% of returns)
Here:
$8,750
State:
$10,381
(% of AGI for various income ranges: 61.7% for AGIs $25k-50k, 515.0% for AGIs $75k-100k)
Taxes paid: $4,943 (reported on 4.9% of returns)
23920:
$4,943
State:
$8,284
(% of AGI for various income ranges: 17.1% for AGIs $25k-50k, 98.3% for AGIs $50k-75k, 280.0% for AGIs $100k-200k)
Earned income credit: $2,392 (reported on 25.9% of returns)
Here:
$2,392
State:
$2,214
(% of AGI for various income ranges: 118.5% for AGIs below $25k, 93.7% for AGIs $25k-50k)
Percentage of individuals using paid preparers for their 2020 taxes: 92.3%
Here:
92%
State:
92%
(% for various income ranges: 91.5% for AGIs below $25k, 93.2% for AGIs $25k-50k, 94.1% for AGIs $50k-75k, 90.9% for AGIs $75k-100k, 91.7% for AGIs $100k-200k)
Averages for the 2012 tax year for zip code 23920, filed in 2013:
Average Adjusted Gross Income (AGI) in 2012: $36,166 (Individual Income Tax Returns)
Here:
$36,166
State:
$71,192
Salary/wage: $31,674 (reported on 89.0% of returns)
Here:
$31,674
State:
$59,229
(% of AGI for various income ranges: 84.9% for AGIs below $25k, 87.2% for AGIs $25k-50k, 77.2% for AGIs $50k-75k, 81.0% for AGIs $75k-100k, 54.7% for AGIs $100k-200k)
Taxable interest for individuals: $814 (reported on 21.3% of returns)
This zip code:
$814
Virginia:
$1,600
(% of AGI for various income ranges: 0.8% for AGIs below $25k, 0.3% for AGIs $25k-50k, 0.7% for AGIs $50k-75k, 0.2% for AGIs $75k-100k, 0.6% for AGIs $100k-200k)
Ordinary dividends: $1,290 (reported on 7.4% of returns)
Here:
$1,290
State:
$6,959
(% of AGI for various income ranges: 0.2% for AGIs below $25k, 0.4% for AGIs $25k-50k, 0.7% for AGIs $75k-100k)
Net capital gain/loss in AGI: +$5,443 (reported on 5.1% of returns)
Here:
+$5,443
State:
+$16,672
Profit/loss from business: +$3,153 (reported on 11.0% of returns)
Here:
+$3,153
State:
+$14,116
(% of AGI for various income ranges: 1.1% for AGIs below $25k, 2.2% for AGIs $25k-50k, 0.5% for AGIs $50k-75k)
Taxable individual retirement arrangement distribution: $8,729 (reported on 5.1% of returns)
23920:
$8,729
Virginia:
$16,667
Total itemized deductions: $18,314 (27% of AGI, reported on 20.6% of returns)
Here:
$18,314
State:
$26,596
Here:
27.1% of AGI
State:
20.1% of AGI
(% of AGI for various income ranges: 6.4% for AGIs below $25k, 11.3% for AGIs $25k-50k, 9.9% for AGIs $50k-75k, 12.4% for AGIs $75k-100k, 11.5% for AGIs $100k-200k)
Charity contributions: $3,200 (reported on 18.4% of returns)
Here:
$3,200
State:
$4,443
(% of AGI for various income ranges: 0.7% for AGIs below $25k, 1.7% for AGIs $25k-50k, 1.6% for AGIs $50k-75k, 2.4% for AGIs $75k-100k, 1.9% for AGIs $100k-200k)
Taxes paid: $3,843 (reported on 20.6% of returns)
23920:
$3,843
State:
$9,951
(% of AGI for various income ranges: 0.7% for AGIs below $25k, 1.7% for AGIs $25k-50k, 1.7% for AGIs $50k-75k, 3.4% for AGIs $75k-100k, 3.8% for AGIs $100k-200k)
Earned income credit: $2,372 (reported on 31.6% of returns)
Here:
$2,372
State:
$2,211
(% of AGI for various income ranges: 9.1% for AGIs below $25k, 1.6% for AGIs $25k-50k)
Percentage of individuals using paid preparers for their 2012 taxes: 48.5%
Here:
49%
State:
46%
(% for various income ranges: 44.6% for AGIs below $25k, 46.5% for AGIs $25k-50k, 57.1% for AGIs $50k-75k, 62.5% for AGIs $75k-100k, 66.7% for AGIs $100k-200k)
Averages for the 2004 tax year for zip code 23920, filed in 2005:
Average Adjusted Gross Income (AGI) in 2004: $28,719 (Individual Income Tax Returns)
Here:
$28,719
State:
$56,704
Salary/wage: $26,857 (reported on 89.8% of returns)
Here:
$26,857
State:
$48,441
(% of AGI for various income ranges: 125.3% for AGIs below $10k, 85.5% for AGIs $10k-25k, 86.7% for AGIs $25k-50k, 87.4% for AGIs $50k-75k, 79.3% for AGIs $75k-100k, 57.3% for AGIs over 100k)
Taxable interest for individuals: $995 (reported on 26.1% of returns)
This zip code:
$995
Virginia:
$1,688
(% of AGI for various income ranges: 3.0% for AGIs below $10k, 1.0% for AGIs $10k-25k, 0.5% for AGIs $25k-50k, 0.7% for AGIs $50k-75k, 0.6% for AGIs $75k-100k, 2.2% for AGIs over 100k)
Taxable dividends: $2,469 (reported on 10.5% of returns)
Here:
$2,469
State:
$4,028
(% of AGI for various income ranges: 2.4% for AGIs below $10k, 0.6% for AGIs $10k-25k, 0.1% for AGIs $25k-50k, 1.7% for AGIs $50k-75k, 0.4% for AGIs $75k-100k, 2.7% for AGIs over 100k)
Net capital gain/loss: +$7,020 (reported on 7.0% of returns)
Here:
+$7,020
State:
+$14,375
(% of AGI for various income ranges: -0.3% for AGIs below $10k, 0.3% for AGIs $10k-25k, 0.4% for AGIs $25k-50k, 1.9% for AGIs $50k-75k, 2.6% for AGIs $75k-100k, 8.2% for AGIs over 100k)
Profit/loss from business: +$5,362 (reported on 10.8% of returns)
Here:
+$5,362
State:
+$13,342
(% of AGI for various income ranges: 4.4% for AGIs below $10k, 3.3% for AGIs $10k-25k, 2.4% for AGIs $25k-50k, 0.5% for AGIs $50k-75k, 2.4% for AGIs $75k-100k)
IRA payment deduction: $3,667 (reported on 2.4% of returns)
23920:
$3,667
Virginia:
$2,943
Total itemized deductions: $15,331 (28% of AGI, reported on 18.1% of returns)
Here:
$15,331
State:
$21,492
Here:
28.2% of AGI
State:
21.0% of AGI
(% of AGI for various income ranges: 6.1% for AGIs $10k-25k, 10.2% for AGIs $25k-50k, 12.0% for AGIs $50k-75k, 11.9% for AGIs $75k-100k, 11.5% for AGIs over 100k)
Charity contributions deductions: $2,751 (5% of AGI, reported on 16.1% of returns)
Here:
$2,751
State:
$3,794
Here:
5.0% of AGI
State:
3.5% of AGI
(% of AGI for various income ranges: 0.9% for AGIs $10k-25k, 1.8% for AGIs $25k-50k, 1.9% for AGIs $50k-75k, 1.7% for AGIs $75k-100k, 1.9% for AGIs over 100k)
Total tax: $3,111 (reported on 64.5% of returns)
23920:
$3,111
State:
$9,537
(% of AGI for various income ranges: 1.7% for AGIs below $10k, 3.2% for AGIs $10k-25k, 5.8% for AGIs $25k-50k, 7.5% for AGIs $50k-75k, 10.7% for AGIs $75k-100k, 15.8% for AGIs over 100k)
Earned income credit: $1,856 (reported on 29.8% of returns)
Here:
$1,856
State:
$1,734
Percentage of individuals using paid preparers for their 2004 taxes: 60.4%
Here:
60%
State:
52%
(% for various income ranges: 54.5% for AGIs below $10k, 61.3% for AGIs $10k-25k, 59.4% for AGIs $25k-50k, 65.9% for AGIs $50k-75k, 69.4% for AGIs $75k-100k, 75.0% for AGIs over 100k)
Household received Food Stamps/SNAP in the past 12 months: 244 Household did not receive Food Stamps/SNAP in the past 12 months: 1,074
Women who had a birth in the past 12 months: 11 (0 now married, 10 unmarried) Women who did not have a birth in the past 12 months: 519 (199 now married, 321 unmarried)
Housing units in zip code 23920 with a mortgage: 509 (5 second mortgage, 4 both second mortgage and home equity loan) Median monthly owner costs for units with a mortgage: $1,131 Median monthly owner costs for units without a mortgage: $393
Residents with income below the poverty level in 2022:
This zip code:
7.0%
Whole state:
10.6%
Residents with income below 50% of the poverty level in 2022:
This zip code:
2.6%
Whole state:
5.2%
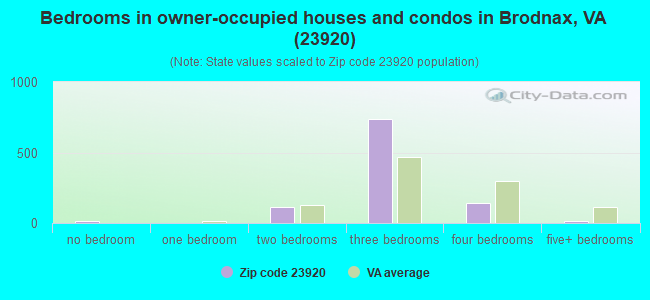
Median number of rooms in houses and condos:
Here:
6.0
State:
7.0
Median number of rooms in apartments:
Here:
5.3
State:
4.3
Notable locations in this zip code not listed on our city pages
Churches in zip code 23920 include: Providence Church (A), Bethany Church (B), Salem Church (C), Canaan Church (D), Zion Union Church (E), Trinity Church (F), Union Church (G), Union Meherrin Church (H), Green Chapel (I). Display/hide their locations on the map
Cemeteries: Taylor Cemetery (1), Walden Cemetery (2), Carroll Cemetery (3), Wray Cemetery (4), Davis Cemetery (5), Dugger Cemetery (6), Flournoy Cemetery (7). Display/hide their locations on the map
Streams, rivers, and creeks: Stony Creek (A), Smith Creek (B), Shining Creek (C), Saddletree Creek (D), Hicks Creek (E), Genito Creek (F), Flat Branch (G), Evans Creek (H), Briery Branch (I). Display/hide their locations on the map
Size of family households: 489 2-persons, 385 3-persons, 76 4-persons, 34 5-persons, 3 6-persons
Size of nonfamily households: 291 1-person, 15 2-persons
161 married couples with children.
154 single-parent households (44 men, 110 women).
96.7% of residents of 23920 zip code speak English at home.
2.0% of residents speak Spanish at home (75% very well, 25% well).
0.8% of residents speak other Indo-European language at home (100% very well).
0.6% of residents speak other language at home (100% very well).
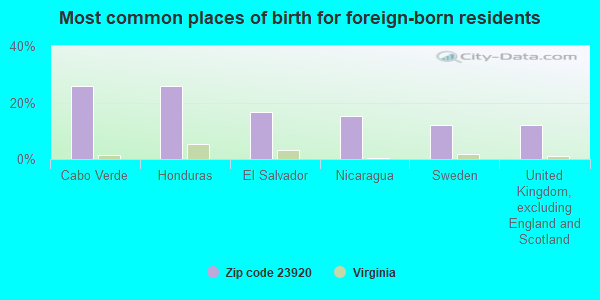
Foreign born population: 63 (2.3%) (10.0% of them are naturalized citizens)
This zip code:
2.3%
Whole state:
12.7%
26%Cabo Verde
26%Honduras
17%El Salvador
15%Nicaragua
12%Sweden
12%United Kingdom, excluding England and Scotland
27%African
17%English
15%American
7%German
1%Italian
1%Irish
1%Ghanaian
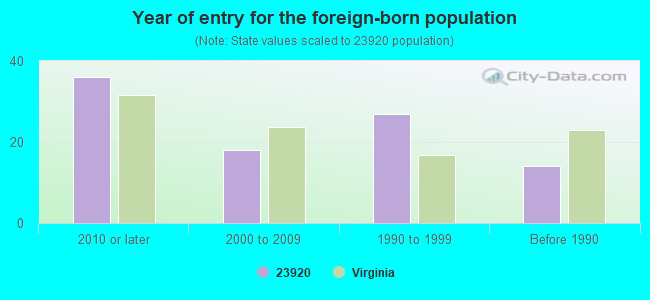
Year of entry for the foreign-born population
362010 or later
182000 to 2009
271990 to 1999
14Before 1990
Facilities with environmental interests located in this zip code:
BRODNAX LUMBER COMPANY (2661 GOVERNOR HARRISON PKWY in BRODNAX, VA)
AIR MINOR (AIRS/AFS) STATE MASTER (Virginia pollutants databases) - CEDS-30462, AIR PROGRAM Business SIC classification: SAWMILLS AND PLANING MILLS, GENERAL Business NAICS classification: SAWMILLS.
BRODNAX MILLS INC (KERR DRIVE in BRODNAX, VA)
AIR MINOR (AIRS/AFS) STATE MASTER (Virginia pollutants databases) - CEDS-30760, AIR PROGRAM Business SIC and NAICS classification: YARN SPINNING MILLS
Housing units lacking complete plumbing facilities: 1.2% Housing units lacking complete kitchen facilities: 1.4%
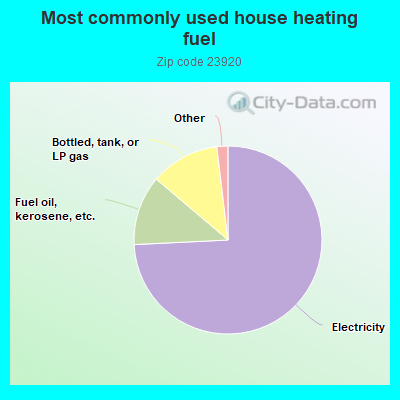
74.3%Electricity
12.0%Fuel oil, kerosene, etc.
11.9%Bottled, tank, or LP gas
0.9%Wood
0.8%Utility gas
Population in 1990: 2,571. Population change in the 1990s: +1,032 (+40.1%).
Place of birth for U.S.-born residents:
This state: 2,240
Northeast: 249
Midwest: 26
South: 130
West: 11
68% of the 23920 zip code residents lived in the same house 5 years ago. Out of people who lived in different houses, 50% lived in this county. Out of people who lived in different counties, 50% lived in Virginia.
98% of the 23920 zip code residents lived in the same house 1 year ago. Out of people who lived in different houses, 69% moved from different county within same state. Out of people who lived in different houses, 49% moved from different state. Out of people who lived in different houses, 10% moved from abroad.
Private vs. public school enrollment:
Students in private schools in grades 1 to 8 (elementary and middle school): 36
Here:
29.6%
Virginia:
13.2%
Students in private schools in grades 9 to 12 (high school):
Here:
0.0%
Virginia:
10.2%
Students in private undergraduate colleges: 18
Here:
25.0%
Virginia:
18.7%
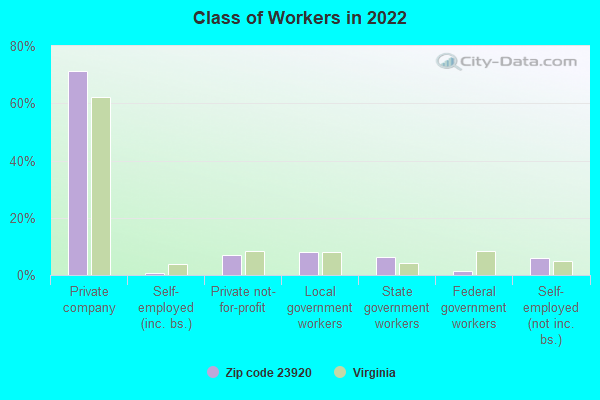
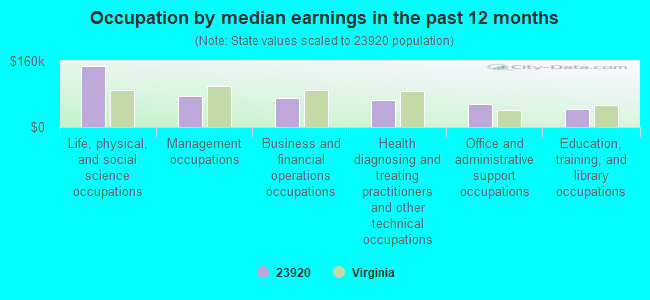
Occupation by median earnings in the past 12 months ($)
147,669Life, physical, and social science occupations
75,515Management occupations
69,704Business and financial operations occupations
66,526Health diagnosing and treating practitioners and other technical occupations
55,465Office and administrative support occupations
44,711Education, training, and library occupations
Top industries in this zip code by the number of employees in 2005:
Health Care and Social Assistance: Child Day Care Services (5-9: 1)
Other Services (except Public Administration): Religious Organizations (1-4: 2)
People in group quarters in 2000:
16 people in other noninstitutional group quarters
3 people in homes for abused, dependent, and neglected children
Fatal accident statistics in 2014:
Fatal accident count: 1
Vehicles involved in fatal accidents: 1
Fatal accidents caused by drunken drivers: 1
Fatalities: 1
Persons involved in fatal accidents: 1
Pedestrians involved in fatal accidents: 0
Fatal accident statistics in 2013:
Fatal accident count: 1
Vehicles involved in fatal accidents: 1
Fatal accidents caused by drunken drivers: 0
Fatalities: 1
Persons involved in fatal accidents: 2
Pedestrians involved in fatal accidents: 0
2002 - 2018 National Fire Incident Reporting System (NFIRS) incidents
Based on the data from the years 2002 - 2018 the average number of fire incidents per year is 26. The highest number of fires - 46 took place in 2011, and the least - 14 in 2003. The data has a dropping trend.
When looking into fire subcategories, the most reports belonged to: Structure Fires (45.2%), and Outside Fires (36.9%).
Fire incident types reported to NFIRS in Zip Code 23920

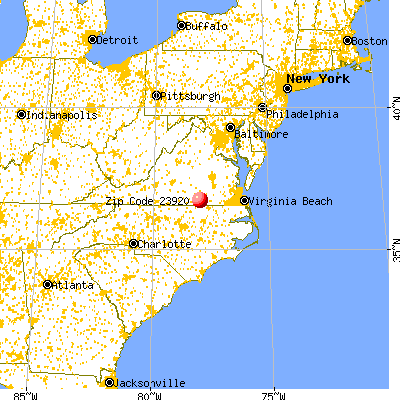


 Nearest zip codes: 23893, 23950, 23845, 23868, 23857, 23821.
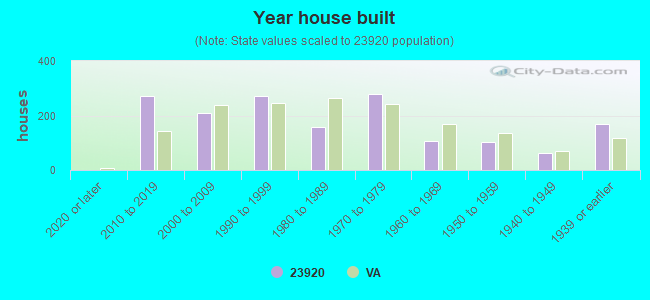


 Based on the data from the years 2002 - 2018 the average number of fire incidents per year is 26. The highest number of fires - 46 took place in 2011, and the least - 14 in 2003. The data has a dropping trend.
 When looking into fire subcategories, the most reports belonged to: Structure Fires (45.2%), and Outside Fires (36.9%).