Estimated zip code population in 2022: 3,657 Zip code population in 2010: 3,348 Zip code population in 2000: 3,211
Houses and condos: 1,869 Renter-occupied apartments: 537
% of renters here:
35%
State:
33%
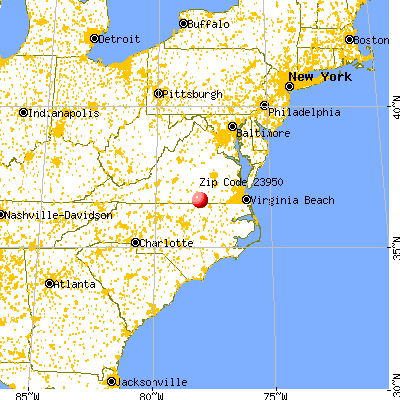
March 2022 cost of living index in zip code 23950: 85.6 (less than average, U.S. average is 100)
Land area: 61.1 sq. mi. Water area: 0.1 sq. mi.
Population density: 60 people per square mile
(very low).
OSM Map
General Map
Google Map
MSN Map
OSM Map
General Map
Google Map
MSN Map
OSM Map
General Map
Google Map
MSN Map
OSM Map
General Map
Google Map
MSN Map
Please wait while loading the map...
Real estate property taxes paid for housing units in 2022:
This zip code:
0.4% ($812)
Virginia:
0.7% ($2,617)
Median real estate property taxes paid for housing units with mortgages in 2022: $1,068 (0.4%) Median real estate property taxes paid for housing units with no mortgage in 2022: $650 (0.4%)
Business Search- 14 Million verified businesses
Males: 1,822
(49.8%)
Females: 1,834
(50.2%)
For population 25 years and over in 23950:
High school or higher: 78.4%
Bachelor's degree or higher: 12.0%
Graduate or professional degree: 3.1%
Unemployed: 4.1%
Mean travel time to work (commute): 21.8 minutes
For population 15 years and over in 23950:
Never married: 32.6%
Now married: 41.1%
Separated: 4.6%
Widowed: 9.4%
Divorced: 12.2%
Zip code 23950 compared to state average:
Median household income below state average.
Median house value below state average.
Black race population percentage above state average.
Median age above state average.
Foreign-born population percentage significantly below state average.
Length of stay since moving in significantly above state average.
Number of college students significantly below state average.
Percentage of population with a bachelor's degree or higher significantly below state average.
Estimated median house/condo value in 2022: $186,617
23950:
$186,617
Virginia:
$365,700
According to our research of Virginia and other state lists, there were 13 registered sex offenders living in 23950 zip code as of May 28, 2024. The ratio of all residents to sex offenders in zip code 23950 is 299 to 1. The ratio of registered sex offenders to all residents in this zip code is near the state average.
Median resident age:
This zip code:
46.4 years
Virginia median age:
39.0 years
Average household size:
This zip code:
2.3 people
Virginia:
2.5 people
Averages for the 2020 tax year for zip code 23950, filed in 2021:
Average Adjusted Gross Income (AGI) in 2020: $40,449 (Individual Income Tax Returns)
Here:
$40,449
State:
$86,446
Salary/wage: $34,949 (reported on 84.7% of returns)
Here:
$34,949
State:
$71,185
(% of AGI for various income ranges: 1366.8% for AGIs below $25k, 3665.4% for AGIs $25k-50k, 6427.1% for AGIs $50k-75k, 9878.3% for AGIs $75k-100k, 15106.7% for AGIs $100k-200k)
Taxable interest for individuals: $806 (reported on 22.0% of returns)
This zip code:
$806
Virginia:
$1,805
(% of AGI for various income ranges: 5.2% for AGIs below $25k, 7.3% for AGIs $25k-50k, 41.4% for AGIs $50k-75k, 41.7% for AGIs $75k-100k, 216.7% for AGIs $100k-200k)
Ordinary dividends: $2,669 (reported on 10.7% of returns)
Here:
$2,669
State:
$8,327
(% of AGI for various income ranges: 7.6% for AGIs below $25k, 35.1% for AGIs $25k-50k, 66.4% for AGIs $50k-75k, 28.3% for AGIs $75k-100k, 248.3% for AGIs $100k-200k)
Net capital gain/loss in AGI: +$3,858 (reported on 8.0% of returns)
Here:
+$3,858
State:
+$24,644
(% of AGI for various income ranges: 18.6% for AGIs $25k-50k, 133.6% for AGIs $50k-75k, 345.0% for AGIs $100k-200k)
Profit/loss from business: +$3,400 (reported on 10.7% of returns)
Here:
+$3,400
State:
+$12,836
(% of AGI for various income ranges: 27.6% for AGIs below $25k, 72.4% for AGIs $25k-50k, 230.0% for AGIs $75k-100k)
Taxable individual retirement arrangement distribution: $9,470 (reported on 6.7% of returns)
23950:
$9,470
Virginia:
$21,535
(% of AGI for various income ranges: 30.0% for AGIs below $25k, 87.8% for AGIs $25k-50k, 786.7% for AGIs $75k-100k)
Total itemized deductions: $22,500 (reported on 2.7% of returns)
Here:
$22,500
State:
$33,287
(% of AGI for various income ranges: 642.9% for AGIs $50k-75k)
Charity contributions: $5,433 (reported on 2.0% of returns)
Here:
$5,433
State:
$10,381
(% of AGI for various income ranges: 116.4% for AGIs $50k-75k)
Taxes paid: $5,225 (reported on 2.7% of returns)
23950:
$5,225
State:
$8,284
(% of AGI for various income ranges: 149.3% for AGIs $50k-75k)
Earned income credit: $2,550 (reported on 26.7% of returns)
Here:
$2,550
State:
$2,214
(% of AGI for various income ranges: 141.2% for AGIs below $25k, 84.9% for AGIs $25k-50k)
Percentage of individuals using paid preparers for their 2020 taxes: 92.0%
Here:
92%
State:
92%
(% for various income ranges: 92.2% for AGIs below $25k, 91.3% for AGIs $25k-50k, 90.0% for AGIs $50k-75k, 90.0% for AGIs $75k-100k, 100.0% for AGIs $100k-200k)
Averages for the 2012 tax year for zip code 23950, filed in 2013:
Average Adjusted Gross Income (AGI) in 2012: $32,766 (Individual Income Tax Returns)
Here:
$32,766
State:
$71,192
Salary/wage: $29,112 (reported on 85.6% of returns)
Here:
$29,112
State:
$59,229
(% of AGI for various income ranges: 82.1% for AGIs below $25k, 80.5% for AGIs $25k-50k, 76.5% for AGIs $50k-75k, 67.6% for AGIs $75k-100k, 63.3% for AGIs $100k-200k)
Taxable interest for individuals: $1,166 (reported on 24.0% of returns)
This zip code:
$1,166
Virginia:
$1,600
(% of AGI for various income ranges: 0.6% for AGIs below $25k, 0.7% for AGIs $25k-50k, 0.6% for AGIs $50k-75k, 0.7% for AGIs $75k-100k, 2.4% for AGIs $100k-200k)
Ordinary dividends: $1,880 (reported on 10.3% of returns)
Here:
$1,880
State:
$6,959
(% of AGI for various income ranges: 0.4% for AGIs below $25k, 0.7% for AGIs $25k-50k, 0.2% for AGIs $50k-75k, 0.9% for AGIs $75k-100k, 0.9% for AGIs $100k-200k)
Net capital gain/loss in AGI: +$1,533 (reported on 8.2% of returns)
Here:
+$1,533
State:
+$16,672
(% of AGI for various income ranges: 0.5% for AGIs below $25k, 0.6% for AGIs $25k-50k, 0.5% for AGIs $75k-100k)
Profit/loss from business: +$5,807 (reported on 10.3% of returns)
Here:
+$5,807
State:
+$14,116
(% of AGI for various income ranges: 4.9% for AGIs below $25k, 2.2% for AGIs $25k-50k, 0.5% for AGIs $50k-75k)
Taxable individual retirement arrangement distribution: $9,440 (reported on 6.8% of returns)
23950:
$9,440
Virginia:
$16,667
(% of AGI for various income ranges: 1.6% for AGIs below $25k, 2.5% for AGIs $25k-50k, 5.1% for AGIs $75k-100k)
Total itemized deductions: $18,756 (30% of AGI, reported on 17.1% of returns)
Here:
$18,756
State:
$26,596
Here:
30.4% of AGI
State:
20.1% of AGI
(% of AGI for various income ranges: 4.4% for AGIs below $25k, 8.6% for AGIs $25k-50k, 11.0% for AGIs $50k-75k, 14.4% for AGIs $75k-100k, 14.4% for AGIs $100k-200k)
Charity contributions: $3,177 (reported on 15.1% of returns)
Here:
$3,177
State:
$4,443
(% of AGI for various income ranges: 0.3% for AGIs below $25k, 1.3% for AGIs $25k-50k, 1.9% for AGIs $50k-75k, 2.2% for AGIs $75k-100k, 2.3% for AGIs $100k-200k)
Taxes paid: $4,044 (reported on 17.1% of returns)
23950:
$4,044
State:
$9,951
(% of AGI for various income ranges: 0.4% for AGIs below $25k, 1.5% for AGIs $25k-50k, 2.6% for AGIs $50k-75k, 2.9% for AGIs $75k-100k, 5.2% for AGIs $100k-200k)
Earned income credit: $2,402 (reported on 32.2% of returns)
Here:
$2,402
State:
$2,211
(% of AGI for various income ranges: 8.9% for AGIs below $25k, 1.7% for AGIs $25k-50k)
Percentage of individuals using paid preparers for their 2012 taxes: 55.5%
Here:
55%
State:
46%
(% for various income ranges: 54.2% for AGIs below $25k, 55.6% for AGIs $25k-50k, 56.2% for AGIs $50k-75k, 55.6% for AGIs $75k-100k, 75.0% for AGIs $100k-200k)
Averages for the 2004 tax year for zip code 23950, filed in 2005:
Average Adjusted Gross Income (AGI) in 2004: $28,306 (Individual Income Tax Returns)
Here:
$28,306
State:
$56,704
Salary/wage: $26,261 (reported on 89.7% of returns)
Here:
$26,261
State:
$48,441
(% of AGI for various income ranges: 117.3% for AGIs below $10k, 86.1% for AGIs $10k-25k, 86.8% for AGIs $25k-50k, 88.5% for AGIs $50k-75k, 70.7% for AGIs $75k-100k, 58.1% for AGIs over 100k)
Taxable interest for individuals: $1,145 (reported on 29.5% of returns)
This zip code:
$1,145
Virginia:
$1,688
(% of AGI for various income ranges: 2.6% for AGIs below $10k, 1.7% for AGIs $10k-25k, 0.9% for AGIs $25k-50k, 0.5% for AGIs $50k-75k, 1.8% for AGIs $75k-100k, 1.5% for AGIs over 100k)
Taxable dividends: $1,565 (reported on 11.2% of returns)
Here:
$1,565
State:
$4,028
(% of AGI for various income ranges: 0.4% for AGIs below $10k, 0.5% for AGIs $10k-25k, 0.6% for AGIs $25k-50k, 0.4% for AGIs $50k-75k, 0.5% for AGIs $75k-100k, 1.6% for AGIs over 100k)
Net capital gain/loss: +$4,067 (reported on 6.6% of returns)
Here:
+$4,067
State:
+$14,375
(% of AGI for various income ranges: 0.2% for AGIs $10k-25k, 0.4% for AGIs $25k-50k, 0.5% for AGIs $50k-75k, 0.6% for AGIs $75k-100k, 6.4% for AGIs over 100k)
Profit/loss from business: +$5,112 (reported on 10.4% of returns)
Here:
+$5,112
State:
+$13,342
(% of AGI for various income ranges: 4.2% for AGIs below $10k, 3.7% for AGIs $10k-25k, 2.0% for AGIs $25k-50k, 0.4% for AGIs $50k-75k, 1.3% for AGIs $75k-100k)
IRA payment deduction: $3,121 (reported on 2.4% of returns)
23950:
$3,121
Virginia:
$2,943
Total itemized deductions: $14,627 (27% of AGI, reported on 15.2% of returns)
Here:
$14,627
State:
$21,492
Here:
27.1% of AGI
State:
21.0% of AGI
(% of AGI for various income ranges: 5.1% for AGIs $10k-25k, 8.3% for AGIs $25k-50k, 8.2% for AGIs $50k-75k, 8.9% for AGIs $75k-100k, 13.3% for AGIs over 100k)
Charity contributions deductions: $2,481 (4% of AGI, reported on 13.2% of returns)
Here:
$2,481
State:
$3,794
Here:
4.5% of AGI
State:
3.5% of AGI
(% of AGI for various income ranges: 0.6% for AGIs $10k-25k, 1.0% for AGIs $25k-50k, 1.2% for AGIs $50k-75k, 2.0% for AGIs $75k-100k, 2.3% for AGIs over 100k)
Total tax: $3,122 (reported on 63.8% of returns)
23950:
$3,122
State:
$9,537
(% of AGI for various income ranges: 2.1% for AGIs below $10k, 3.0% for AGIs $10k-25k, 6.0% for AGIs $25k-50k, 8.5% for AGIs $50k-75k, 11.7% for AGIs $75k-100k, 13.6% for AGIs over 100k)
Earned income credit: $1,904 (reported on 31.2% of returns)
Here:
$1,904
State:
$1,734
Percentage of individuals using paid preparers for their 2004 taxes: 64.0%
Here:
64%
State:
52%
(% for various income ranges: 58.7% for AGIs below $10k, 66.7% for AGIs $10k-25k, 62.5% for AGIs $25k-50k, 63.0% for AGIs $50k-75k, 68.5% for AGIs $75k-100k, 77.8% for AGIs over 100k)
Household received Food Stamps/SNAP in the past 12 months: 465 Household did not receive Food Stamps/SNAP in the past 12 months: 1,131
Women who had a birth in the past 12 months: 13 (11 now married, 1 unmarried) Women who did not have a birth in the past 12 months: 644 (207 now married, 439 unmarried)
Housing units in zip code 23950 with a mortgage: 299 (45 second mortgage, 44 both second mortgage and home equity loan) Median monthly owner costs for units with a mortgage: $1,208 Median monthly owner costs for units without a mortgage: $364
Residents with income below the poverty level in 2022:
This zip code:
38.8%
Whole state:
10.6%
Residents with income below 50% of the poverty level in 2022:
This zip code:
15.0%
Whole state:
5.2%
Median number of rooms in houses and condos:
Here:
6.2
State:
7.0
Median number of rooms in apartments:
Here:
4.6
State:
4.3
Notable locations in this zip code not listed on our city pages
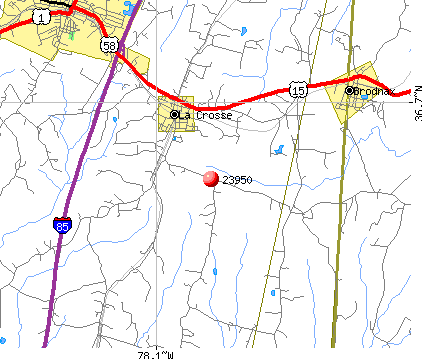
Notable locations in zip code 23950: Northside Industrial Park (A), Burnt Store (B), La Crosse Police Department (C). Display/hide their locations on the map
Churches in zip code 23950 include: Amity Church (A), Rehoboth Church (B), Bethel Grove Church (C), Saint Stephens Church (D), Sardis Church (E), Good Hope Church (F), Little Bethel Church (G), Rehobeth Church (H), New Testament Church (I). Display/hide their locations on the map
Cemeteries: Crestview Memorial Park (1), La Crosse Cemetery (2), Olivet Cemetery (3), Crestview Memorial Park (4), Canaan Cemetery (5), Smith Cemetery (6), Olive Branch Cemetery (7). Display/hide their locations on the map
Streams, rivers, and creeks: Pole Creek (A), Middle Creek (B), Main Creek (C), Long Branch (D), Little Poplar Creek (E), Hagood Creek (F). Display/hide their locations on the map
184 married couples with children.
368 single-parent households (203 men, 165 women).
93.2% of residents of 23950 zip code speak English at home.
6.3% of residents speak Spanish at home (68% very well, 20% well, 12% not well).
Foreign born population: 118 (3.2%) (56.5% of them are naturalized citizens)
This zip code:
3.2%
Whole state:
12.7%
61%Honduras
16%Guatemala
12%El Salvador
3%Japan
38%American
10%English
8%African
5%Irish
1%German
1%European
1%Polish
Year of entry for the foreign-born population
62010 or later
832000 to 2009
91990 to 1999
18Before 1990
Facilities with environmental interests located in this zip code:
AMERICAN BUILDINGS COMPANY (501 GOLDEN EAGLE DR in LA CROSSE, VA)
AIR SYNTHETIC MINOR (AIRS/AFS) STATE MASTER (Virginia pollutants databases) - CEDS-30926, AIR PROGRAM CRITERIA AND HAZARDOUS AIR POLLUTANT INVENTORY (Inventory of air pollution sources) Small Quantity Generators, between 100 kg and 1000 kg of hazardous waste/month (Resource Conservation and Recovery Act (tracking hazardous waste)) - notification Business SIC classification: PREFABRICATED METAL BUILDINGS AND COMPONENTS Business NAICS classification: PREFABRICATED METAL BUILDING AND COMPONENT MANUFACTURING.
Housing units lacking complete plumbing facilities: 2.3% Housing units lacking complete kitchen facilities: 2.4%
65.3%Electricity
16.6%Bottled, tank, or LP gas
12.0%Fuel oil, kerosene, etc.
3.9%Wood
2.1%Other fuel
Population in 1990: 3,036. Population change in the 1990s: +175 (+5.8%).
Place of birth for U.S.-born residents:
This state: 2,798
Northeast: 177
Midwest: 47
South: 467
West: 19
74% of the 23950 zip code residents lived in the same house 5 years ago. Out of people who lived in different houses, 66% lived in this county. Out of people who lived in different counties, 50% lived in Virginia.
97% of the 23950 zip code residents lived in the same house 1 year ago. Out of people who lived in different houses, 21% moved from this county. Out of people who lived in different houses, 91% moved from different county within same state. Out of people who lived in different houses, 4% moved from different state.
Private vs. public school enrollment:
Students in private schools in grades 1 to 8 (elementary and middle school):
Here:
0.0%
Virginia:
13.2%
Students in private schools in grades 9 to 12 (high school): 6
Here:
3.8%
Virginia:
10.2%
Students in private undergraduate colleges: 5
Here:
12.7%
Virginia:
18.7%
Occupation by median earnings in the past 12 months ($)
151,108Management occupations
93,127Computer and mathematical occupations
91,026Community and social service occupations
68,192Health diagnosing and treating practitioners and other technical occupations
59,370Transportation occupations
48,665Sales and related occupations
Companies with federal contracts located in this zip code:
JONES & JONES CONSTRUCTION CO (2010 MARENGO ROAD in LA CROSSE, VA; small business)
$52,000 with U.S. Army Corps of Engineers - civil program financing only for Maintenance, Repair or Alteration of Real Property -- Recreational Buildings. Signed on 2001-07-27. Completion date: 2001-09-30.
Top industries in this zip code by the number of employees in 2005:
Accommodation and Food Services: Hotels (except Casino Hotels) and Motels (10-19: 2)
People in group quarters in 2010:
16 people in group homes intended for adults
15 people in nursing facilities/skilled-nursing facilities
People in group quarters in 2000:
15 people in other noninstitutional group quarters
10 people in homes for the mentally retarded
Fatal accident statistics in 2014:
Fatal accident count: 2
Vehicles involved in fatal accidents: 2
Fatal accidents caused by drunken drivers: 0
Fatalities: 2
Persons involved in fatal accidents: 2
Pedestrians involved in fatal accidents: 0
Fatal accident statistics in 2013:
Fatal accident count: 3
Vehicles involved in fatal accidents: 3
Fatal accidents caused by drunken drivers: 0
Fatalities: 3
Persons involved in fatal accidents: 5
Pedestrians involved in fatal accidents: 0
2002 - 2018 National Fire Incident Reporting System (NFIRS) incidents
According to the data from the years 2002 - 2018 the average number of fires per year is 26. The highest number of fires - 49 took place in 2007, and the least - 14 in 2015. The data has a decreasing trend.
When looking into fire subcategories, the most incidents belonged to: Structure Fires (44.0%), and Outside Fires (40.4%).
Fire incident types reported to NFIRS in Zip Code 23950


 Nearest zip codes: 23919, 23920, 23845, 23970, 23893, 23857.


 According to the data from the years 2002 - 2018 the average number of fires per year is 26. The highest number of fires - 49 took place in 2007, and the least - 14 in 2015. The data has a decreasing trend.
 When looking into fire subcategories, the most incidents belonged to: Structure Fires (44.0%), and Outside Fires (40.4%).