Estimated zip code population in 2022: 2,106 Zip code population in 2010: 2,715 Zip code population in 2000: 2,811
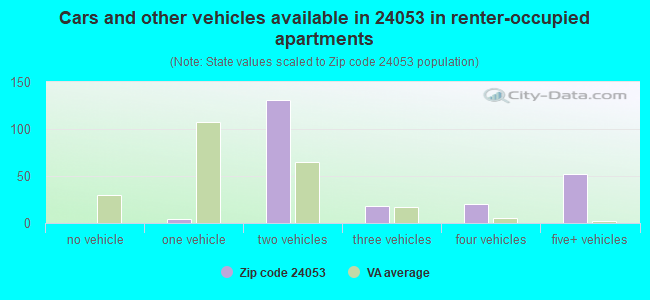
Houses and condos: 1,297 Renter-occupied apartments: 227
% of renters here:
23%
State:
33%
March 2022 cost of living index in zip code 24053: 84.6 (less than average, U.S. average is 100)
Land area: 55.0 sq. mi. Water area: 0.0 sq. mi.
Population density: 38 people per square mile
(very low).
OSM Map
General Map
Google Map
MSN Map
OSM Map
General Map
Google Map
MSN Map
OSM Map
General Map
Google Map
MSN Map
OSM Map
General Map
Google Map
MSN Map
Please wait while loading the map...
Real estate property taxes paid for housing units in 2022:
This zip code:
0.5% ($744)
Virginia:
0.7% ($2,617)
Median real estate property taxes paid for housing units with mortgages in 2022: $781 (0.4%) Median real estate property taxes paid for housing units with no mortgage in 2022: $653 (0.6%)
Business Search- 14 Million verified businesses
Males: 1,037
(49.2%)
Females: 1,068
(50.8%)
For population 25 years and over in 24053:
High school or higher: 81.1%
Bachelor's degree or higher: 10.8%
Graduate or professional degree: 4.9%
Unemployed: 2.6%
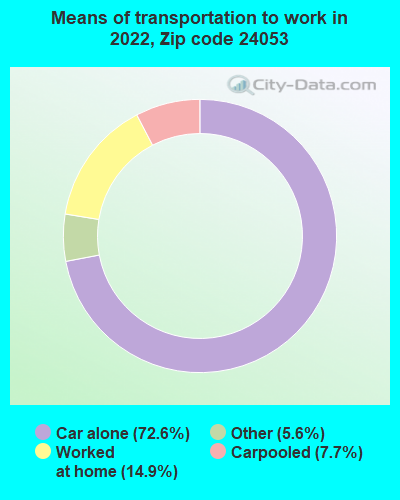
Mean travel time to work (commute): 39.0 minutes
For population 15 years and over in 24053:
Never married: 19.4%
Now married: 56.9%
Separated: 1.9%
Widowed: 13.0%
Divorced: 8.6%
Zip code 24053 compared to state average:
Median household income below state average.
Median house value significantly below state average.
Black race population percentage significantly below state average.
Hispanic race population percentage significantly below state average.
Median age significantly above state average.
Foreign-born population percentage significantly below state average.
Length of stay since moving in significantly above state average.
Number of college students significantly below state average.
Percentage of population with a bachelor's degree or higher significantly below state average.
Estimated median house/condo value in 2022: $153,039
24053:
$153,039
Virginia:
$365,700
According to our research of Virginia and other state lists, there were 5 registered sex offenders living in 24053 zip code as of May 28, 2024. The ratio of all residents to sex offenders in zip code 24053 is 584 to 1. The ratio of registered sex offenders to all residents in this zip code is lower than the state average.
Median resident age:
This zip code:
52.5 years
Virginia median age:
39.0 years
Average household size:
This zip code:
2.1 people
Virginia:
2.5 people
Averages for the 2020 tax year for zip code 24053, filed in 2021:
Average Adjusted Gross Income (AGI) in 2020: $44,496 (Individual Income Tax Returns)
Here:
$44,496
State:
$86,446
Salary/wage: $39,291 (reported on 81.1% of returns)
Here:
$39,291
State:
$71,185
(% of AGI for various income ranges: 1277.2% for AGIs below $25k, 3869.0% for AGIs $25k-50k, 6625.0% for AGIs $50k-75k, 12340.0% for AGIs $75k-100k, 14750.0% for AGIs $100k-200k)
Taxable interest for individuals: $646 (reported on 27.4% of returns)
This zip code:
$646
Virginia:
$1,805
(% of AGI for various income ranges: 19.2% for AGIs below $25k, 25.2% for AGIs $25k-50k, 34.0% for AGIs $50k-75k, 30.0% for AGIs $75k-100k, 42.0% for AGIs $100k-200k)
Ordinary dividends: $2,700 (reported on 12.6% of returns)
Here:
$2,700
State:
$8,327
(% of AGI for various income ranges: 15.2% for AGIs below $25k, 28.6% for AGIs $25k-50k, 103.0% for AGIs $50k-75k, 307.5% for AGIs $75k-100k)
Net capital gain/loss in AGI: +$7,682 (reported on 11.6% of returns)
Here:
+$7,682
State:
+$24,644
(% of AGI for various income ranges: 26.7% for AGIs $25k-50k, 214.0% for AGIs $50k-75k, 1162.0% for AGIs $100k-200k)
Profit/loss from business: +$9,406 (reported on 16.8% of returns)
Here:
+$9,406
State:
+$12,836
(% of AGI for various income ranges: 185.2% for AGIs below $25k, 198.6% for AGIs $25k-50k, 509.0% for AGIs $50k-75k, 232.0% for AGIs $100k-200k)
Taxable individual retirement arrangement distribution: $13,700 (reported on 7.4% of returns)
24053:
$13,700
Virginia:
$21,535
(% of AGI for various income ranges: 114.0% for AGIs below $25k, 674.0% for AGIs $50k-75k)
Total itemized deductions: $28,500 (reported on 2.1% of returns)
Here:
$28,500
State:
$33,287
(% of AGI for various income ranges: 570.0% for AGIs $50k-75k)
Taxes paid: $7,150 (reported on 2.1% of returns)
24053:
$7,150
State:
$8,284
(% of AGI for various income ranges: 143.0% for AGIs $50k-75k)
Earned income credit: $2,270 (reported on 21.1% of returns)
Here:
$2,270
State:
$2,214
(% of AGI for various income ranges: 104.4% for AGIs below $25k, 91.9% for AGIs $25k-50k)
Percentage of individuals using paid preparers for their 2020 taxes: 93.7%
Here:
94%
State:
92%
(% for various income ranges: 91.9% for AGIs below $25k, 96.4% for AGIs $25k-50k, 93.3% for AGIs $50k-75k, 100.0% for AGIs $75k-100k, 87.5% for AGIs $100k-200k)
Averages for the 2012 tax year for zip code 24053, filed in 2013:
Average Adjusted Gross Income (AGI) in 2012: $34,255 (Individual Income Tax Returns)
Here:
$34,255
State:
$71,192
Salary/wage: $31,744 (reported on 82.0% of returns)
Here:
$31,744
State:
$59,229
(% of AGI for various income ranges: 74.1% for AGIs below $25k, 83.6% for AGIs $25k-50k, 76.4% for AGIs $50k-75k, 74.9% for AGIs $75k-100k, 62.7% for AGIs $100k-200k)
Taxable interest for individuals: $755 (reported on 32.6% of returns)
This zip code:
$755
Virginia:
$1,600
(% of AGI for various income ranges: 1.2% for AGIs below $25k, 0.8% for AGIs $25k-50k, 0.8% for AGIs $50k-75k, 0.3% for AGIs $75k-100k, 0.2% for AGIs $100k-200k)
Ordinary dividends: $1,271 (reported on 15.7% of returns)
Here:
$1,271
State:
$6,959
(% of AGI for various income ranges: 0.7% for AGIs below $25k, 0.5% for AGIs $25k-50k, 0.4% for AGIs $50k-75k, 1.4% for AGIs $75k-100k)
Net capital gain/loss in AGI: +$1,912 (reported on 9.0% of returns)
Here:
+$1,912
State:
+$16,672
(% of AGI for various income ranges: 0.2% for AGIs below $25k, 1.2% for AGIs $25k-50k, 0.8% for AGIs $75k-100k)
Profit/loss from business: +$6,244 (reported on 18.0% of returns)
Here:
+$6,244
State:
+$14,116
(% of AGI for various income ranges: 9.3% for AGIs below $25k, 4.9% for AGIs $25k-50k, 0.8% for AGIs $75k-100k)
Taxable individual retirement arrangement distribution: $8,000 (reported on 9.0% of returns)
24053:
$8,000
Virginia:
$16,667
Total itemized deductions: $17,667 (25% of AGI, reported on 16.9% of returns)
Here:
$17,667
State:
$26,596
Here:
25.4% of AGI
State:
20.1% of AGI
(% of AGI for various income ranges: 8.7% for AGIs $25k-50k, 8.7% for AGIs $50k-75k, 13.0% for AGIs $75k-100k, 16.1% for AGIs $100k-200k)
Charity contributions: $4,445 (reported on 12.4% of returns)
Here:
$4,445
State:
$4,443
(% of AGI for various income ranges: 1.1% for AGIs $25k-50k, 1.8% for AGIs $50k-75k, 2.9% for AGIs $75k-100k, 3.1% for AGIs $100k-200k)
Taxes paid: $4,687 (reported on 16.9% of returns)
24053:
$4,687
State:
$9,951
(% of AGI for various income ranges: 1.7% for AGIs $25k-50k, 2.0% for AGIs $50k-75k, 3.9% for AGIs $75k-100k, 5.6% for AGIs $100k-200k)
Earned income credit: $2,238 (reported on 29.2% of returns)
Here:
$2,238
State:
$2,211
(% of AGI for various income ranges: 7.9% for AGIs below $25k, 1.5% for AGIs $25k-50k)
Percentage of individuals using paid preparers for their 2012 taxes: 75.3%
Here:
75%
State:
46%
(% for various income ranges: 75.0% for AGIs below $25k, 76.0% for AGIs $25k-50k, 75.0% for AGIs $50k-75k, 80.0% for AGIs $75k-100k, 66.7% for AGIs $100k-200k)
Averages for the 2004 tax year for zip code 24053, filed in 2005:
Average Adjusted Gross Income (AGI) in 2004: $29,802 (Individual Income Tax Returns)
Here:
$29,802
State:
$56,704
Salary/wage: $27,944 (reported on 83.3% of returns)
Here:
$27,944
State:
$48,441
(% of AGI for various income ranges: 87.5% for AGIs below $10k, 75.1% for AGIs $10k-25k, 84.5% for AGIs $25k-50k, 85.3% for AGIs $50k-75k, 77.1% for AGIs $75k-100k, 39.8% for AGIs over 100k)
Taxable interest for individuals: $1,020 (reported on 38.4% of returns)
This zip code:
$1,020
Virginia:
$1,688
(% of AGI for various income ranges: 4.0% for AGIs below $10k, 3.6% for AGIs $10k-25k, 0.9% for AGIs $25k-50k, 0.7% for AGIs $50k-75k, 0.2% for AGIs $75k-100k, 0.2% for AGIs over 100k)
Taxable dividends: $1,214 (reported on 12.7% of returns)
Here:
$1,214
State:
$4,028
(% of AGI for various income ranges: 0.8% for AGIs below $10k, 0.8% for AGIs $10k-25k, 0.2% for AGIs $25k-50k, 0.3% for AGIs $50k-75k, 1.6% for AGIs $75k-100k)
Net capital gain/loss: +$2,841 (reported on 11.6% of returns)
Here:
+$2,841
State:
+$14,375
(% of AGI for various income ranges: 1.7% for AGIs below $10k, 1.3% for AGIs $10k-25k, 1.0% for AGIs $25k-50k, 0.3% for AGIs $50k-75k, 3.1% for AGIs $75k-100k)
Profit/loss from business: +$5,281 (reported on 15.1% of returns)
Here:
+$5,281
State:
+$13,342
(% of AGI for various income ranges: -12.2% for AGIs below $10k, 8.3% for AGIs $10k-25k, 2.5% for AGIs $25k-50k, 1.9% for AGIs $50k-75k, 1.7% for AGIs $75k-100k)
IRA payment deduction: $2,632 (reported on 2.1% of returns)
24053:
$2,632
Virginia:
$2,943
Total itemized deductions: $15,081 (26% of AGI, reported on 17.4% of returns)
Here:
$15,081
State:
$21,492
Here:
25.6% of AGI
State:
21.0% of AGI
(% of AGI for various income ranges: 6.2% for AGIs $10k-25k, 8.1% for AGIs $25k-50k, 9.4% for AGIs $50k-75k, 14.4% for AGIs $75k-100k, 10.8% for AGIs over 100k)
Charity contributions deductions: $3,261 (5% of AGI, reported on 12.9% of returns)
Here:
$3,261
State:
$3,794
Here:
5.3% of AGI
State:
3.5% of AGI
(% of AGI for various income ranges: 0.3% for AGIs $10k-25k, 1.4% for AGIs $25k-50k, 1.7% for AGIs $50k-75k, 2.8% for AGIs $75k-100k, 1.3% for AGIs over 100k)
Total tax: $3,132 (reported on 69.9% of returns)
24053:
$3,132
State:
$9,537
(% of AGI for various income ranges: 3.2% for AGIs below $10k, 4.0% for AGIs $10k-25k, 5.8% for AGIs $25k-50k, 8.0% for AGIs $50k-75k, 10.3% for AGIs $75k-100k, 15.6% for AGIs over 100k)
Earned income credit: $1,587 (reported on 24.2% of returns)
Here:
$1,587
State:
$1,734
Percentage of individuals using paid preparers for their 2004 taxes: 82.2%
Here:
82%
State:
52%
(% for various income ranges: 78.0% for AGIs below $10k, 82.3% for AGIs $10k-25k, 82.2% for AGIs $25k-50k, 85.0% for AGIs $50k-75k, 90.5% for AGIs $75k-100k, 93.8% for AGIs over 100k)
Household received Food Stamps/SNAP in the past 12 months: 92 Household did not receive Food Stamps/SNAP in the past 12 months: 895
Women who had a birth in the past 12 months: 15 (0 now married, 14 unmarried) Women who did not have a birth in the past 12 months: 390 (279 now married, 107 unmarried)
Housing units in zip code 24053 with a mortgage: 287 (18 second mortgage, 18 both second mortgage and home equity loan) Median monthly owner costs for units with a mortgage: $1,231 Median monthly owner costs for units without a mortgage: $317
Residents with income below the poverty level in 2022:
This zip code:
18.3%
Whole state:
10.6%
Residents with income below 50% of the poverty level in 2022:
This zip code:
1.5%
Whole state:
5.2%
Median number of rooms in houses and condos:
Here:
5.8
State:
7.0
Median number of rooms in apartments:
Here:
5.7
State:
4.3
Notable locations in this zip code not listed on our city pages
Churches in zip code 24053 include: Ararat Church (A), Raven Rock Church (B), Blue Ridge Tabernacle (C), Bluemont Church (D), Samuels Grove Church (E), Chestnut Grove Church (F), Clarks Creek Church (G), Danube Church (H), Doe Run Church (I). Display/hide their locations on the map
Cemeteries: McMillian Cemetery (1), State Line Cemetery (2), Puckett Memorial Cemetery (3), Willis Gap Cemetery (4), Unity Cemetery (5), Mountain View Cemetery (6), Hunters Chapel Cemetery (7). Display/hide their locations on the map
Streams, rivers, and creeks: Thompson Creek (A), Sun Run (B), Squirrel Creek (C), Rye Stack Branch (D), Owens Branch (E), Mire Branch (F), Lickskillet Branch (G), Kings Run (H), King Noahs Branch (I). Display/hide their locations on the map
Tourist attraction (not listed on the city page) : JEB Stuart Birthplace Preservation Trust Inc (Cultural Attractions- Events- & Facilities; 1288 Ararat Highway) (1). Display/hide its approximate location on the map
Size of family households: 319 2-persons, 182 3-persons, 163 4-persons, 22 5-persons
Size of nonfamily households: 264 1-person, 31 2-persons
257 married couples with children.
39 single-parent households (39 women).
95.2% of residents of 24053 zip code speak English at home.
2.1% of residents speak Spanish at home (30% very well, 70% not well).
2.2% of residents speak Asian or Pacific Island language at home (24% very well, 76% well).
Foreign born population: 36 (1.7%) (100.0% of them are naturalized citizens)
This zip code:
1.7%
Whole state:
12.7%
44%Thailand
32%China, excluding Hong Kong and Taiwan
70%American
3%English
3%Irish
3%Scotch-Irish
2%German
1%Scottish
0%Jamaican
Year of entry for the foreign-born population
02010 or later
02000 to 2009
191990 to 1999
32Before 1990
Public elementary/middle school in in zip code 24053 not listed on the city page:
BLUE RIDGE ELEM(Students: 261, Location: 5135 ARARAT HWY, Grades: PK-7)
Facilities with environmental interests located in this zip code:
BLUE RIDGE ELEMENTARY SCHOOL (ST RT 773 in ARARAT, VA)
AIR MINOR (AIRS/AFS) STATE MASTER (Virginia pollutants databases) - CEDS-30521, AIR PROGRAM Business SIC and NAICS classification: ELEMENTARY AND SECONDARY SCHOOLS
BLUE RIDGE ELEM. (5135 ARARAT HWY in ARARAT, VA)
(National Center for Education Statistics) - STATE ID-0700440 Organizations: PATRICK COUNTY PUBLIC SCHOOLS (SCHOOL DISTRICT)
Housing units lacking complete kitchen facilities: 5.3%
57.0%Electricity
18.0%Fuel oil, kerosene, etc.
15.8%Wood
7.0%Bottled, tank, or LP gas
2.4%Utility gas
Population in 1990: 960. Population change in the 1990s: +1,851 (+192.8%).
Place of birth for U.S.-born residents:
This state: 789
Northeast: 49
Midwest: 167
South: 1,039
64% of the 24053 zip code residents lived in the same house 5 years ago. Out of people who lived in different houses, 41% lived in this county. Out of people who lived in different counties, 50% lived in Virginia.
99% of the 24053 zip code residents lived in the same house 1 year ago. Out of people who lived in different houses, 95% moved from this county. Out of people who lived in different houses, 36% moved from different county within same state.
Private vs. public school enrollment:
Students in private schools in grades 1 to 8 (elementary and middle school): 13
Here:
10.9%
Virginia:
13.2%
Students in private schools in grades 9 to 12 (high school):
Here:
0.0%
Virginia:
10.2%
Students in private undergraduate colleges:
Here:
0.0%
Virginia:
18.7%
Occupation by median earnings in the past 12 months ($)
120,301Computer and mathematical occupations
51,330Construction and extraction occupations
47,030Transportation occupations
35,386Office and administrative support occupations
32,153Production occupations
25,540Installation, maintenance, and repair occupations
Top industries in this zip code by the number of employees in 2005:
Professional, Scientific, and Technical Services: Administrative Management and General Management Consulting Services (50-99 employees: 1 establishment)
Accommodation and Food Services: Limited-Service Restaurants (20-49: 1)
Administrative and Support and Waste Management and Remediation Services: Landscaping Services (5-9: 1)
Construction: New Single-Family Housing Construction (except Operative Builders) (5-9: 1)
Other Services (except Public Administration): Religious Organizations (1-4: 2)
Fatal accident statistics in 2013:
Fatal accident count: 1
Vehicles involved in fatal accidents: 1
Fatal accidents caused by drunken drivers: 0
Fatalities: 1
Persons involved in fatal accidents: 1
Pedestrians involved in fatal accidents: 0
Fatal accident statistics in 2011:
Fatal accident count: 2
Vehicles involved in fatal accidents: 2
Fatal accidents caused by drunken drivers: 0
Fatalities: 2
Persons involved in fatal accidents: 4
Pedestrians involved in fatal accidents: 0
2002 - 2018 National Fire Incident Reporting System (NFIRS) incidents
According to the data from the years 2002 - 2018 the average number of fire incidents per year is 19. The highest number of reported fire incidents - 42 took place in 2008, and the least - 5 in 2002. The data has a rising trend.
When looking into fire subcategories, the most reports belonged to: Outside Fires (44.2%), and Structure Fires (36.7%).
Fire incident types reported to NFIRS in Zip Code 24053


 Nearest zip codes: 24352, 24076, 24317, 24120, 27030, 24328.


 (Students: 261, Location: 5135 ARARAT HWY, Grades: PK-7)


 According to the data from the years 2002 - 2018 the average number of fire incidents per year is 19. The highest number of reported fire incidents - 42 took place in 2008, and the least - 5 in 2002. The data has a rising trend.
 When looking into fire subcategories, the most reports belonged to: Outside Fires (44.2%), and Structure Fires (36.7%).