Estimated zip code population in 2022: 1,670 Zip code population in 2010: 1,726 Zip code population in 2000: 1,621
Houses and condos: 1,554 Renter-occupied apartments: 44
% of renters here:
5%
State:
33%
March 2022 cost of living index in zip code 24328: 83.0 (low, U.S. average is 100)
Land area: 37.6 sq. mi. Water area: 0.1 sq. mi.
Population density: 44 people per square mile
(very low).
OSM Map
General Map
Google Map
MSN Map
OSM Map
General Map
Google Map
MSN Map
OSM Map
General Map
Google Map
MSN Map
OSM Map
General Map
Google Map
MSN Map
Please wait while loading the map...
Real estate property taxes paid for housing units in 2022:
This zip code:
0.7% ($1,291)
Virginia:
0.7% ($2,617)
Median real estate property taxes paid for housing units with mortgages in 2022: $1,183 (0.7%) Median real estate property taxes paid for housing units with no mortgage in 2022: $1,457 (0.8%)
Estimated median house/condo value in 2022: $179,621
24328:
$179,621
Virginia:
$365,700
According to our research of Virginia and other state lists, there were 4 registered sex offenders living in 24328 zip code as of June 09, 2024. The ratio of all residents to sex offenders in zip code 24328 is 403 to 1. The ratio of registered sex offenders to all residents in this zip code is near the state average.
Median resident age:
This zip code:
65.6 years
Virginia median age:
39.0 years
Average household size:
This zip code:
1.9 people
Virginia:
2.5 people
Averages for the 2020 tax year for zip code 24328, filed in 2021:
Average Adjusted Gross Income (AGI) in 2020: $53,870 (Individual Income Tax Returns)
Here:
$53,870
State:
$86,446
Salary/wage: $44,477 (reported on 70.3% of returns)
Here:
$44,477
State:
$71,185
(% of AGI for various income ranges: 992.3% for AGIs below $25k, 2984.4% for AGIs $25k-50k, 5994.4% for AGIs $50k-75k, 9326.0% for AGIs $75k-100k, 22898.0% for AGIs $100k-200k)
Taxable interest for individuals: $1,083 (reported on 33.0% of returns)
This zip code:
$1,083
Virginia:
$1,805
(% of AGI for various income ranges: 35.5% for AGIs below $25k, 13.1% for AGIs $25k-50k, 62.2% for AGIs $50k-75k, 24.0% for AGIs $75k-100k, 316.0% for AGIs $100k-200k)
Ordinary dividends: $3,256 (reported on 17.6% of returns)
Here:
$3,256
State:
$8,327
(% of AGI for various income ranges: 18.6% for AGIs below $25k, 53.8% for AGIs $25k-50k, 210.0% for AGIs $75k-100k, 578.0% for AGIs $100k-200k)
Net capital gain/loss in AGI: +$11,925 (reported on 17.6% of returns)
Here:
+$11,925
State:
+$24,644
(% of AGI for various income ranges: 12.7% for AGIs below $25k, 23.1% for AGIs $25k-50k, 103.3% for AGIs $50k-75k, 208.0% for AGIs $75k-100k, 3292.0% for AGIs $100k-200k)
Profit/loss from business: +$7,306 (reported on 17.6% of returns)
Here:
+$7,306
State:
+$12,836
(% of AGI for various income ranges: 194.1% for AGIs below $25k, 199.4% for AGIs $25k-50k, 130.0% for AGIs $50k-75k, 532.0% for AGIs $75k-100k, 80.0% for AGIs $100k-200k)
Taxable individual retirement arrangement distribution: $19,808 (reported on 14.3% of returns)
24328:
$19,808
Virginia:
$21,535
(% of AGI for various income ranges: 77.7% for AGIs below $25k, 158.1% for AGIs $25k-50k, 693.3% for AGIs $50k-75k, 1070.0% for AGIs $75k-100k, 1984.0% for AGIs $100k-200k)
Total itemized deductions: $26,975 (reported on 4.4% of returns)
Here:
$26,975
State:
$33,287
(% of AGI for various income ranges: 2158.0% for AGIs $75k-100k)
Charity contributions: $9,200 (reported on 3.3% of returns)
Here:
$9,200
State:
$10,381
(% of AGI for various income ranges: 306.7% for AGIs $50k-75k)
Taxes paid: $5,900 (reported on 4.4% of returns)
24328:
$5,900
State:
$8,284
(% of AGI for various income ranges: 262.2% for AGIs $50k-75k)
Earned income credit: $1,885 (reported on 14.3% of returns)
Here:
$1,885
State:
$2,214
(% of AGI for various income ranges: 65.5% for AGIs below $25k, 63.1% for AGIs $25k-50k)
Percentage of individuals using paid preparers for their 2020 taxes: 93.4%
Here:
93%
State:
92%
(% for various income ranges: 93.8% for AGIs below $25k, 95.5% for AGIs $25k-50k, 93.3% for AGIs $50k-75k, 90.0% for AGIs $75k-100k, 91.7% for AGIs $100k-200k)
Averages for the 2012 tax year for zip code 24328, filed in 2013:
Average Adjusted Gross Income (AGI) in 2012: $42,844 (Individual Income Tax Returns)
Here:
$42,844
State:
$71,192
Salary/wage: $35,732 (reported on 76.0% of returns)
Here:
$35,732
State:
$59,229
(% of AGI for various income ranges: 61.4% for AGIs below $25k, 71.3% for AGIs $25k-50k, 65.2% for AGIs $50k-75k, 66.5% for AGIs $75k-100k, 55.3% for AGIs $100k-200k)
Taxable interest for individuals: $1,139 (reported on 37.3% of returns)
This zip code:
$1,139
Virginia:
$1,600
(% of AGI for various income ranges: 1.3% for AGIs below $25k, 0.8% for AGIs $25k-50k, 1.2% for AGIs $50k-75k, 0.6% for AGIs $75k-100k, 1.1% for AGIs $100k-200k)
Ordinary dividends: $1,746 (reported on 17.3% of returns)
Here:
$1,746
State:
$6,959
(% of AGI for various income ranges: 1.2% for AGIs below $25k, 0.5% for AGIs $25k-50k, 1.1% for AGIs $50k-75k, 0.4% for AGIs $75k-100k, 0.5% for AGIs $100k-200k)
Net capital gain/loss in AGI: +$3,544 (reported on 12.0% of returns)
Here:
+$3,544
State:
+$16,672
(% of AGI for various income ranges: 1.7% for AGIs $50k-75k, 2.3% for AGIs $100k-200k)
Profit/loss from business: +$5,085 (reported on 17.3% of returns)
Here:
+$5,085
State:
+$14,116
(% of AGI for various income ranges: 8.4% for AGIs below $25k, 2.9% for AGIs $25k-50k, 0.5% for AGIs $50k-75k, 1.5% for AGIs $75k-100k)
Taxable individual retirement arrangement distribution: $12,200 (reported on 14.7% of returns)
24328:
$12,200
Virginia:
$16,667
(% of AGI for various income ranges: 4.1% for AGIs below $25k, 3.4% for AGIs $25k-50k, 6.3% for AGIs $50k-75k, 9.4% for AGIs $75k-100k)
Total itemized deductions: $20,353 (24% of AGI, reported on 20.0% of returns)
Here:
$20,353
State:
$26,596
Here:
24.4% of AGI
State:
20.1% of AGI
(% of AGI for various income ranges: 8.6% for AGIs below $25k, 6.4% for AGIs $25k-50k, 7.9% for AGIs $50k-75k, 12.2% for AGIs $75k-100k, 11.8% for AGIs $100k-200k)
Charity contributions: $3,350 (reported on 18.7% of returns)
Here:
$3,350
State:
$4,443
(% of AGI for various income ranges: 1.5% for AGIs $25k-50k, 1.7% for AGIs $50k-75k, 2.4% for AGIs $75k-100k, 1.3% for AGIs $100k-200k)
Taxes paid: $5,813 (reported on 20.0% of returns)
24328:
$5,813
State:
$9,951
(% of AGI for various income ranges: 1.1% for AGIs below $25k, 1.2% for AGIs $25k-50k, 1.8% for AGIs $50k-75k, 3.4% for AGIs $75k-100k, 4.9% for AGIs $100k-200k)
Earned income credit: $1,821 (reported on 18.7% of returns)
Here:
$1,821
State:
$2,211
(% of AGI for various income ranges: 4.6% for AGIs below $25k, 1.0% for AGIs $25k-50k)
Percentage of individuals using paid preparers for their 2012 taxes: 73.3%
Here:
73%
State:
46%
(% for various income ranges: 69.7% for AGIs below $25k, 73.7% for AGIs $25k-50k, 81.8% for AGIs $50k-75k, 83.3% for AGIs $75k-100k, 66.7% for AGIs $100k-200k)
Averages for the 2004 tax year for zip code 24328, filed in 2005:
Average Adjusted Gross Income (AGI) in 2004: $35,861 (Individual Income Tax Returns)
Here:
$35,861
State:
$56,704
Salary/wage: $31,904 (reported on 78.7% of returns)
Here:
$31,904
State:
$48,441
(% of AGI for various income ranges: 101.2% for AGIs below $10k, 69.2% for AGIs $10k-25k, 74.0% for AGIs $25k-50k, 74.3% for AGIs $50k-75k, 66.5% for AGIs $75k-100k, 56.5% for AGIs over 100k)
Taxable interest for individuals: $1,492 (reported on 48.0% of returns)
This zip code:
$1,492
Virginia:
$1,688
(% of AGI for various income ranges: 15.7% for AGIs below $10k, 2.5% for AGIs $10k-25k, 1.8% for AGIs $25k-50k, 1.1% for AGIs $50k-75k, 0.6% for AGIs $75k-100k, 2.7% for AGIs over 100k)
Taxable dividends: $2,384 (reported on 19.7% of returns)
Here:
$2,384
State:
$4,028
(% of AGI for various income ranges: 2.7% for AGIs below $10k, 1.4% for AGIs $10k-25k, 0.9% for AGIs $25k-50k, 0.9% for AGIs $50k-75k, 3.1% for AGIs over 100k)
Net capital gain/loss: +$3,347 (reported on 15.9% of returns)
Here:
+$3,347
State:
+$14,375
(% of AGI for various income ranges: -0.3% for AGIs $10k-25k, 1.9% for AGIs $25k-50k, 3.5% for AGIs $50k-75k, 0.4% for AGIs over 100k)
Profit/loss from business: +$6,207 (reported on 16.3% of returns)
Here:
+$6,207
State:
+$13,342
(% of AGI for various income ranges: -5.5% for AGIs below $10k, 9.5% for AGIs $10k-25k, 5.1% for AGIs $25k-50k, -0.2% for AGIs $50k-75k, 1.2% for AGIs $75k-100k)
IRA payment deduction: $2,412 (reported on 2.3% of returns)
24328:
$2,412
Virginia:
$2,943
Total itemized deductions: $16,384 (24% of AGI, reported on 23.9% of returns)
Here:
$16,384
State:
$21,492
Here:
24.4% of AGI
State:
21.0% of AGI
(% of AGI for various income ranges: 6.5% for AGIs $10k-25k, 9.0% for AGIs $25k-50k, 11.8% for AGIs $50k-75k, 16.0% for AGIs $75k-100k, 14.5% for AGIs over 100k)
Charity contributions deductions: $2,779 (4% of AGI, reported on 19.6% of returns)
Here:
$2,779
State:
$3,794
Here:
3.9% of AGI
State:
3.5% of AGI
(% of AGI for various income ranges: 0.6% for AGIs $10k-25k, 1.1% for AGIs $25k-50k, 2.1% for AGIs $50k-75k, 1.9% for AGIs $75k-100k, 2.0% for AGIs over 100k)
Total tax: $4,142 (reported on 76.2% of returns)
24328:
$4,142
State:
$9,537
(% of AGI for various income ranges: 4.5% for AGIs below $10k, 4.3% for AGIs $10k-25k, 6.3% for AGIs $25k-50k, 8.5% for AGIs $50k-75k, 11.4% for AGIs $75k-100k, 15.9% for AGIs over 100k)
Earned income credit: $1,642 (reported on 16.2% of returns)
Here:
$1,642
State:
$1,734
Percentage of individuals using paid preparers for their 2004 taxes: 74.5%
Here:
74%
State:
52%
(% for various income ranges: 66.4% for AGIs below $10k, 77.5% for AGIs $10k-25k, 75.6% for AGIs $25k-50k, 76.1% for AGIs $50k-75k, 87.5% for AGIs $75k-100k, 62.5% for AGIs over 100k)
Notable locations in zip code 24328: Sugarloaf Overlook (A), Piedmont Overlook (B), Pipers Gap (C), Skyland Lakes (D). Display/hide their locations on the map
Churches in zip code 24328 include: Round Knob Church (A), Sky View Church (B), Elk Spur Church (C), Fancy Gap Church (D), Good Hope Church (E), Martin Church (F). Display/hide their locations on the map
Cemeteries: Milepost 197 Cemetery (1), Melton Cemetery (2), Martin Cemetery (3), Johnson-Leftwich Cemetery (4), Jesse Bond Cemetery (5), Jack Allen Cemetery (6), Horton Cemetery (7). Display/hide their locations on the map
Size of family households: 360 2-persons, 54 3-persons, 95 4-persons, 3 5-persons
Size of nonfamily households: 332 1-person, 20 2-persons
114 married couples with children.
10 single-parent households (10 men).
101.6% of residents of 24328 zip code speak English at home.
Foreign born population: 0 (0.0%)
:
0.0%
Whole state:
12.7%
30%English
21%American
12%European
3%German
3%Swiss
3%Irish
3%Scotch-Irish
Year of entry for the foreign-born population
02010 or later
212000 to 2009
01990 to 1999
0Before 1990
Facilities with environmental interests located in this zip code:
CARROLL COUNTY PUBLIC SCHOOLS/FANCY GAP ELEMENTARY (RTE 685 in FANCY GAP, VA)
AIR MINOR (AIRS/AFS) STATE MASTER (Virginia pollutants databases) - CEDS-10550, AIR PROGRAM CRITERIA AND HAZARDOUS AIR POLLUTANT INVENTORY (Inventory of air pollution sources) Business SIC and NAICS classification: ELEMENTARY AND SECONDARY SCHOOLS
Housing units lacking complete plumbing facilities: 0.9% Housing units lacking complete kitchen facilities: 3.4%
73.3%Electricity
12.7%Bottled, tank, or LP gas
8.7%Fuel oil, kerosene, etc.
4.6%Wood
0.8%Utility gas
Population in 1990: 1,929.
Place of birth for U.S.-born residents:
This state: 701
Northeast: 174
Midwest: 48
South: 689
West: 31
77% of the 24328 zip code residents lived in the same house 5 years ago. Out of people who lived in different houses, 47% lived in this county. Out of people who lived in different counties, 50% lived in Virginia.
89% of the 24328 zip code residents lived in the same house 1 year ago. Out of people who lived in different houses, 21% moved from this county. Out of people who lived in different houses, 16% moved from different county within same state. Out of people who lived in different houses, 67% moved from different state.
Private vs. public school enrollment:
Students in private schools in grades 1 to 8 (elementary and middle school): 22
Here:
12.6%
Virginia:
13.2%
Students in private schools in grades 9 to 12 (high school):
Here:
0.0%
Virginia:
10.2%
Occupation by median earnings in the past 12 months ($)
40,404Sales and related occupations
23,254Management occupations
15,904Office and administrative support occupations
Top industries in this zip code by the number of employees in 2005:
Accommodation and Food Services: Hotels (except Casino Hotels) and Motels (10-19 employees: 2 establishments, 1-4 employees: 3 establishments)
Accommodation and Food Services: Limited-Service Restaurants (20-49: 1)
Accommodation and Food Services: Full-Service Restaurants (20-49: 1)
Construction: Site Preparation Contractors (10-19: 1, 1-4: 1)
Construction: New Single-Family Housing Construction (except Operative Builders) (5-9: 2, 1-4: 1)
Other Services (except Public Administration): Religious Organizations (1-4: 4)
Construction: New Housing Operative Builders (5-9: 1)
Other Services (except Public Administration): Other Social Advocacy Organizations (5-9: 1)
Fatal accident statistics in 2013:
Fatal accident count: 1
Vehicles involved in fatal accidents: 6
Fatal accidents caused by drunken drivers: 0
Fatalities: 1
Persons involved in fatal accidents: 8
Pedestrians involved in fatal accidents: 0
Fatal accident statistics in 2011:
Fatal accident count: 2
Vehicles involved in fatal accidents: 3
Fatal accidents caused by drunken drivers: 0
Fatalities: 2
Persons involved in fatal accidents: 6
Pedestrians involved in fatal accidents: 0
2002 - 2018 National Fire Incident Reporting System (NFIRS) incidents
Based on the data from the years 2002 - 2018 the average number of fires per year is 14. The highest number of reported fire incidents - 28 took place in 2002, and the least - 4 in 2004. The data has a dropping trend.
When looking into fire subcategories, the most reports belonged to: Mobile Property/Vehicle Fires (42.0%), and Outside Fires (32.5%).
Fire incident types reported to NFIRS in Zip Code 24328


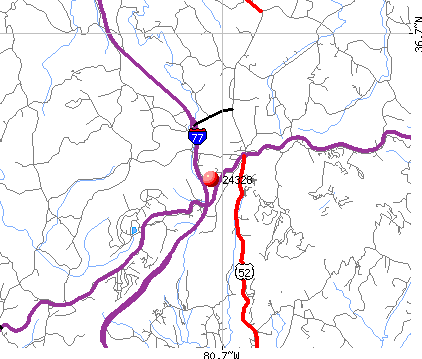 Nearest zip codes: 24317, 24351, 24343, 24381, 27030, 24053.


 Based on the data from the years 2002 - 2018 the average number of fires per year is 14. The highest number of reported fire incidents - 28 took place in 2002, and the least - 4 in 2004. The data has a dropping trend.
 When looking into fire subcategories, the most reports belonged to: Mobile Property/Vehicle Fires (42.0%), and Outside Fires (32.5%).