Estimated zip code population in 2022: 7,354 Zip code population in 2010: 7,115 Zip code population in 2000: 7,629
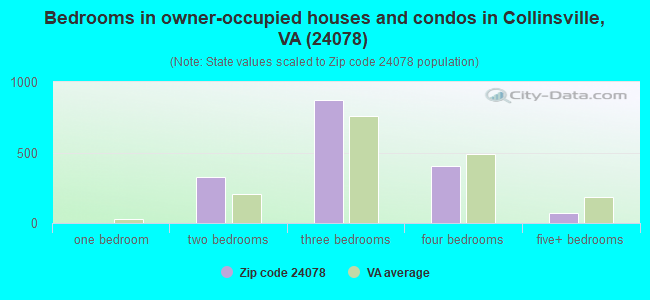
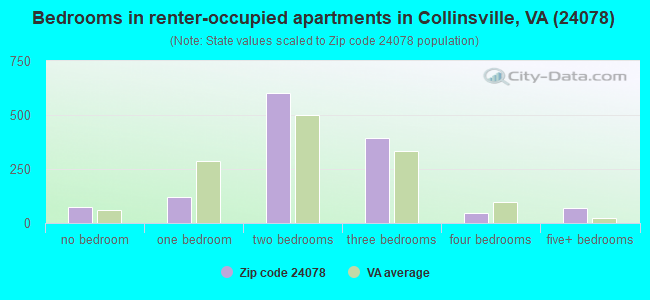
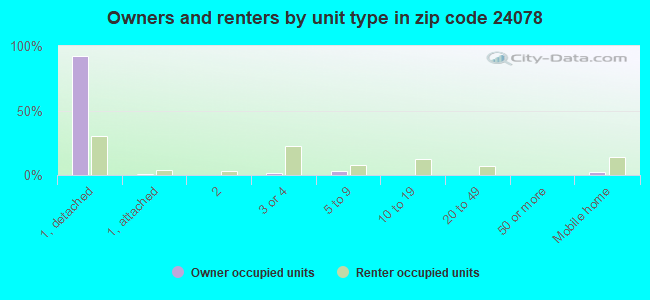
Houses and condos: 3,498 Renter-occupied apartments: 1,308
% of renters here:
44%
State:
33%
March 2022 cost of living index in zip code 24078: 76.3 (low, U.S. average is 100)
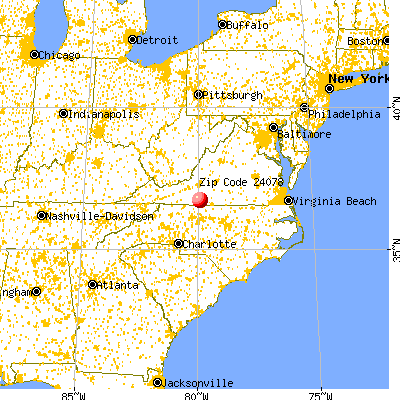
Land area: 6.9 sq. mi. Water area: 0.0 sq. mi.
Population density: 1,062 people per square mile
(low).
OSM Map
General Map
Google Map
MSN Map
OSM Map
General Map
Google Map
MSN Map
OSM Map
General Map
Google Map
MSN Map
OSM Map
General Map
Google Map
MSN Map
Please wait while loading the map...
Real estate property taxes paid for housing units in 2022:
This zip code:
0.5% ($690)
Virginia:
0.7% ($2,617)
Median real estate property taxes paid for housing units with mortgages in 2022: $820 (0.5%) Median real estate property taxes paid for housing units with no mortgage in 2022: $579 (0.6%)
Business Search- 14 Million verified businesses
Males: 3,491
(47.5%)
Females: 3,862
(52.5%)
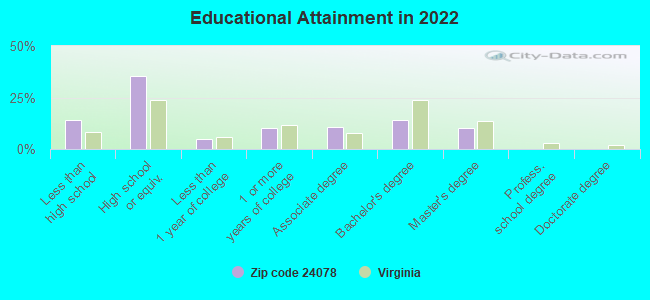
For population 25 years and over in 24078:
High school or higher: 84.9%
Bachelor's degree or higher: 24.2%
Graduate or professional degree: 10.2%
Unemployed: 4.7%
Mean travel time to work (commute): 18.3 minutes
For population 15 years and over in 24078:
Never married: 30.0%
Now married: 43.1%
Separated: 3.3%
Widowed: 7.2%
Divorced: 16.3%
Zip code 24078 compared to state average:
Median household income below state average.
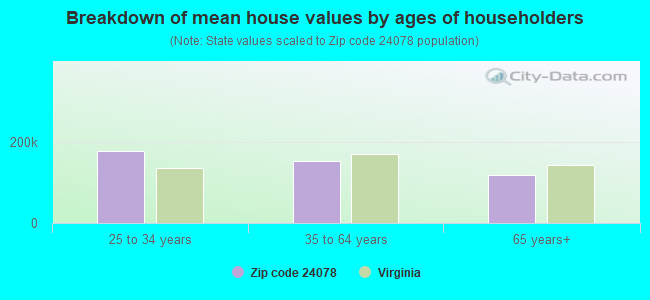
Median house value significantly below state average.
Foreign-born population percentage significantly below state average.
Length of stay since moving in significantly above state average.
Percentage of population with a bachelor's degree or higher below state average.
Estimated median house/condo value in 2022: $128,608
24078:
$128,608
Virginia:
$365,700
According to our research of Virginia and other state lists, there were 12 registered sex offenders living in 24078 zip code as of May 21, 2024. The ratio of all residents to sex offenders in zip code 24078 is 630 to 1. The ratio of registered sex offenders to all residents in this zip code is lower than the state average.
Median resident age:
This zip code:
40.6 years
Virginia median age:
39.0 years
Average household size:
This zip code:
2.5 people
Virginia:
2.5 people
Averages for the 2020 tax year for zip code 24078, filed in 2021:
Average Adjusted Gross Income (AGI) in 2020: $42,420 (Individual Income Tax Returns)
Here:
$42,420
State:
$86,446
Salary/wage: $37,390 (reported on 84.3% of returns)
Here:
$37,390
State:
$71,185
(% of AGI for various income ranges: 1247.0% for AGIs below $25k, 3587.4% for AGIs $25k-50k, 6407.4% for AGIs $50k-75k, 8904.0% for AGIs $75k-100k, 16150.0% for AGIs $100k-200k)
Taxable interest for individuals: $1,158 (reported on 22.8% of returns)
This zip code:
$1,158
Virginia:
$1,805
(% of AGI for various income ranges: 16.8% for AGIs below $25k, 16.8% for AGIs $25k-50k, 48.4% for AGIs $50k-75k, 52.0% for AGIs $75k-100k, 232.1% for AGIs $100k-200k)
Ordinary dividends: $5,084 (reported on 11.7% of returns)
Here:
$5,084
State:
$8,327
(% of AGI for various income ranges: 15.3% for AGIs below $25k, 19.9% for AGIs $25k-50k, 86.8% for AGIs $50k-75k, 98.0% for AGIs $75k-100k, 857.9% for AGIs $100k-200k)
Net capital gain/loss in AGI: +$3,953 (reported on 9.9% of returns)
Here:
+$3,953
State:
+$24,644
(% of AGI for various income ranges: 6.1% for AGIs $25k-50k, 73.5% for AGIs $50k-75k, 117.3% for AGIs $75k-100k, 585.0% for AGIs $100k-200k)
Profit/loss from business: +$6,440 (reported on 9.3% of returns)
Here:
+$6,440
State:
+$12,836
(% of AGI for various income ranges: 46.0% for AGIs below $25k, 66.4% for AGIs $25k-50k, 58.4% for AGIs $50k-75k, 36.0% for AGIs $75k-100k, 495.0% for AGIs $100k-200k)
Taxable individual retirement arrangement distribution: $10,861 (reported on 8.6% of returns)
24078:
$10,861
Virginia:
$21,535
(% of AGI for various income ranges: 54.7% for AGIs below $25k, 72.0% for AGIs $25k-50k, 224.5% for AGIs $50k-75k, 348.0% for AGIs $75k-100k, 490.7% for AGIs $100k-200k)
Total itemized deductions: $24,812 (reported on 2.5% of returns)
Here:
$24,812
State:
$33,287
(% of AGI for various income ranges: 275.2% for AGIs $50k-75k, 808.6% for AGIs $100k-200k)
Charity contributions: $11,186 (reported on 2.2% of returns)
Here:
$11,186
State:
$10,381
(% of AGI for various income ranges: 81.0% for AGIs $50k-75k, 380.0% for AGIs $100k-200k)
Taxes paid: $6,212 (reported on 2.5% of returns)
24078:
$6,212
State:
$8,284
(% of AGI for various income ranges: 47.4% for AGIs $50k-75k, 250.0% for AGIs $100k-200k)
Earned income credit: $2,292 (reported on 22.5% of returns)
Here:
$2,292
State:
$2,214
(% of AGI for various income ranges: 102.2% for AGIs below $25k, 81.2% for AGIs $25k-50k)
Percentage of individuals using paid preparers for their 2020 taxes: 93.2%
Here:
93%
State:
92%
(% for various income ranges: 92.2% for AGIs below $25k, 93.3% for AGIs $25k-50k, 95.3% for AGIs $50k-75k, 95.2% for AGIs $75k-100k, 91.7% for AGIs $100k-200k, 100.0% for AGIs over 200k)
Averages for the 2012 tax year for zip code 24078, filed in 2013:
Average Adjusted Gross Income (AGI) in 2012: $37,349 (Individual Income Tax Returns)
Here:
$37,349
State:
$71,192
Salary/wage: $33,515 (reported on 84.4% of returns)
Here:
$33,515
State:
$59,229
(% of AGI for various income ranges: 78.0% for AGIs below $25k, 78.7% for AGIs $25k-50k, 73.4% for AGIs $50k-75k, 76.9% for AGIs $75k-100k, 76.1% for AGIs $100k-200k, 59.3% for AGIs over 200k)
Taxable interest for individuals: $1,372 (reported on 32.6% of returns)
This zip code:
$1,372
Virginia:
$1,600
(% of AGI for various income ranges: 1.7% for AGIs below $25k, 1.4% for AGIs $25k-50k, 1.3% for AGIs $50k-75k, 0.4% for AGIs $75k-100k, 1.3% for AGIs $100k-200k)
Ordinary dividends: $3,275 (reported on 15.6% of returns)
Here:
$3,275
State:
$6,959
(% of AGI for various income ranges: 0.8% for AGIs below $25k, 1.0% for AGIs $25k-50k, 2.0% for AGIs $50k-75k, 0.8% for AGIs $75k-100k, 2.7% for AGIs $100k-200k)
Net capital gain/loss in AGI: +$3,448 (reported on 9.4% of returns)
Here:
+$3,448
State:
+$16,672
(% of AGI for various income ranges: 5.2% for AGIs $100k-200k)
Profit/loss from business: +$8,506 (reported on 10.1% of returns)
Here:
+$8,506
State:
+$14,116
(% of AGI for various income ranges: 3.4% for AGIs below $25k, 0.6% for AGIs $25k-50k, 1.8% for AGIs $50k-75k, 4.5% for AGIs $75k-100k, 2.9% for AGIs $100k-200k)
Taxable individual retirement arrangement distribution: $8,273 (reported on 12.1% of returns)
24078:
$8,273
Virginia:
$16,667
(% of AGI for various income ranges: 3.2% for AGIs below $25k, 2.3% for AGIs $25k-50k, 3.0% for AGIs $50k-75k, 2.9% for AGIs $75k-100k, 2.9% for AGIs $100k-200k)
Total itemized deductions: $17,634 (23% of AGI, reported on 18.9% of returns)
Here:
$17,634
State:
$26,596
Here:
22.8% of AGI
State:
20.1% of AGI
(% of AGI for various income ranges: 3.5% for AGIs below $25k, 6.8% for AGIs $25k-50k, 9.6% for AGIs $50k-75k, 10.4% for AGIs $75k-100k, 13.2% for AGIs $100k-200k, 16.0% for AGIs over 200k)
Charity contributions: $4,479 (reported on 15.3% of returns)
Here:
$4,479
State:
$4,443
(% of AGI for various income ranges: 0.5% for AGIs below $25k, 1.4% for AGIs $25k-50k, 1.9% for AGIs $50k-75k, 2.3% for AGIs $75k-100k, 4.0% for AGIs $100k-200k)
Taxes paid: $4,605 (reported on 18.9% of returns)
24078:
$4,605
State:
$9,951
(% of AGI for various income ranges: 0.3% for AGIs below $25k, 1.3% for AGIs $25k-50k, 2.0% for AGIs $50k-75k, 2.8% for AGIs $75k-100k, 4.7% for AGIs $100k-200k, 5.4% for AGIs over 200k)
Earned income credit: $2,288 (reported on 25.4% of returns)
Here:
$2,288
State:
$2,211
(% of AGI for various income ranges: 7.0% for AGIs below $25k, 1.0% for AGIs $25k-50k)
Percentage of individuals using paid preparers for their 2012 taxes: 64.8%
Here:
65%
State:
46%
(% for various income ranges: 59.2% for AGIs below $25k, 70.1% for AGIs $25k-50k, 75.0% for AGIs $50k-75k, 68.4% for AGIs $75k-100k, 75.0% for AGIs $100k-200k)
Averages for the 2004 tax year for zip code 24078, filed in 2005:
Average Adjusted Gross Income (AGI) in 2004: $34,029 (Individual Income Tax Returns)
Here:
$34,029
State:
$56,704
Salary/wage: $31,276 (reported on 83.9% of returns)
Here:
$31,276
State:
$48,441
(% of AGI for various income ranges: 107.8% for AGIs below $10k, 77.2% for AGIs $10k-25k, 77.8% for AGIs $25k-50k, 79.4% for AGIs $50k-75k, 79.1% for AGIs $75k-100k, 68.3% for AGIs over 100k)
Taxable interest for individuals: $1,706 (reported on 42.8% of returns)
This zip code:
$1,706
Virginia:
$1,688
(% of AGI for various income ranges: 4.5% for AGIs below $10k, 3.0% for AGIs $10k-25k, 2.3% for AGIs $25k-50k, 1.7% for AGIs $50k-75k, 1.3% for AGIs $75k-100k, 2.0% for AGIs over 100k)
Taxable dividends: $2,546 (reported on 19.4% of returns)
Here:
$2,546
State:
$4,028
(% of AGI for various income ranges: 3.2% for AGIs below $10k, 1.1% for AGIs $10k-25k, 1.2% for AGIs $25k-50k, 0.9% for AGIs $50k-75k, 0.8% for AGIs $75k-100k, 3.0% for AGIs over 100k)
Net capital gain/loss: +$2,258 (reported on 12.6% of returns)
Here:
+$2,258
State:
+$14,375
(% of AGI for various income ranges: -1.9% for AGIs below $10k, 0.1% for AGIs $10k-25k, -0.1% for AGIs $25k-50k, 0.4% for AGIs $50k-75k, 1.0% for AGIs $75k-100k, 3.5% for AGIs over 100k)
Profit/loss from business: +$9,176 (reported on 11.9% of returns)
Here:
+$9,176
State:
+$13,342
(% of AGI for various income ranges: 5.5% for AGIs below $10k, 2.2% for AGIs $10k-25k, 1.9% for AGIs $25k-50k, 2.7% for AGIs $50k-75k, 4.1% for AGIs $75k-100k, 5.6% for AGIs over 100k)
IRA payment deduction: $3,088 (reported on 2.2% of returns)
24078:
$3,088
Virginia:
$2,943
Total itemized deductions: $15,432 (22% of AGI, reported on 21.2% of returns)
Here:
$15,432
State:
$21,492
Here:
21.8% of AGI
State:
21.0% of AGI
(% of AGI for various income ranges: 9.8% for AGIs below $10k, 4.7% for AGIs $10k-25k, 7.6% for AGIs $25k-50k, 11.0% for AGIs $50k-75k, 13.3% for AGIs $75k-100k, 12.5% for AGIs over 100k)
Charity contributions deductions: $3,869 (5% of AGI, reported on 18.7% of returns)
Here:
$3,869
State:
$3,794
Here:
5.3% of AGI
State:
3.5% of AGI
(% of AGI for various income ranges: 0.5% for AGIs below $10k, 0.6% for AGIs $10k-25k, 1.4% for AGIs $25k-50k, 2.5% for AGIs $50k-75k, 3.0% for AGIs $75k-100k, 3.6% for AGIs over 100k)
Total tax: $4,343 (reported on 69.4% of returns)
24078:
$4,343
State:
$9,537
(% of AGI for various income ranges: 2.2% for AGIs below $10k, 3.3% for AGIs $10k-25k, 6.4% for AGIs $25k-50k, 8.5% for AGIs $50k-75k, 10.7% for AGIs $75k-100k, 17.1% for AGIs over 100k)
Earned income credit: $1,748 (reported on 20.8% of returns)
Here:
$1,748
State:
$1,734
Percentage of individuals using paid preparers for their 2004 taxes: 76.3%
Here:
76%
State:
52%
(% for various income ranges: 71.1% for AGIs below $10k, 79.4% for AGIs $10k-25k, 77.3% for AGIs $25k-50k, 74.5% for AGIs $50k-75k, 74.5% for AGIs $75k-100k, 76.4% for AGIs over 100k)
Household received Food Stamps/SNAP in the past 12 months: 755 Household did not receive Food Stamps/SNAP in the past 12 months: 2,318
Women who had a birth in the past 12 months: 73 (14 now married, 55 unmarried) Women who did not have a birth in the past 12 months: 1,889 (735 now married, 1,156 unmarried)
Housing units in zip code 24078 with a mortgage: 1,009 (53 second mortgage, 36 both second mortgage and home equity loan) Median monthly owner costs for units with a mortgage: $946 Median monthly owner costs for units without a mortgage: $335
Residents with income below the poverty level in 2022:
This zip code:
14.2%
Whole state:
10.6%
Residents with income below 50% of the poverty level in 2022:
This zip code:
6.5%
Whole state:
5.2%
Median number of rooms in houses and condos:
Here:
6.3
State:
7.0
Median number of rooms in apartments:
Here:
4.5
State:
4.3
Notable locations in this zip code not listed on our city pages
Size of family households: 811 2-persons, 650 3-persons, 134 4-persons, 45 5-persons, 108 6-persons, 37 7-or-more-persons
Size of nonfamily households: 1,006 1-person, 113 2-persons, 103 3-persons
937 married couples with children.
755 single-parent households (360 men, 395 women).
85.5% of residents of 24078 zip code speak English at home.
11.0% of residents speak Spanish at home (54% very well, 34% well, 12% not well).
1.1% of residents speak other Indo-European language at home (100% very well).
0.3% of residents speak Asian or Pacific Island language at home (100% very well).
1.4% of residents speak other language at home (30% very well, 70% not well).
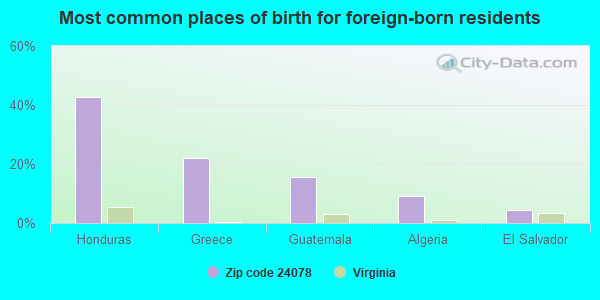
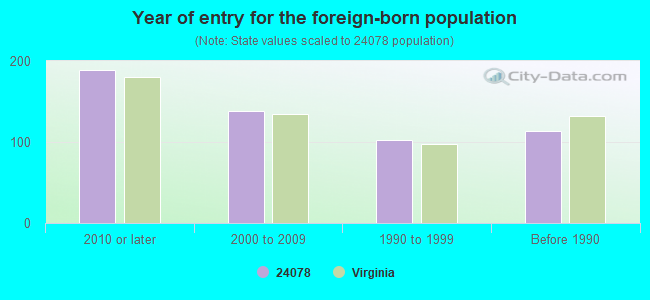
Foreign born population: 335 (4.6%) (60.2% of them are naturalized citizens)
This zip code:
4.6%
Whole state:
12.7%
43%Honduras
22%Greece
16%Guatemala
9%Algeria
4%El Salvador
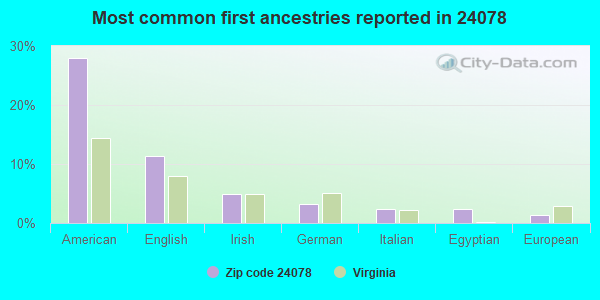
28%American
11%English
5%Irish
3%German
2%Italian
2%Egyptian
1%European
Year of entry for the foreign-born population
1892010 or later
1382000 to 2009
1031990 to 1999
114Before 1990
Facilities with environmental interests located in this zip code:
BREAKING BARRIERS ALTERNATIVE ED/HENRY CO (3300 KINGS MOUNTAIN RD in COLLINSVILLE, VA)
(National Center for Education Statistics) - STATE ID-4230423
CENTER FOR COMMUNITY LRNG (202 CLEVELAND AVE in COLLINSVILLE, VA)
(National Center for Education Statistics) - STATE ID-0440871 Organizations: HENRY COUNTY PUBLIC SCHOOLS (SCHOOL DISTRICT)
National Pollutant Discharge Elimination System NON-MAJOR (Tracking pollutant discharge elimination systems) - permit Business SIC classification: SEWERAGE SYSTEMS Alternative names: HENRY CO. PSA & SEVERN TRENT, HENRY COUNTY PSA - CARVER ESTA, U.S. 220 SOUTH WTP HENRY COUNT
AIR COMFORT COMPANY (P.O. BOX 185 in COLLINSVILLE, VA)
AIR MINOR (AIRS/AFS) Business SIC classification: REFRIGERATION AND AIR-CONDITIONING SERVICE AND REPAIR SHOPS
Housing units lacking complete plumbing facilities: 3.3% Housing units lacking complete kitchen facilities: 0.8%
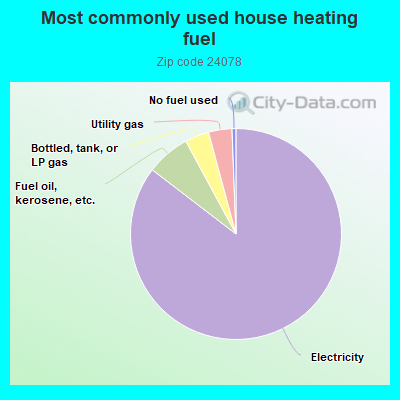
85.5%Electricity
6.7%Fuel oil, kerosene, etc.
3.7%Bottled, tank, or LP gas
3.6%Utility gas
0.6%No fuel used
Population in 1990: 7,668.
Place of birth for U.S.-born residents:
This state: 5,320
Northeast: 220
Midwest: 83
South: 1,039
West: 108
61% of the 24078 zip code residents lived in the same house 5 years ago. Out of people who lived in different houses, 68% lived in this county. Out of people who lived in different counties, 50% lived in Virginia.
96% of the 24078 zip code residents lived in the same house 1 year ago. Out of people who lived in different houses, 70% moved from this county. Out of people who lived in different houses, 34% moved from different county within same state.
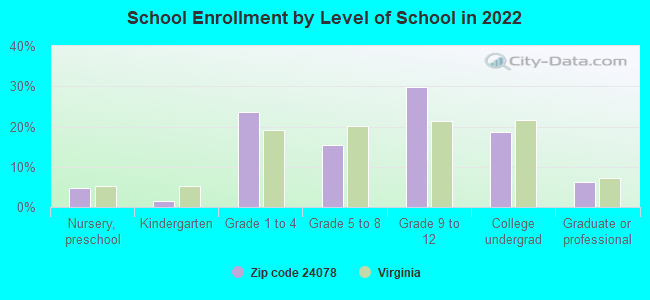
Private vs. public school enrollment:
Students in private schools in grades 1 to 8 (elementary and middle school):
Here:
0.0%
Virginia:
13.2%
Students in private schools in grades 9 to 12 (high school): 35
Here:
5.8%
Virginia:
10.2%
Students in private undergraduate colleges: 145
Here:
38.6%
Virginia:
18.7%
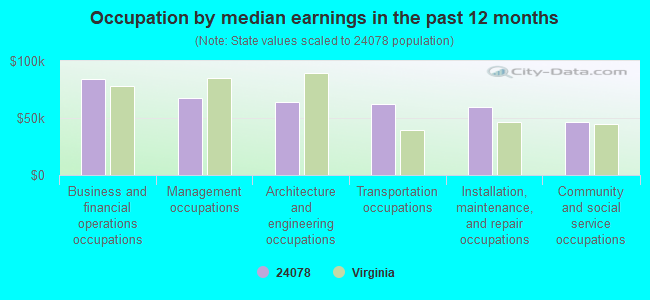
Occupation by median earnings in the past 12 months ($)
83,974Business and financial operations occupations
67,250Management occupations
63,655Architecture and engineering occupations
62,681Transportation occupations
59,594Installation, maintenance, and repair occupations
46,409Community and social service occupations
Top industries in this zip code by the number of employees in 2005:
Administrative and Support and Waste Management and Remediation Services: All Other Business Support Services (500-999 employees: 1 establishment)
Construction: Commercial and Institutional Building Construction (20-49: 1, 1-4: 2)
Accommodation and Food Services: Hotels (except Casino Hotels) and Motels (20-49: 1, 1-4: 1)
People in group quarters in 2000:
4 people in other noninstitutional group quarters
Fatal accident statistics in 2014:
Fatal accident count: 1
Vehicles involved in fatal accidents: 2
Fatal accidents caused by drunken drivers: 0
Fatalities: 1
Persons involved in fatal accidents: 2
Pedestrians involved in fatal accidents: 0
Fatal accident statistics in 2013:
Fatal accident count: 1
Vehicles involved in fatal accidents: 2
Fatal accidents caused by drunken drivers: 1
Fatalities: 1
Persons involved in fatal accidents: 2
Pedestrians involved in fatal accidents: 0
2002 - 2018 National Fire Incident Reporting System (NFIRS) incidents
According to the data from the years 2002 - 2018 the average number of fires per year is 33. The highest number of fire incidents - 51 took place in 2007, and the least - 12 in 2016. The data has an increasing trend.
When looking into fire subcategories, the most reports belonged to: Outside Fires (41.8%), and Structure Fires (38.5%).
Fire incident types reported to NFIRS in Zip Code 24078


 Nearest zip codes: 24168, 24112, 24089, 24055, 24148, 24102.


 According to the data from the years 2002 - 2018 the average number of fires per year is 33. The highest number of fire incidents - 51 took place in 2007, and the least - 12 in 2016. The data has an increasing trend.
 When looking into fire subcategories, the most reports belonged to: Outside Fires (41.8%), and Structure Fires (38.5%).