Estimated zip code population in 2022: 1,501 Zip code population in 2010: 1,697 Zip code population in 2000: 1,818
Houses and condos: 959 Renter-occupied apartments: 68
% of renters here:
11%
State:
33%
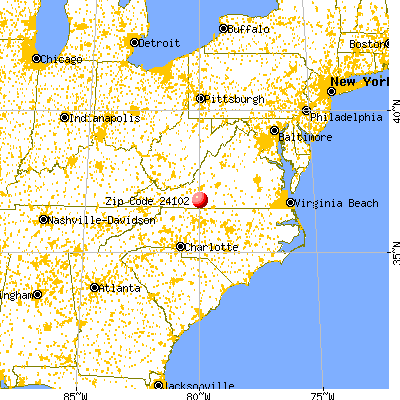
March 2022 cost of living index in zip code 24102: 82.9 (low, U.S. average is 100)
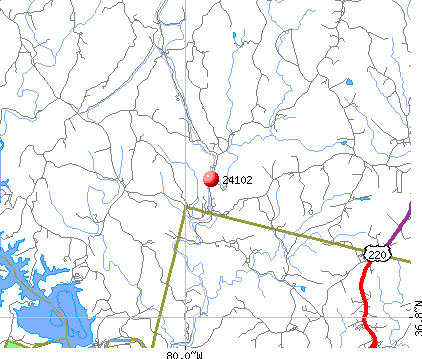
Land area: 32.1 sq. mi. Water area: 1.4 sq. mi.
Population density: 47 people per square mile
(very low).
OSM Map
General Map
Google Map
MSN Map
OSM Map
General Map
Google Map
MSN Map
OSM Map
General Map
Google Map
MSN Map
OSM Map
General Map
Google Map
MSN Map
Please wait while loading the map...
Real estate property taxes paid for housing units in 2022:
This zip code:
0.5% ($874)
Virginia:
0.7% ($2,617)
Median real estate property taxes paid for housing units with mortgages in 2022: $807 (0.5%) Median real estate property taxes paid for housing units with no mortgage in 2022: $948 (0.6%)
Business Search- 14 Million verified businesses
Males: 657
(43.8%)
Females: 843
(56.2%)
For population 25 years and over in 24102:
High school or higher: 90.5%
Bachelor's degree or higher: 33.7%
Graduate or professional degree: 6.6%
Unemployed: 5.2%
Mean travel time to work (commute): 28.8 minutes
For population 15 years and over in 24102:
Never married: 23.9%
Now married: 45.1%
Separated: 2.5%
Widowed: 15.5%
Divorced: 13.0%
Zip code 24102 compared to state average:
Median household income below state average.
Median house value significantly below state average.
Black race population percentage significantly below state average.
Hispanic race population percentage significantly below state average.
Median age above state average.
Foreign-born population percentage significantly below state average.
Renting percentage significantly below state average.
Averages for the 2020 tax year for zip code 24102, filed in 2021:
Average Adjusted Gross Income (AGI) in 2020: $43,766 (Individual Income Tax Returns)
Here:
$43,766
State:
$86,446
Salary/wage: $39,104 (reported on 84.4% of returns)
Here:
$39,104
State:
$71,185
(% of AGI for various income ranges: 1271.1% for AGIs below $25k, 3405.9% for AGIs $25k-50k, 5991.7% for AGIs $50k-75k, 7664.0% for AGIs $75k-100k, 18703.3% for AGIs $100k-200k)
Taxable interest for individuals: $785 (reported on 20.3% of returns)
This zip code:
$785
Virginia:
$1,805
(% of AGI for various income ranges: 7.8% for AGIs below $25k, 30.6% for AGIs $25k-50k, 20.0% for AGIs $50k-75k, 48.0% for AGIs $75k-100k)
Ordinary dividends: $1,262 (reported on 12.5% of returns)
Here:
$1,262
State:
$8,327
(% of AGI for various income ranges: 16.1% for AGIs below $25k, 30.6% for AGIs $25k-50k, 40.0% for AGIs $75k-100k)
Net capital gain/loss in AGI: +$117 (reported on 9.4% of returns)
Here:
+$117
State:
+$24,644
(% of AGI for various income ranges: 3.9% for AGIs below $25k)
Profit/loss from business: +$5,788 (reported on 12.5% of returns)
Here:
+$5,788
State:
+$12,836
(% of AGI for various income ranges: 99.4% for AGIs below $25k, 88.2% for AGIs $25k-50k, 223.3% for AGIs $50k-75k)
Taxable individual retirement arrangement distribution: $9,700 (reported on 6.2% of returns)
24102:
$9,700
Virginia:
$21,535
(% of AGI for various income ranges: 228.2% for AGIs $25k-50k)
Earned income credit: $2,271 (reported on 21.9% of returns)
Here:
$2,271
State:
$2,214
(% of AGI for various income ranges: 95.6% for AGIs below $25k, 85.9% for AGIs $25k-50k)
Percentage of individuals using paid preparers for their 2020 taxes: 98.4%
Here:
98%
State:
92%
(% for various income ranges: 95.8% for AGIs below $25k, 100.0% for AGIs $25k-50k, 100.0% for AGIs $50k-75k, 100.0% for AGIs $75k-100k, 100.0% for AGIs $100k-200k)
Averages for the 2012 tax year for zip code 24102, filed in 2013:
Average Adjusted Gross Income (AGI) in 2012: $35,289 (Individual Income Tax Returns)
Here:
$35,289
State:
$71,192
Salary/wage: $31,578 (reported on 79.4% of returns)
Here:
$31,578
State:
$59,229
(% of AGI for various income ranges: 72.5% for AGIs below $25k, 81.4% for AGIs $25k-50k, 72.4% for AGIs $50k-75k, 128.8% for AGIs $75k-100k)
Taxable interest for individuals: $844 (reported on 25.4% of returns)
This zip code:
$844
Virginia:
$1,600
(% of AGI for various income ranges: 0.9% for AGIs below $25k, 0.4% for AGIs $25k-50k, 0.9% for AGIs $50k-75k, 0.8% for AGIs $75k-100k)
Ordinary dividends: $912 (reported on 12.7% of returns)
Here:
$912
State:
$6,959
Profit/loss from business: +$13,683 (reported on 19.0% of returns)
Here:
+$13,683
State:
+$14,116
(% of AGI for various income ranges: 9.3% for AGIs below $25k, 3.3% for AGIs $25k-50k, 21.9% for AGIs $50k-75k)
Taxable individual retirement arrangement distribution: $8,720 (reported on 7.9% of returns)
24102:
$8,720
Virginia:
$16,667
Total itemized deductions: $17,936 (24% of AGI, reported on 17.5% of returns)
Here:
$17,936
State:
$26,596
Here:
23.9% of AGI
State:
20.1% of AGI
(% of AGI for various income ranges: 8.0% for AGIs $25k-50k, 9.6% for AGIs $50k-75k, 30.0% for AGIs $75k-100k)
Charity contributions: $4,529 (reported on 11.1% of returns)
Here:
$4,529
State:
$4,443
(% of AGI for various income ranges: 1.5% for AGIs below $25k, 1.6% for AGIs $50k-75k, 5.7% for AGIs $75k-100k)
Taxes paid: $5,073 (reported on 17.5% of returns)
24102:
$5,073
State:
$9,951
(% of AGI for various income ranges: 1.3% for AGIs $25k-50k, 2.5% for AGIs $50k-75k, 10.8% for AGIs $75k-100k)
Earned income credit: $2,081 (reported on 25.4% of returns)
Here:
$2,081
State:
$2,211
(% of AGI for various income ranges: 6.5% for AGIs below $25k, 1.4% for AGIs $25k-50k)
Percentage of individuals using paid preparers for their 2012 taxes: 73.0%
Here:
73%
State:
46%
(% for various income ranges: 66.7% for AGIs below $25k, 78.9% for AGIs $25k-50k, 75.0% for AGIs $50k-75k, 125.0% for AGIs $75k-100k)
Averages for the 2004 tax year for zip code 24102, filed in 2005:
Average Adjusted Gross Income (AGI) in 2004: $32,059 (Individual Income Tax Returns)
Here:
$32,059
State:
$56,704
Salary/wage: $29,505 (reported on 85.1% of returns)
Here:
$29,505
State:
$48,441
(% of AGI for various income ranges: 90.9% for AGIs below $10k, 75.4% for AGIs $10k-25k, 81.5% for AGIs $25k-50k, 75.1% for AGIs $50k-75k, 82.9% for AGIs $75k-100k, 72.6% for AGIs over 100k)
Taxable interest for individuals: $912 (reported on 41.3% of returns)
This zip code:
$912
Virginia:
$1,688
(% of AGI for various income ranges: 1.4% for AGIs below $10k, 1.0% for AGIs $10k-25k, 1.3% for AGIs $25k-50k, 1.3% for AGIs $50k-75k, 1.7% for AGIs $75k-100k)
Taxable dividends: $640 (reported on 14.1% of returns)
Here:
$640
State:
$4,028
(% of AGI for various income ranges: 0.2% for AGIs $10k-25k, 0.3% for AGIs $25k-50k, 0.4% for AGIs $50k-75k, 0.4% for AGIs $75k-100k)
Profit/loss from business: +$10,083 (reported on 15.3% of returns)
Here:
+$10,083
State:
+$13,342
(% of AGI for various income ranges: 16.2% for AGIs below $10k, 7.3% for AGIs $10k-25k, 6.3% for AGIs $25k-50k, 4.1% for AGIs $50k-75k)
IRA payment deduction: $3,294 (reported on 2.7% of returns)
24102:
$3,294
Virginia:
$2,943
Total itemized deductions: $14,777 (26% of AGI, reported on 19.2% of returns)
Here:
$14,777
State:
$21,492
Here:
25.6% of AGI
State:
21.0% of AGI
(% of AGI for various income ranges: 9.0% for AGIs $10k-25k, 6.0% for AGIs $25k-50k, 9.9% for AGIs $50k-75k, 10.8% for AGIs $75k-100k, 15.1% for AGIs over 100k)
Charity contributions deductions: $3,701 (6% of AGI, reported on 15.4% of returns)
Here:
$3,701
State:
$3,794
Here:
5.9% of AGI
State:
3.5% of AGI
(% of AGI for various income ranges: 0.8% for AGIs $10k-25k, 1.1% for AGIs $25k-50k, 1.8% for AGIs $50k-75k, 2.4% for AGIs $75k-100k, 5.2% for AGIs over 100k)
Total tax: $3,549 (reported on 75.0% of returns)
24102:
$3,549
State:
$9,537
(% of AGI for various income ranges: 4.4% for AGIs below $10k, 4.4% for AGIs $10k-25k, 6.5% for AGIs $25k-50k, 9.2% for AGIs $50k-75k, 11.7% for AGIs $75k-100k, 15.8% for AGIs over 100k)
Earned income credit: $1,699 (reported on 22.7% of returns)
Here:
$1,699
State:
$1,734
Percentage of individuals using paid preparers for their 2004 taxes: 81.7%
Here:
82%
State:
52%
(% for various income ranges: 79.5% for AGIs below $10k, 79.5% for AGIs $10k-25k, 86.4% for AGIs $25k-50k, 78.2% for AGIs $50k-75k, 92.6% for AGIs $75k-100k, 71.4% for AGIs over 100k)
Household received Food Stamps/SNAP in the past 12 months: 101 Household did not receive Food Stamps/SNAP in the past 12 months: 535
Women who did not have a birth in the past 12 months: 335 (143 now married, 192 unmarried)
Housing units in zip code 24102 with a mortgage: 188 (27 second mortgage, 13 both second mortgage and home equity loan) Median monthly owner costs for units with a mortgage: $1,084 Median monthly owner costs for units without a mortgage: $317
Residents with income below the poverty level in 2022:
This zip code:
6.0%
Whole state:
10.6%
Residents with income below 50% of the poverty level in 2022:
This zip code:
4.2%
Whole state:
5.2%
Median number of rooms in houses and condos:
Here:
6.3
State:
7.0
Median number of rooms in apartments:
Here:
4.8
State:
4.3
Notable locations in this zip code not listed on our city pages
Notable locations in zip code 24102: Twin Ridge Marina (A), Salthouse Branch Campsite (B), Jamison Mill Park Campsite (C). Display/hide their locations on the map
Churches in zip code 24102 include: Providence Church (A), Canton Creek Church (B), Town Creek Church (C), Knob Church (D), Union Chapel (E), Mill Creek Missionary Baptist Church (F), Kittson Memorial Church (G). Display/hide their locations on the map
Cemeteries: Thornton Cemetery (1), Wray Cemetery (2), Williams Cemetery (3), Thomas Cemetery (4), Stone-Bondurant-Johnson Cemetery (5), Stanley Cemetery (6), Ratcliff-Whitlow-Young Cemetery (7). Display/hide their locations on the map
Streams, rivers, and creeks: Salthouse Branch (A), Ryans Branch (B), Roland Branch (C), Osley Branch (D), Nicholas Creek (E), Cooper Creek (F), Beards Creek (G). Display/hide their locations on the map
Parks in zip code 24102 include: Twin Ridge Recreation Area (1), Salthouse Branch Recreation Area (2), Spring Cove Park Recreation Area (3), Deer Island Recreation Area (4), Horseshoe Point Recreation Area (5), Jamison Mill Recreation Area (6). Display/hide their locations on the map
In group quarters: 2 (-1 institutionalized population)
Size of family households: 99 2-persons, 115 3-persons, 63 4-persons, 9 5-persons, 24 7-or-more-persons
Size of nonfamily households: 304 1-person, 14 2-persons
75 married couples with children.
152 single-parent households (138 men, 14 women).
96.4% of residents of 24102 zip code speak English at home.
2.6% of residents speak Spanish at home (100% very well).
1.7% of residents speak other Indo-European language at home (100% very well).
Foreign born population: 26 (1.8%) (100.0% of them are naturalized citizens)
This zip code:
1.8%
Whole state:
12.7%
92%Bosnia and Herzegovina
71%American
5%English
4%European
4%British
2%Scotch-Irish
Year of entry for the foreign-born population
02010 or later
02000 to 2009
231990 to 1999
8Before 1990
Facilities with environmental interests located in this zip code:
BLUE RIDGE SOLVENTS AND COATINGS INCORPORATED (3800 ORIGINAL HENRY ROAD in HENRY, VA)
AIR SYNTHETIC MINOR (AIRS/AFS) STATE MASTER (Virginia pollutants databases) - CEDS-30229, AIR PROGRAM CRITERIA AND HAZARDOUS AIR POLLUTANT INVENTORY (Inventory of air pollution sources) HAZARDOUS WASTE BIENNIAL REPORTER (Resource Conservation and Recovery Act (tracking hazardous waste)) TSD (Resource Conservation and Recovery Act (tracking hazardous waste)) Large Quantity Generators, more that 1000 kg of hazardous waste/month (Resource Conservation and Recovery Act (tracking hazardous waste)) TRANSPORTER (Resource Conservation and Recovery Act (tracking hazardous waste)) TRI REPORTER (Tracking of toxic chemicals releasing facilities) Business SIC classification: PAINTS, VARNISHES, LACQUERS, ENAMELS, AND ALLIED PRODUCTS; CHEMICALS AND ALLIED PRODUCTS Business NAICS classification: INORGANIC DYE AND PIGMENT MANUFACTURING.; PAINT AND COATING MANUFACTURING. Organizations: BLUE RIDGE SOLVENTS & COATINGS (CONTACT/OPERATOR)
, BLUE RIDGE SOLVENTS AND COATINGS INC. (CONTACT/OPERATOR)
, BLUE RIDGE TALC CO. INC (CONTACT/OWNER)
, BLUE RIDGE SOLVENTS & COATINGS (CONTACT/OWNER)
, BLUE RIDGE TALC COMPANY, INC. (CONTACT/OWNER)
Alternative names: BLUE RIDGE TALC CO INC, BLUERIDGE SOLVENTS & COATINGS
ALTA KITSON FARM (RT 606 & RT 605 in HENRY, VA)
TSD (Resource Conservation and Recovery Act (tracking hazardous waste))
Housing units lacking complete plumbing facilities: 14.3% Housing units lacking complete kitchen facilities: 16.4%
65.5%Electricity
15.5%Fuel oil, kerosene, etc.
11.6%Bottled, tank, or LP gas
7.7%Wood
Population in 1990: 1,393. Population change in the 1990s: +425 (+30.5%).
Place of birth for U.S.-born residents:
This state: 989
Northeast: 132
Midwest: 40
South: 288
West: 8
75% of the 24102 zip code residents lived in the same house 5 years ago. Out of people who lived in different houses, 43% lived in this county. Out of people who lived in different counties, 50% lived in Virginia.
96% of the 24102 zip code residents lived in the same house 1 year ago. Out of people who lived in different houses, 98% moved from this county.
Private vs. public school enrollment:
Students in private schools in grades 1 to 8 (elementary and middle school):
Here:
0.0%
Virginia:
13.2%
Students in private schools in grades 9 to 12 (high school): 29
Here:
76.1%
Virginia:
10.2%
Students in private undergraduate colleges:
Here:
0.0%
Virginia:
18.7%
Occupation by median earnings in the past 12 months ($)
242,893Sales and related occupations
65,182Business and financial operations occupations
53,676Office and administrative support occupations
45,102Health technologists and technicians
Companies with federal contracts located in this zip code:
FRANKLIN D EDWARDS (178 SALTHOUSE BRANCH RD in HENRY, VA; small business) : $62,650 in 11 contractsfrom 2004 to 2006
Contracts for Guard Services by Army, U.S. Army Corps of Engineers - civil program financing only Signed by year:2000: $0; 2001: $0; 2002: $0; 2003: $0; 2004: $49,930; 2005: $840; 2006: $11,880.
Biggest contracts:
$11,880 with Army for Guard Services. Signed on 2006-02-22. Completion date: 2006-10-31.
$11,340, same as above.Signed on 2004-12-15. Completion date: 2005-10-31.
$11,340 with U.S. Army Corps of Engineers - civil program financing only for Guard Services. Signed on 2004-12-15. Completion date: 2005-10-31.
$10,900 with Army for Guard Services. Signed on 2004-02-09. Completion date: 2003-11-06.
Top industries in this zip code by the number of employees in 2005:
Construction: New Single-Family Housing Construction (except Operative Builders) (5-9 employees: 1 establishment, 1-4 employees: 2 establishments)
Construction: Site Preparation Contractors (5-9: 1, 1-4: 1)
Accommodation and Food Services: Full-Service Restaurants (1-4: 2)
Health Care and Social Assistance: Homes for the Elderly (1-4: 1)
Other Services (except Public Administration): Religious Organizations (1-4: 1)
Construction: Other Foundation, Structure, and Building Exterior Contractors (1-4: 1)
People in group quarters in 2000:
7 people in nursing homes
Fatal accident statistics in 2014:
Fatal accident count: 1
Vehicles involved in fatal accidents: 1
Fatal accidents caused by drunken drivers: 1
Fatalities: 1
Persons involved in fatal accidents: 1
Pedestrians involved in fatal accidents: 0
Fatal accident statistics in 2011:
Fatal accident count: 2
Vehicles involved in fatal accidents: 2
Fatal accidents caused by drunken drivers: 2
Fatalities: 2
Persons involved in fatal accidents: 8
Pedestrians involved in fatal accidents: 0
Home Mortgage Disclosure Act Aggregated Statistics For Year 2009 (Based on 4 partial tracts)
A) FHA, FSA/RHS & VA Home Purchase Loans
B) Conventional Home Purchase Loans
C) Refinancings
D) Home Improvement Loans
F) Non-occupant Loans on < 5 Family Dwellings (A B C & D)
G) Loans On Manufactured Home Dwelling (A B C & D)
Number
Average Value
Number
Average Value
Number
Average Value
Number
Average Value
Number
Average Value
Number
Average Value
LOANS ORIGINATED
7
$137,796
11
$100,135
48
$141,618
8
$62,202
5
$138,750
10
$94,775
APPLICATIONS APPROVED, NOT ACCEPTED
0
$0
1
$86,220
4
$96,545
1
$39,040
0
$0
0
$0
APPLICATIONS DENIED
3
$116,030
2
$101,495
25
$126,427
4
$62,625
1
$251,320
6
$72,102
APPLICATIONS WITHDRAWN
0
$0
2
$72,565
15
$132,393
0
$0
1
$310,580
2
$79,260
FILES CLOSED FOR INCOMPLETENESS
1
$156,930
1
$223,250
4
$168,738
0
$0
1
$158,310
2
$100,455
Aggregated Statistics For Year 2008 (Based on 4 partial tracts)
A) FHA, FSA/RHS & VA Home Purchase Loans
B) Conventional Home Purchase Loans
C) Refinancings
D) Home Improvement Loans
F) Non-occupant Loans on < 5 Family Dwellings (A B C & D)
G) Loans On Manufactured Home Dwelling (A B C & D)
Number
Average Value
Number
Average Value
Number
Average Value
Number
Average Value
Number
Average Value
Number
Average Value
LOANS ORIGINATED
8
$114,361
17
$101,693
42
$125,671
10
$61,692
5
$95,096
14
$85,309
APPLICATIONS APPROVED, NOT ACCEPTED
0
$0
2
$74,345
4
$188,672
1
$22,350
0
$0
1
$102,160
APPLICATIONS DENIED
2
$122,215
4
$63,610
36
$122,279
7
$49,913
2
$108,185
11
$71,872
APPLICATIONS WITHDRAWN
2
$75,145
1
$132,300
13
$139,646
0
$0
1
$342,150
1
$61,240
FILES CLOSED FOR INCOMPLETENESS
0
$0
2
$110,595
3
$136,233
1
$34,770
0
$0
1
$98,110
Aggregated Statistics For Year 2007 (Based on 4 partial tracts)
A) FHA, FSA/RHS & VA Home Purchase Loans
B) Conventional Home Purchase Loans
C) Refinancings
D) Home Improvement Loans
F) Non-occupant Loans on < 5 Family Dwellings (A B C & D)
G) Loans On Manufactured Home Dwelling (A B C & D)
Number
Average Value
Number
Average Value
Number
Average Value
Number
Average Value
Number
Average Value
Number
Average Value
LOANS ORIGINATED
3
$145,790
27
$112,527
50
$121,412
11
$49,606
10
$123,087
16
$85,994
APPLICATIONS APPROVED, NOT ACCEPTED
0
$0
3
$270,097
11
$116,609
2
$64,870
1
$287,450
2
$111,490
APPLICATIONS DENIED
1
$150,740
9
$115,511
41
$117,787
9
$57,404
2
$103,860
10
$75,731
APPLICATIONS WITHDRAWN
0
$0
3
$58,513
23
$128,783
5
$33,548
1
$131,750
3
$107,817
FILES CLOSED FOR INCOMPLETENESS
0
$0
2
$143,285
5
$161,878
0
$0
0
$0
0
$0
Aggregated Statistics For Year 2006 (Based on 4 partial tracts)
A) FHA, FSA/RHS & VA Home Purchase Loans
B) Conventional Home Purchase Loans
C) Refinancings
D) Home Improvement Loans
E) Loans on Dwellings For 5+ Families
F) Non-occupant Loans on < 5 Family Dwellings (A B C & D)
G) Loans On Manufactured Home Dwelling (A B C & D)
Number
Average Value
Number
Average Value
Number
Average Value
Number
Average Value
Number
Average Value
Number
Average Value
Number
Average Value
LOANS ORIGINATED
8
$117,435
37
$97,913
76
$86,676
15
$39,091
1
$386,790
12
$103,329
21
$78,159
APPLICATIONS APPROVED, NOT ACCEPTED
1
$114,220
5
$67,042
8
$122,735
2
$52,515
0
$0
1
$167,940
5
$72,750
APPLICATIONS DENIED
2
$111,310
16
$99,474
51
$93,335
16
$41,507
0
$0
8
$122,085
19
$60,861
APPLICATIONS WITHDRAWN
0
$0
6
$90,512
25
$113,408
4
$71,398
0
$0
2
$85,350
2
$83,485
FILES CLOSED FOR INCOMPLETENESS
0
$0
1
$294,950
6
$97,692
0
$0
0
$0
0
$0
0
$0
Aggregated Statistics For Year 2005 (Based on 4 partial tracts)
A) FHA, FSA/RHS & VA Home Purchase Loans
B) Conventional Home Purchase Loans
C) Refinancings
D) Home Improvement Loans
F) Non-occupant Loans on < 5 Family Dwellings (A B C & D)
G) Loans On Manufactured Home Dwelling (A B C & D)
Number
Average Value
Number
Average Value
Number
Average Value
Number
Average Value
Number
Average Value
Number
Average Value
LOANS ORIGINATED
5
$110,332
22
$105,012
62
$98,574
12
$47,788
7
$103,394
9
$72,216
APPLICATIONS APPROVED, NOT ACCEPTED
1
$57,940
5
$72,718
10
$88,086
1
$29,320
0
$0
5
$49,984
APPLICATIONS DENIED
1
$101,730
11
$74,784
53
$90,761
8
$24,648
4
$78,672
13
$58,163
APPLICATIONS WITHDRAWN
1
$79,830
3
$93,450
34
$104,611
4
$92,662
1
$171,020
4
$80,005
FILES CLOSED FOR INCOMPLETENESS
0
$0
1
$70,540
6
$111,710
0
$0
0
$0
0
$0
Aggregated Statistics For Year 2004 (Based on 4 partial tracts)
A) FHA, FSA/RHS & VA Home Purchase Loans
B) Conventional Home Purchase Loans
C) Refinancings
D) Home Improvement Loans
F) Non-occupant Loans on < 5 Family Dwellings (A B C & D)
G) Loans On Manufactured Home Dwelling (A B C & D)
Detailed PMIC statistics for the following Tracts:0206.00
, 0207.00
2002 - 2018 National Fire Incident Reporting System (NFIRS) incidents
Based on the data from the years 2002 - 2018 the average number of fire incidents per year is 8. The highest number of reported fire incidents - 22 took place in 2010, and the least - 0 in 2017. The data has a declining trend.
When looking into fire subcategories, the most incidents belonged to: Structure Fires (46.4%), and Outside Fires (37.7%).
Fire incident types reported to NFIRS in Zip Code 24102


 Nearest zip codes: 24055, 24088, 24168, 24089, 24078, 24151.


 Based on the data from the years 2002 - 2018 the average number of fire incidents per year is 8. The highest number of reported fire incidents - 22 took place in 2010, and the least - 0 in 2017. The data has a declining trend.
 When looking into fire subcategories, the most incidents belonged to: Structure Fires (46.4%), and Outside Fires (37.7%).