Estimated median house/condo value in 2022: $198,132
24079:
$198,132
Virginia:
$365,700
According to our research of Virginia and other state lists, there were 6 registered sex offenders living in 24079 zip code as of May 28, 2024. The ratio of all residents to sex offenders in zip code 24079 is 312 to 1. The ratio of registered sex offenders to all residents in this zip code is near the state average.
Median resident age:
This zip code:
46.9 years
Virginia median age:
39.0 years
Average household size:
This zip code:
2.5 people
Virginia:
2.5 people
Averages for the 2020 tax year for zip code 24079, filed in 2021:
Average Adjusted Gross Income (AGI) in 2020: $51,266 (Individual Income Tax Returns)
Here:
$51,266
State:
$86,446
Salary/wage: $45,431 (reported on 76.2% of returns)
Here:
$45,431
State:
$71,185
(% of AGI for various income ranges: 1050.0% for AGIs below $25k, 3536.9% for AGIs $25k-50k, 6331.2% for AGIs $50k-75k, 7672.0% for AGIs $75k-100k, 15790.0% for AGIs $100k-200k)
Taxable interest for individuals: $859 (reported on 27.5% of returns)
This zip code:
$859
Virginia:
$1,805
(% of AGI for various income ranges: 37.0% for AGIs below $25k, 29.4% for AGIs $25k-50k, 31.2% for AGIs $50k-75k, 34.0% for AGIs $75k-100k, 37.1% for AGIs $100k-200k)
Ordinary dividends: $2,712 (reported on 20.0% of returns)
Here:
$2,712
State:
$8,327
(% of AGI for various income ranges: 36.0% for AGIs below $25k, 51.2% for AGIs $25k-50k, 68.8% for AGIs $50k-75k, 321.4% for AGIs $100k-200k)
Net capital gain/loss in AGI: +$7,107 (reported on 17.5% of returns)
Here:
+$7,107
State:
+$24,644
(% of AGI for various income ranges: 30.0% for AGIs below $25k, 78.1% for AGIs $25k-50k, 296.2% for AGIs $50k-75k, 818.6% for AGIs $100k-200k)
Profit/loss from business: +$5,600 (reported on 12.5% of returns)
Here:
+$5,600
State:
+$12,836
(% of AGI for various income ranges: 77.0% for AGIs below $25k, 224.4% for AGIs $25k-50k, 94.0% for AGIs $75k-100k)
Taxable individual retirement arrangement distribution: $14,644 (reported on 11.2% of returns)
24079:
$14,644
Virginia:
$21,535
(% of AGI for various income ranges: 68.5% for AGIs below $25k, 341.2% for AGIs $25k-50k, 907.1% for AGIs $100k-200k)
Total itemized deductions: $28,600 (reported on 3.8% of returns)
Here:
$28,600
State:
$33,287
(% of AGI for various income ranges: 1716.0% for AGIs $75k-100k)
Charity contributions: $9,500 (reported on 2.5% of returns)
Here:
$9,500
State:
$10,381
(% of AGI for various income ranges: 237.5% for AGIs $50k-75k)
Taxes paid: $6,433 (reported on 3.8% of returns)
24079:
$6,433
State:
$8,284
(% of AGI for various income ranges: 386.0% for AGIs $75k-100k)
Earned income credit: $1,983 (reported on 15.0% of returns)
Here:
$1,983
State:
$2,214
(% of AGI for various income ranges: 88.0% for AGIs below $25k, 38.8% for AGIs $25k-50k)
Percentage of individuals using paid preparers for their 2020 taxes: 93.8%
Here:
94%
State:
92%
(% for various income ranges: 93.1% for AGIs below $25k, 95.2% for AGIs $25k-50k, 100.0% for AGIs $50k-75k, 85.7% for AGIs $75k-100k, 91.7% for AGIs $100k-200k)
Averages for the 2012 tax year for zip code 24079, filed in 2013:
Average Adjusted Gross Income (AGI) in 2012: $45,116 (Individual Income Tax Returns)
Here:
$45,116
State:
$71,192
Salary/wage: $39,128 (reported on 83.6% of returns)
Here:
$39,128
State:
$59,229
(% of AGI for various income ranges: 70.5% for AGIs below $25k, 79.1% for AGIs $25k-50k, 83.8% for AGIs $50k-75k, 76.6% for AGIs $75k-100k, 55.9% for AGIs $100k-200k)
Taxable interest for individuals: $1,308 (reported on 34.2% of returns)
This zip code:
$1,308
Virginia:
$1,600
(% of AGI for various income ranges: 2.4% for AGIs below $25k, 1.8% for AGIs $25k-50k, 0.4% for AGIs $50k-75k, 0.8% for AGIs $75k-100k, 0.4% for AGIs $100k-200k)
Ordinary dividends: $3,400 (reported on 16.4% of returns)
Here:
$3,400
State:
$6,959
(% of AGI for various income ranges: 1.2% for AGIs below $25k, 0.6% for AGIs $25k-50k, 0.2% for AGIs $50k-75k, 1.5% for AGIs $75k-100k, 2.5% for AGIs $100k-200k)
Net capital gain/loss in AGI: +$5,064 (reported on 15.1% of returns)
Here:
+$5,064
State:
+$16,672
(% of AGI for various income ranges: 0.6% for AGIs below $25k, 2.7% for AGIs $50k-75k, 3.7% for AGIs $100k-200k)
Profit/loss from business: +$4,331 (reported on 17.8% of returns)
Here:
+$4,331
State:
+$14,116
(% of AGI for various income ranges: 8.5% for AGIs below $25k, 2.5% for AGIs $25k-50k, 0.8% for AGIs $50k-75k)
Taxable individual retirement arrangement distribution: $11,140 (reported on 13.7% of returns)
24079:
$11,140
Virginia:
$16,667
(% of AGI for various income ranges: 4.4% for AGIs below $25k, 7.9% for AGIs $25k-50k, 7.1% for AGIs $75k-100k)
Total itemized deductions: $17,856 (20% of AGI, reported on 21.9% of returns)
Here:
$17,856
State:
$26,596
Here:
20.4% of AGI
State:
20.1% of AGI
(% of AGI for various income ranges: 8.2% for AGIs $25k-50k, 8.3% for AGIs $50k-75k, 9.4% for AGIs $75k-100k, 12.6% for AGIs $100k-200k)
Charity contributions: $3,633 (reported on 16.4% of returns)
Here:
$3,633
State:
$4,443
(% of AGI for various income ranges: 2.3% for AGIs below $25k, 1.0% for AGIs $50k-75k, 1.2% for AGIs $75k-100k, 2.3% for AGIs $100k-200k)
Taxes paid: $5,656 (reported on 21.9% of returns)
24079:
$5,656
State:
$9,951
(% of AGI for various income ranges: 1.4% for AGIs $25k-50k, 2.3% for AGIs $50k-75k, 3.1% for AGIs $75k-100k, 5.1% for AGIs $100k-200k)
Earned income credit: $2,236 (reported on 19.2% of returns)
Here:
$2,236
State:
$2,211
(% of AGI for various income ranges: 6.0% for AGIs below $25k, 1.2% for AGIs $25k-50k)
Percentage of individuals using paid preparers for their 2012 taxes: 56.2%
Here:
56%
State:
46%
(% for various income ranges: 44.8% for AGIs below $25k, 63.2% for AGIs $25k-50k, 66.7% for AGIs $50k-75k, 57.1% for AGIs $75k-100k, 66.7% for AGIs $100k-200k)
Averages for the 2004 tax year for zip code 24079, filed in 2005:
Average Adjusted Gross Income (AGI) in 2004: $44,327 (Individual Income Tax Returns)
Here:
$44,327
State:
$56,704
Salary/wage: $37,197 (reported on 88.4% of returns)
Here:
$37,197
State:
$48,441
(% of AGI for various income ranges: 76.3% for AGIs $10k-25k, 82.0% for AGIs $25k-50k, 85.3% for AGIs $50k-75k, 78.0% for AGIs $75k-100k, 39.3% for AGIs over 100k)
Taxable interest for individuals: $1,266 (reported on 46.0% of returns)
This zip code:
$1,266
Virginia:
$1,688
(% of AGI for various income ranges: 3.6% for AGIs $10k-25k, 0.9% for AGIs $25k-50k, 0.9% for AGIs $50k-75k, 1.6% for AGIs $75k-100k, 0.5% for AGIs over 100k)
Taxable dividends: $1,078 (reported on 21.5% of returns)
Here:
$1,078
State:
$4,028
(% of AGI for various income ranges: 0.4% for AGIs $10k-25k, 0.6% for AGIs $25k-50k, 0.1% for AGIs $50k-75k, 0.4% for AGIs $75k-100k, 1.1% for AGIs over 100k)
Net capital gain/loss: +$2,653 (reported on 12.6% of returns)
Here:
+$2,653
State:
+$14,375
(% of AGI for various income ranges: 0.4% for AGIs $10k-25k, 0.4% for AGIs $25k-50k, 1.4% for AGIs $50k-75k, 1.5% for AGIs $75k-100k)
Profit/loss from business: +$14,129 (reported on 14.3% of returns)
Here:
+$14,129
State:
+$13,342
(% of AGI for various income ranges: 4.3% for AGIs $10k-25k, 4.0% for AGIs $25k-50k, 3.6% for AGIs $50k-75k, 11.7% for AGIs $75k-100k)
IRA payment deduction: $2,059 (reported on 2.9% of returns)
24079:
$2,059
Virginia:
$2,943
Total itemized deductions: $14,405 (20% of AGI, reported on 25.7% of returns)
Here:
$14,405
State:
$21,492
Here:
19.5% of AGI
State:
21.0% of AGI
(% of AGI for various income ranges: 5.7% for AGIs $10k-25k, 6.5% for AGIs $25k-50k, 9.7% for AGIs $50k-75k, 12.0% for AGIs $75k-100k, 7.8% for AGIs over 100k)
Charity contributions deductions: $2,770 (3% of AGI, reported on 20.5% of returns)
Here:
$2,770
State:
$3,794
Here:
3.4% of AGI
State:
3.5% of AGI
(% of AGI for various income ranges: 0.7% for AGIs $10k-25k, 0.5% for AGIs $25k-50k, 1.6% for AGIs $50k-75k, 1.9% for AGIs $75k-100k, 2.0% for AGIs over 100k)
Total tax: $4,413 (reported on 84.9% of returns)
24079:
$4,413
State:
$9,537
(% of AGI for various income ranges: 4.1% for AGIs $10k-25k, 6.4% for AGIs $25k-50k, 8.9% for AGIs $50k-75k, 10.6% for AGIs $75k-100k, 12.6% for AGIs over 100k)
Earned income credit: $1,633 (reported on 13.3% of returns)
Here:
$1,633
State:
$1,734
Percentage of individuals using paid preparers for their 2004 taxes: 65.3%
Here:
65%
State:
52%
(% for various income ranges: 58.9% for AGIs $10k-25k, 63.9% for AGIs $25k-50k, 69.6% for AGIs $50k-75k, 82.4% for AGIs $75k-100k, 77.3% for AGIs over 100k)
Churches in zip code 24079 include: Smiths Chapel (A), Crossroads Union Chapel (B), Copper Hill Church of the Brethren (C), Head of the River Church (D), Mount Olivet Church (E), Pine Forest Church (F). Display/hide their locations on the map
Cemeteries: Wilson Cemetery (1), Kefauver Cemetery (2), Nichols Cemetery (3), Poff Cemetery (4), Salem Cemetery (5). Display/hide their locations on the map
Streams, rivers, and creeks: Pine Branch (A), Payne Creek (B), Meadow Run (C), Lick Fork (D), Boothe Creek (E), Big Run (F). Display/hide their locations on the map
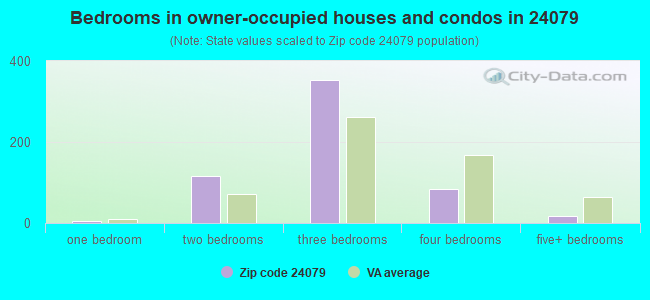
Size of family households: 311 2-persons, 126 3-persons, 129 4-persons, 11 6-persons
Size of nonfamily households: 129 1-person, 9 2-persons, 39 4-persons
92 married couples with children.
376 single-parent households (207 men, 169 women).
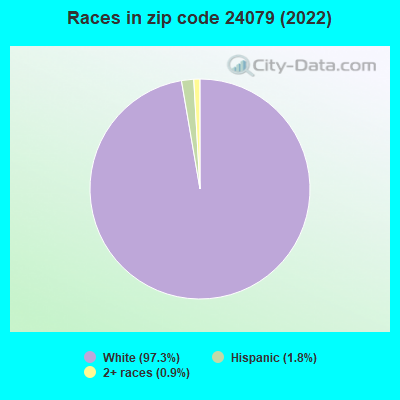
95.5% of residents of 24079 zip code speak English at home.
4.2% of residents speak Spanish at home (60% very well, 40% well).
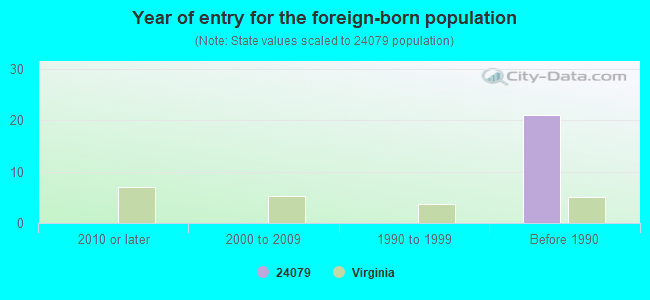
Foreign born population: 0 (0.0%)
:
0.0%
Whole state:
12.7%
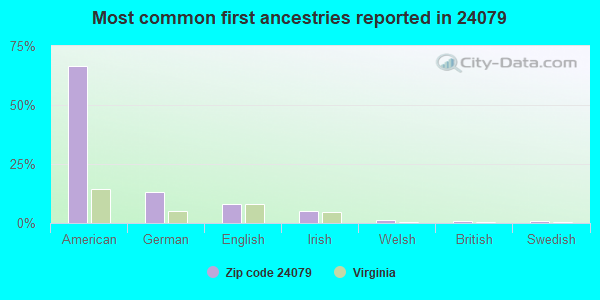
66%American
13%German
8%English
5%Irish
1%Welsh
1%British
1%Swedish
Year of entry for the foreign-born population
02010 or later
02000 to 2009
01990 to 1999
21Before 1990
Facilities with environmental interests located in this zip code:
CHESAPEAKE & POTOMAC TELEPHONE CO ( in COPPER HILL, VA)
(Resource Conservation and Recovery Act (tracking hazardous waste)) Organizations: OPERNAME (CONTACT/OPERATOR)
, CHESAPEAKE & POTOMAC TELEPHONE COMPANY (CONTACT/OWNER)
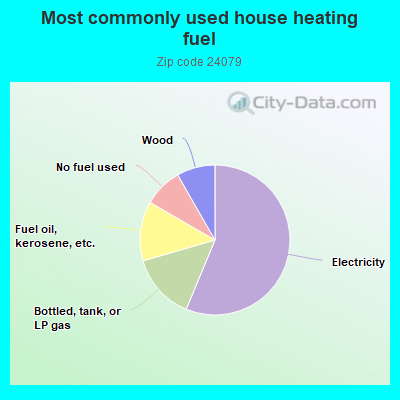
56.5%Electricity
14.3%Bottled, tank, or LP gas
12.9%Fuel oil, kerosene, etc.
8.4%No fuel used
8.3%Wood
Population in 1990: 1,765.
Place of birth for U.S.-born residents:
This state: 1,396
Northeast: 180
Midwest: 18
South: 280
West: 13
60% of the 24079 zip code residents lived in the same house 5 years ago. Out of people who lived in different houses, 43% lived in this county. Out of people who lived in different counties, 50% lived in Virginia.
99% of the 24079 zip code residents lived in the same house 1 year ago. Out of people who lived in different houses, 100% moved from this county. Out of people who lived in different houses, 33% moved from different county within same state.
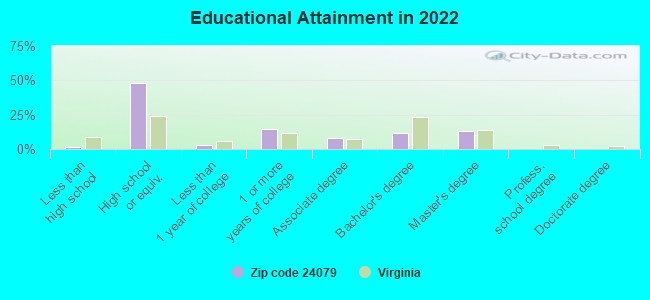
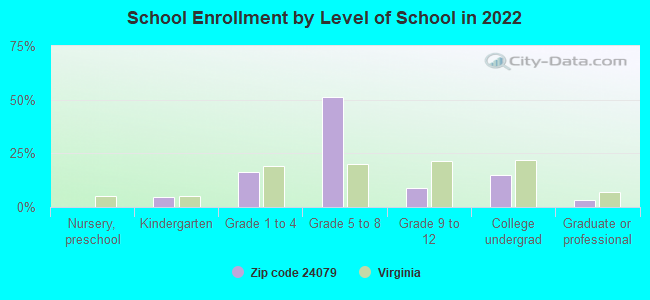
Private vs. public school enrollment:
Students in private schools in grades 1 to 8 (elementary and middle school):
Here:
0.0%
Virginia:
13.2%
Students in private schools in grades 9 to 12 (high school): 11
Here:
20.4%
Virginia:
10.2%
Students in private undergraduate colleges: 28
Here:
30.7%
Virginia:
18.7%
Occupation by median earnings in the past 12 months ($)
129,911Material moving occupations
60,300Production occupations
57,356Management occupations
52,568Sales and related occupations
45,506Healthcare support occupations
41,954Construction and extraction occupations
Top industries in this zip code by the number of employees in 2005:
Health Care and Social Assistance: Child Day Care Services (10-19 employees: 1 establishment, 1-4 employees: 1 establishment)
Construction: New Single-Family Housing Construction (except Operative Builders) (10-19: 1)
Construction: Site Preparation Contractors (5-9: 1)
Professional, Scientific, and Technical Services: Veterinary Services (5-9: 1)
Construction: New Housing Operative Builders (5-9: 1)
Health Care and Social Assistance: Offices of Physicians (except Mental Health Specialists) (1-4: 1)
Construction: Land Subdivision (1-4: 1)
Other Services (except Public Administration): Beauty Salons (1-4: 1)
Fatal accident statistics in 2014:
Fatal accident count: 1
Vehicles involved in fatal accidents: 2
Fatal accidents caused by drunken drivers: 0
Fatalities: 1
Persons involved in fatal accidents: 2
Pedestrians involved in fatal accidents: 0
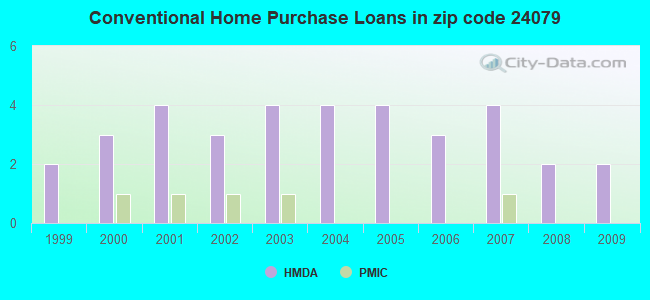
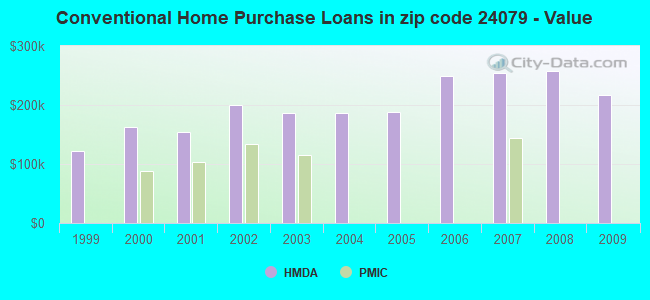
Home Mortgage Disclosure Act Aggregated Statistics For Year 2009 (Based on 4 partial tracts)
A) FHA, FSA/RHS & VA Home Purchase Loans
B) Conventional Home Purchase Loans
C) Refinancings
Number
Average Value
Number
Average Value
Number
Average Value
LOANS ORIGINATED
1
$115,120
2
$217,685
7
$218,381
APPLICATIONS APPROVED, NOT ACCEPTED
0
$0
0
$0
0
$0
APPLICATIONS DENIED
0
$0
0
$0
1
$288,170
APPLICATIONS WITHDRAWN
0
$0
0
$0
1
$183,380
FILES CLOSED FOR INCOMPLETENESS
0
$0
0
$0
0
$0
Aggregated Statistics For Year 2008 (Based on 4 partial tracts)
B) Conventional Home Purchase Loans
C) Refinancings
Number
Average Value
Number
Average Value
LOANS ORIGINATED
2
$256,830
4
$196,405
APPLICATIONS APPROVED, NOT ACCEPTED
0
$0
1
$111,990
APPLICATIONS DENIED
0
$0
1
$298,910
APPLICATIONS WITHDRAWN
0
$0
1
$199,200
FILES CLOSED FOR INCOMPLETENESS
0
$0
0
$0
Aggregated Statistics For Year 2007 (Based on 4 partial tracts)
B) Conventional Home Purchase Loans
C) Refinancings
D) Home Improvement Loans
Number
Average Value
Number
Average Value
Number
Average Value
LOANS ORIGINATED
4
$253,508
3
$215,590
1
$82,630
APPLICATIONS APPROVED, NOT ACCEPTED
0
$0
1
$122,730
0
$0
APPLICATIONS DENIED
0
$0
1
$243,820
0
$0
APPLICATIONS WITHDRAWN
1
$167,310
1
$114,640
0
$0
FILES CLOSED FOR INCOMPLETENESS
0
$0
0
$0
0
$0
Aggregated Statistics For Year 2006 (Based on 4 partial tracts)
B) Conventional Home Purchase Loans
C) Refinancings
D) Home Improvement Loans
Number
Average Value
Number
Average Value
Number
Average Value
LOANS ORIGINATED
3
$249,203
3
$188,527
1
$64,800
APPLICATIONS APPROVED, NOT ACCEPTED
0
$0
0
$0
0
$0
APPLICATIONS DENIED
1
$104,450
1
$138,650
0
$0
APPLICATIONS WITHDRAWN
0
$0
1
$176,490
0
$0
FILES CLOSED FOR INCOMPLETENESS
0
$0
0
$0
0
$0
Aggregated Statistics For Year 2005 (Based on 4 partial tracts)
B) Conventional Home Purchase Loans
C) Refinancings
Number
Average Value
Number
Average Value
LOANS ORIGINATED
4
$187,740
4
$156,358
APPLICATIONS APPROVED, NOT ACCEPTED
0
$0
1
$104,540
APPLICATIONS DENIED
1
$61,740
1
$193,160
APPLICATIONS WITHDRAWN
0
$0
1
$124,830
FILES CLOSED FOR INCOMPLETENESS
0
$0
0
$0
Aggregated Statistics For Year 2004 (Based on 4 partial tracts)
B) Conventional Home Purchase Loans
C) Refinancings
Number
Average Value
Number
Average Value
LOANS ORIGINATED
4
$186,852
5
$153,732
APPLICATIONS APPROVED, NOT ACCEPTED
0
$0
1
$70,790
APPLICATIONS DENIED
0
$0
1
$191,590
APPLICATIONS WITHDRAWN
0
$0
1
$190,680
FILES CLOSED FOR INCOMPLETENESS
0
$0
0
$0
Aggregated Statistics For Year 2003 (Based on 4 partial tracts)
B) Conventional Home Purchase Loans
C) Refinancings
D) Home Improvement Loans
Number
Average Value
Number
Average Value
Number
Average Value
LOANS ORIGINATED
4
$186,528
13
$160,425
1
$29,660
APPLICATIONS APPROVED, NOT ACCEPTED
0
$0
1
$137,620
0
$0
APPLICATIONS DENIED
0
$0
1
$185,340
0
$0
APPLICATIONS WITHDRAWN
0
$0
1
$161,360
0
$0
FILES CLOSED FOR INCOMPLETENESS
0
$0
0
$0
0
$0
Aggregated Statistics For Year 2002 (Based on 4 partial tracts)
B) Conventional Home Purchase Loans
C) Refinancings
Number
Average Value
Number
Average Value
LOANS ORIGINATED
3
$200,813
8
$161,005
APPLICATIONS APPROVED, NOT ACCEPTED
0
$0
1
$143,550
APPLICATIONS DENIED
0
$0
1
$145,740
APPLICATIONS WITHDRAWN
0
$0
1
$141,340
FILES CLOSED FOR INCOMPLETENESS
0
$0
0
$0
Aggregated Statistics For Year 2001 (Based on 4 partial tracts)
A) FHA, FSA/RHS & VA Home Purchase Loans
B) Conventional Home Purchase Loans
C) Refinancings
D) Home Improvement Loans
Number
Average Value
Number
Average Value
Number
Average Value
Number
Average Value
LOANS ORIGINATED
1
$64,250
4
$153,468
6
$146,137
1
$21,110
APPLICATIONS APPROVED, NOT ACCEPTED
0
$0
0
$0
0
$0
0
$0
APPLICATIONS DENIED
0
$0
0
$0
1
$96,310
0
$0
APPLICATIONS WITHDRAWN
0
$0
0
$0
1
$135,410
0
$0
FILES CLOSED FOR INCOMPLETENESS
0
$0
0
$0
0
$0
0
$0
Aggregated Statistics For Year 2000 (Based on 4 partial tracts)
B) Conventional Home Purchase Loans
C) Refinancings
D) Home Improvement Loans
Number
Average Value
Number
Average Value
Number
Average Value
LOANS ORIGINATED
3
$162,480
1
$159,010
1
$23,390
APPLICATIONS APPROVED, NOT ACCEPTED
0
$0
0
$0
0
$0
APPLICATIONS DENIED
0
$0
1
$97,830
0
$0
APPLICATIONS WITHDRAWN
0
$0
0
$0
0
$0
FILES CLOSED FOR INCOMPLETENESS
0
$0
0
$0
0
$0
Aggregated Statistics For Year 1999 (Based on 2 partial tracts)
Detailed PMIC statistics for the following Tracts:0306.00
2002 - 2018 National Fire Incident Reporting System (NFIRS) incidents
According to the data from the years 2002 - 2018 the average number of fire incidents per year is 7. The highest number of reported fire incidents - 14 took place in 2008, and the least - 1 in 2017. The data has a rising trend.
When looking into fire subcategories, the most reports belonged to: Outside Fires (46.4%), and Structure Fires (40.2%).
Fire incident types reported to NFIRS in Zip Code 24079


 Nearest zip codes: 24072, 24067, 24059, 24162, 24138, 24065.
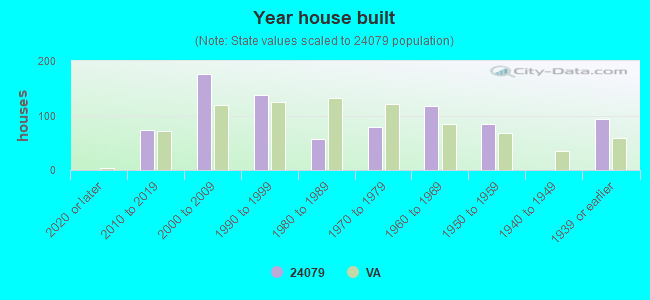


 According to the data from the years 2002 - 2018 the average number of fire incidents per year is 7. The highest number of reported fire incidents - 14 took place in 2008, and the least - 1 in 2017. The data has a rising trend.
 When looking into fire subcategories, the most reports belonged to: Outside Fires (46.4%), and Structure Fires (40.2%).