Estimated zip code population in 2022: 2,150 Zip code population in 2010: 2,421 Zip code population in 2000: 2,320
Houses and condos: 1,134 Renter-occupied apartments: 404
% of renters here:
43%
State:
33%
March 2022 cost of living index in zip code 24162: 83.7 (less than average, U.S. average is 100)
Land area: 46.7 sq. mi. Water area: 0.2 sq. mi.
Population density: 46 people per square mile
(very low).
OSM Map
General Map
Google Map
MSN Map
OSM Map
General Map
Google Map
MSN Map
OSM Map
General Map
Google Map
MSN Map
OSM Map
General Map
Google Map
MSN Map
Please wait while loading the map...
Real estate property taxes paid for housing units in 2022:
This zip code:
0.9% ($1,465)
Virginia:
0.7% ($2,617)
Median real estate property taxes paid for housing units with mortgages in 2022: $1,237 (0.6%) Median real estate property taxes paid for housing units with no mortgage in 2022: $1,522 (1.0%)
Business Search- 14 Million verified businesses
Males: 998
(46.4%)
Females: 1,152
(53.6%)
For population 25 years and over in 24162:
High school or higher: 90.8%
Bachelor's degree or higher: 20.8%
Graduate or professional degree: 8.4%
Unemployed: 1.4%
Mean travel time to work (commute): 21.7 minutes
For population 15 years and over in 24162:
Never married: 32.0%
Now married: 54.2%
Separated: 0.5%
Widowed: 3.8%
Divorced: 9.5%
Zip code 24162 compared to state average:
Median house value below state average.
Unemployed percentage below state average.
Black race population percentage significantly below state average.
Hispanic race population percentage significantly below state average.
Median age significantly above state average.
Foreign-born population percentage significantly below state average.
Length of stay since moving in significantly above state average.
Number of rooms per house below state average.
Number of college students significantly below state average.
Percentage of population with a bachelor's degree or higher below state average.
Estimated median house/condo value in 2022: $170,151
24162:
$170,151
Virginia:
$365,700
According to our research of Virginia and other state lists, there were 4 registered sex offenders living in 24162 zip code as of May 28, 2024. The ratio of all residents to sex offenders in zip code 24162 is 429 to 1. The ratio of registered sex offenders to all residents in this zip code is lower than the state average.
Median resident age:
This zip code:
48.3 years
Virginia median age:
39.0 years
Average household size:
This zip code:
2.3 people
Virginia:
2.5 people
Averages for the 2020 tax year for zip code 24162, filed in 2021:
Average Adjusted Gross Income (AGI) in 2020: $55,367 (Individual Income Tax Returns)
Here:
$55,367
State:
$86,446
Salary/wage: $48,030 (reported on 85.6% of returns)
Here:
$48,030
State:
$71,185
(% of AGI for various income ranges: 1260.0% for AGIs below $25k, 3551.4% for AGIs $25k-50k, 6301.8% for AGIs $50k-75k, 8762.5% for AGIs $75k-100k, 13118.8% for AGIs $100k-200k)
Taxable interest for individuals: $2,755 (reported on 20.6% of returns)
This zip code:
$2,755
Virginia:
$1,805
(% of AGI for various income ranges: 6.2% for AGIs below $25k, 25.0% for AGIs $25k-50k, 31.8% for AGIs $50k-75k, 35.0% for AGIs $75k-100k, 75.0% for AGIs $100k-200k)
Ordinary dividends: $5,292 (reported on 13.4% of returns)
Here:
$5,292
State:
$8,327
(% of AGI for various income ranges: 33.6% for AGIs $25k-50k, 38.8% for AGIs $75k-100k, 728.8% for AGIs $100k-200k)
Net capital gain/loss in AGI: +$27,791 (reported on 11.3% of returns)
Here:
+$27,791
State:
+$24,644
(% of AGI for various income ranges: 22.3% for AGIs $25k-50k, 7.5% for AGIs $75k-100k, 3752.5% for AGIs $100k-200k)
Profit/loss from business: +$8,800 (reported on 14.4% of returns)
Here:
+$8,800
State:
+$12,836
(% of AGI for various income ranges: 131.7% for AGIs below $25k, 141.8% for AGIs $25k-50k, 355.5% for AGIs $50k-75k, 266.2% for AGIs $100k-200k)
Taxable individual retirement arrangement distribution: $9,571 (reported on 7.2% of returns)
24162:
$9,571
Virginia:
$21,535
(% of AGI for various income ranges: 145.0% for AGIs $25k-50k, 438.8% for AGIs $75k-100k)
Total itemized deductions: $36,500 (reported on 4.1% of returns)
Here:
$36,500
State:
$33,287
(% of AGI for various income ranges: 1825.0% for AGIs $100k-200k)
Charity contributions: $18,033 (reported on 3.1% of returns)
Here:
$18,033
State:
$10,381
(% of AGI for various income ranges: 676.2% for AGIs $100k-200k)
Taxes paid: $8,300 (reported on 4.1% of returns)
24162:
$8,300
State:
$8,284
(% of AGI for various income ranges: 415.0% for AGIs $100k-200k)
Earned income credit: $2,417 (reported on 18.6% of returns)
Here:
$2,417
State:
$2,214
(% of AGI for various income ranges: 108.3% for AGIs below $25k, 79.5% for AGIs $25k-50k)
Percentage of individuals using paid preparers for their 2020 taxes: 95.9%
Here:
96%
State:
92%
(% for various income ranges: 93.8% for AGIs below $25k, 96.3% for AGIs $25k-50k, 93.3% for AGIs $50k-75k, 100.0% for AGIs $75k-100k, 100.0% for AGIs $100k-200k, 100.0% for AGIs over 200k)
Averages for the 2012 tax year for zip code 24162, filed in 2013:
Average Adjusted Gross Income (AGI) in 2012: $46,105 (Individual Income Tax Returns)
Here:
$46,105
State:
$71,192
Salary/wage: $41,231 (reported on 87.5% of returns)
Here:
$41,231
State:
$59,229
(% of AGI for various income ranges: 79.2% for AGIs below $25k, 81.8% for AGIs $25k-50k, 84.7% for AGIs $50k-75k, 77.3% for AGIs $75k-100k, 70.6% for AGIs $100k-200k)
Taxable interest for individuals: $1,139 (reported on 29.2% of returns)
This zip code:
$1,139
Virginia:
$1,600
(% of AGI for various income ranges: 1.2% for AGIs below $25k, 0.8% for AGIs $25k-50k, 0.4% for AGIs $50k-75k, 0.4% for AGIs $75k-100k, 0.9% for AGIs $100k-200k)
Ordinary dividends: $2,753 (reported on 17.7% of returns)
Here:
$2,753
State:
$6,959
(% of AGI for various income ranges: 0.5% for AGIs below $25k, 0.3% for AGIs $25k-50k, 0.5% for AGIs $50k-75k, 1.1% for AGIs $75k-100k, 2.3% for AGIs $100k-200k)
Net capital gain/loss in AGI: +$4,638 (reported on 8.3% of returns)
Here:
+$4,638
State:
+$16,672
(% of AGI for various income ranges: 3.3% for AGIs $100k-200k)
Profit/loss from business: +$5,754 (reported on 13.5% of returns)
Here:
+$5,754
State:
+$14,116
(% of AGI for various income ranges: 7.1% for AGIs below $25k, 2.3% for AGIs $25k-50k, 1.0% for AGIs $50k-75k, 1.1% for AGIs $75k-100k)
Taxable individual retirement arrangement distribution: $9,443 (reported on 7.3% of returns)
24162:
$9,443
Virginia:
$16,667
Total itemized deductions: $17,968 (22% of AGI, reported on 26.0% of returns)
Here:
$17,968
State:
$26,596
Here:
22.1% of AGI
State:
20.1% of AGI
(% of AGI for various income ranges: 10.4% for AGIs $25k-50k, 9.5% for AGIs $50k-75k, 12.6% for AGIs $75k-100k, 12.9% for AGIs $100k-200k)
Charity contributions: $5,447 (reported on 17.7% of returns)
Here:
$5,447
State:
$4,443
(% of AGI for various income ranges: 1.4% for AGIs $25k-50k, 1.8% for AGIs $50k-75k, 2.5% for AGIs $75k-100k, 3.4% for AGIs $100k-200k)
Taxes paid: $5,752 (reported on 26.0% of returns)
24162:
$5,752
State:
$9,951
(% of AGI for various income ranges: 2.2% for AGIs $25k-50k, 2.7% for AGIs $50k-75k, 3.9% for AGIs $75k-100k, 5.3% for AGIs $100k-200k)
Earned income credit: $2,447 (reported on 19.8% of returns)
Here:
$2,447
State:
$2,211
(% of AGI for various income ranges: 7.4% for AGIs below $25k, 1.1% for AGIs $25k-50k)
Percentage of individuals using paid preparers for their 2012 taxes: 53.1%
Here:
53%
State:
46%
(% for various income ranges: 50.0% for AGIs below $25k, 50.0% for AGIs $25k-50k, 56.2% for AGIs $50k-75k, 60.0% for AGIs $75k-100k, 62.5% for AGIs $100k-200k)
Averages for the 2004 tax year for zip code 24162, filed in 2005:
Average Adjusted Gross Income (AGI) in 2004: $37,890 (Individual Income Tax Returns)
Here:
$37,890
State:
$56,704
Salary/wage: $33,334 (reported on 87.1% of returns)
Here:
$33,334
State:
$48,441
(% of AGI for various income ranges: 83.4% for AGIs below $10k, 82.9% for AGIs $10k-25k, 85.1% for AGIs $25k-50k, 85.1% for AGIs $50k-75k, 77.6% for AGIs $75k-100k, 47.7% for AGIs over 100k)
Taxable interest for individuals: $1,892 (reported on 38.0% of returns)
This zip code:
$1,892
Virginia:
$1,688
(% of AGI for various income ranges: 4.5% for AGIs below $10k, 1.3% for AGIs $10k-25k, 1.4% for AGIs $25k-50k, 0.6% for AGIs $50k-75k, 0.6% for AGIs $75k-100k, 5.4% for AGIs over 100k)
Taxable dividends: $3,068 (reported on 17.2% of returns)
Here:
$3,068
State:
$4,028
(% of AGI for various income ranges: 1.3% for AGIs below $10k, 0.2% for AGIs $10k-25k, 0.2% for AGIs $25k-50k, 0.2% for AGIs $50k-75k, 0.7% for AGIs $75k-100k, 5.9% for AGIs over 100k)
Net capital gain/loss: +$6,081 (reported on 12.0% of returns)
Here:
+$6,081
State:
+$14,375
(% of AGI for various income ranges: 1.3% for AGIs below $10k, -0.2% for AGIs $10k-25k, -0.1% for AGIs $25k-50k, 0.3% for AGIs $50k-75k, 3.8% for AGIs $75k-100k, 7.0% for AGIs over 100k)
Profit/loss from business: +$7,503 (reported on 14.9% of returns)
Here:
+$7,503
State:
+$13,342
(% of AGI for various income ranges: 0.8% for AGIs below $10k, 6.5% for AGIs $10k-25k, 3.2% for AGIs $25k-50k, 2.7% for AGIs $50k-75k, 2.3% for AGIs $75k-100k, 1.3% for AGIs over 100k)
IRA payment deduction: $2,387 (reported on 3.0% of returns)
24162:
$2,387
Virginia:
$2,943
Total itemized deductions: $16,164 (22% of AGI, reported on 24.4% of returns)
Here:
$16,164
State:
$21,492
Here:
22.3% of AGI
State:
21.0% of AGI
(% of AGI for various income ranges: 5.4% for AGIs $10k-25k, 9.2% for AGIs $25k-50k, 11.1% for AGIs $50k-75k, 11.2% for AGIs $75k-100k, 15.0% for AGIs over 100k)
Charity contributions deductions: $4,825 (6% of AGI, reported on 20.6% of returns)
Here:
$4,825
State:
$3,794
Here:
6.3% of AGI
State:
3.5% of AGI
(% of AGI for various income ranges: 0.8% for AGIs $10k-25k, 0.8% for AGIs $25k-50k, 2.3% for AGIs $50k-75k, 2.3% for AGIs $75k-100k, 7.1% for AGIs over 100k)
Total tax: $4,637 (reported on 77.1% of returns)
24162:
$4,637
State:
$9,537
(% of AGI for various income ranges: 2.4% for AGIs below $10k, 4.5% for AGIs $10k-25k, 6.8% for AGIs $25k-50k, 8.8% for AGIs $50k-75k, 10.6% for AGIs $75k-100k, 17.1% for AGIs over 100k)
Earned income credit: $1,803 (reported on 17.9% of returns)
Here:
$1,803
State:
$1,734
Percentage of individuals using paid preparers for their 2004 taxes: 54.4%
Here:
54%
State:
52%
(% for various income ranges: 45.3% for AGIs below $10k, 59.1% for AGIs $10k-25k, 57.4% for AGIs $25k-50k, 54.1% for AGIs $50k-75k, 48.3% for AGIs $75k-100k, 55.8% for AGIs over 100k)
Household received Food Stamps/SNAP in the past 12 months: 25 Household did not receive Food Stamps/SNAP in the past 12 months: 905
Women who did not have a birth in the past 12 months: 609 (164 now married, 448 unmarried)
Housing units in zip code 24162 with a mortgage: 252 (44 second mortgage, 44 both second mortgage and home equity loan) Median monthly owner costs for units with a mortgage: $1,253 Median monthly owner costs for units without a mortgage: $361
Residents with income below the poverty level in 2022:
This zip code:
6.7%
Whole state:
10.6%
Residents with income below 50% of the poverty level in 2022:
This zip code:
6.7%
Whole state:
5.2%
Median number of rooms in houses and condos:
Here:
5.7
State:
7.0
Median number of rooms in apartments:
Here:
4.2
State:
4.3
Notable locations in this zip code not listed on our city pages
Churches in zip code 24162 include: Alleghany Church (A), Bonys Run Church (B), Bottom Creek Church (C), Sowders Chapel Baptist Church (D), Texas Hollow Church (E), Hemlock Church (F), Mount Pleasant Church (G). Display/hide their locations on the map
Streams, rivers, and creeks: Sugar Run (A), Spring Valley Branch (B), Spring Branch (C), Purgatory Creek (D), Little Laurel Creek (E), Goose Creek (F), Georges Run (G), Falling Branch (H), Elliott Creek (I). Display/hide their locations on the map
Parks in zip code 24162 include: Shawsville Historic District (1), Piedmont Camp Meeting Grounds Historic District (2). Display/hide their locations on the map
Size of family households: 389 2-persons, 144 3-persons, 34 4-persons, 30 5-persons
Size of nonfamily households: 252 1-person, 93 2-persons
65 married couples with children.
0 single-parent households ().
98.0% of residents of 24162 zip code speak English at home.
0.9% of residents speak Spanish at home (100% well).
0.7% of residents speak other Indo-European language at home (100% very well).
Foreign born population: 17 (0.8%) (0.0% of them are naturalized citizens)
:
0.8%
Whole state:
12.7%
72%Egypt
28%German
28%American
18%Irish
11%English
6%European
3%British
1%Scottish
Year of entry for the foreign-born population
202010 or later
02000 to 2009
01990 to 1999
0Before 1990
Facilities with environmental interests located in this zip code:
ALLEGHENY SPRINGS WATER WORKS (RT 1 in SHAWSVILLE, VA)
(Integrated Compliance Information System) - ICIS-03-1988-0386, FORMAL ENFORCEMENT ACTION
CHESAPEAKE & POTOMAC TELEPHONE CO (U S RT 11 LEE HWY in SHAWSVILLE, VA)
Housing units lacking complete plumbing facilities: 8.3% Housing units lacking complete kitchen facilities: 8.5%
87.2%Electricity
4.9%Fuel oil, kerosene, etc.
3.5%Bottled, tank, or LP gas
2.6%Wood
2.1%Other fuel
Population in 1990: 2,571.
Place of birth for U.S.-born residents:
This state: 1,610
Northeast: 12
Midwest: 78
South: 390
West: 26
67% of the 24162 zip code residents lived in the same house 5 years ago. Out of people who lived in different houses, 56% lived in this county. Out of people who lived in different counties, 50% lived in Virginia.
95% of the 24162 zip code residents lived in the same house 1 year ago. Out of people who lived in different houses, 15% moved from this county. Out of people who lived in different houses, 75% moved from different county within same state. Out of people who lived in different houses, 18% moved from abroad.
Private vs. public school enrollment:
Students in private schools in grades 1 to 8 (elementary and middle school): 33
Here:
72.6%
Virginia:
13.2%
Students in private schools in grades 9 to 12 (high school):
Here:
0.0%
Virginia:
10.2%
Students in private undergraduate colleges:
Here:
0.0%
Virginia:
18.7%
Occupation by median earnings in the past 12 months ($)
37,356Installation, maintenance, and repair occupations
36,092Management occupations
27,110Transportation occupations
22,623Production occupations
17,207Building and grounds cleaning and maintenance occupations
9,137Sales and related occupations
Top industries in this zip code by the number of employees in 2005:
Health Care and Social Assistance: Other Residential Care Facilities (20-49: 1)
Mining: Crushed and Broken Limestone Mining and Quarrying (20-49: 1)
Health Care and Social Assistance: Child Day Care Services (20-49: 1)
Finance and Insurance: Commercial Banking (5-9: 2)
Other Services (except Public Administration): Beauty Salons (5-9: 1, 1-4: 1)
Construction: New Single-Family Housing Construction (except Operative Builders) (5-9: 1)
Other Services (except Public Administration): Commercial and Industrial Machinery and Equipment (except Automotive and Electronic) Repair and Maintenance (5-9: 1)
Construction: Industrial Building Construction (5-9: 1)
People in group quarters in 2000:
69 people in homes for the physically handicapped
28 people in other noninstitutional group quarters
Fatal accident statistics in 2013:
Fatal accident count: 1
Vehicles involved in fatal accidents: 1
Fatal accidents caused by drunken drivers: 0
Fatalities: 1
Persons involved in fatal accidents: 1
Pedestrians involved in fatal accidents: 0
Fatal accident statistics in 2011:
Fatal accident count: 1
Vehicles involved in fatal accidents: 1
Fatal accidents caused by drunken drivers: 1
Fatalities: 2
Persons involved in fatal accidents: 3
Pedestrians involved in fatal accidents: 0
Home Mortgage Disclosure Act Aggregated Statistics For Year 2009 (Based on 2 partial tracts)
A) FHA, FSA/RHS & VA Home Purchase Loans
B) Conventional Home Purchase Loans
C) Refinancings
D) Home Improvement Loans
F) Non-occupant Loans on < 5 Family Dwellings (A B C & D)
G) Loans On Manufactured Home Dwelling (A B C & D)
Number
Average Value
Number
Average Value
Number
Average Value
Number
Average Value
Number
Average Value
Number
Average Value
LOANS ORIGINATED
16
$142,242
8
$90,501
63
$145,987
6
$11,485
2
$125,415
6
$42,418
APPLICATIONS APPROVED, NOT ACCEPTED
2
$79,015
1
$32,160
6
$105,203
1
$18,380
0
$0
2
$25,265
APPLICATIONS DENIED
0
$0
4
$33,995
17
$117,769
9
$28,789
3
$32,770
6
$46,705
APPLICATIONS WITHDRAWN
1
$124,960
1
$305,960
15
$173,408
0
$0
0
$0
3
$95,860
FILES CLOSED FOR INCOMPLETENESS
0
$0
1
$15,620
9
$118,321
0
$0
0
$0
2
$50,535
Aggregated Statistics For Year 2008 (Based on 2 partial tracts)
A) FHA, FSA/RHS & VA Home Purchase Loans
B) Conventional Home Purchase Loans
C) Refinancings
D) Home Improvement Loans
F) Non-occupant Loans on < 5 Family Dwellings (A B C & D)
G) Loans On Manufactured Home Dwelling (A B C & D)
Number
Average Value
Number
Average Value
Number
Average Value
Number
Average Value
Number
Average Value
Number
Average Value
LOANS ORIGINATED
8
$118,870
20
$145,860
38
$130,542
12
$46,859
5
$51,636
10
$86,551
APPLICATIONS APPROVED, NOT ACCEPTED
2
$118,985
1
$39,510
6
$114,543
0
$0
0
$0
0
$0
APPLICATIONS DENIED
1
$138,740
4
$107,500
58
$125,353
17
$21,456
2
$68,910
18
$84,683
APPLICATIONS WITHDRAWN
0
$0
3
$246,543
17
$118,634
2
$3,215
3
$90,350
3
$94,943
FILES CLOSED FOR INCOMPLETENESS
0
$0
2
$169,520
1
$150,680
1
$123,120
0
$0
1
$123,120
Aggregated Statistics For Year 2007 (Based on 2 partial tracts)
A) FHA, FSA/RHS & VA Home Purchase Loans
B) Conventional Home Purchase Loans
C) Refinancings
D) Home Improvement Loans
F) Non-occupant Loans on < 5 Family Dwellings (A B C & D)
G) Loans On Manufactured Home Dwelling (A B C & D)
Number
Average Value
Number
Average Value
Number
Average Value
Number
Average Value
Number
Average Value
Number
Average Value
LOANS ORIGINATED
8
$134,604
35
$125,351
48
$106,275
17
$38,535
8
$156,426
14
$99,559
APPLICATIONS APPROVED, NOT ACCEPTED
0
$0
4
$91,420
8
$112,552
3
$50,533
1
$69,830
4
$44,792
APPLICATIONS DENIED
2
$92,800
16
$67,647
88
$101,277
15
$47,717
6
$81,008
27
$60,641
APPLICATIONS WITHDRAWN
1
$133,230
5
$75,710
21
$107,456
2
$51,910
2
$62,020
6
$92,493
FILES CLOSED FOR INCOMPLETENESS
0
$0
2
$108,420
0
$0
1
$124,040
0
$0
0
$0
Aggregated Statistics For Year 2006 (Based on 2 partial tracts)
A) FHA, FSA/RHS & VA Home Purchase Loans
B) Conventional Home Purchase Loans
C) Refinancings
D) Home Improvement Loans
F) Non-occupant Loans on < 5 Family Dwellings (A B C & D)
G) Loans On Manufactured Home Dwelling (A B C & D)
Number
Average Value
Number
Average Value
Number
Average Value
Number
Average Value
Number
Average Value
Number
Average Value
LOANS ORIGINATED
6
$115,310
35
$96,789
63
$109,162
18
$22,919
9
$90,451
22
$59,555
APPLICATIONS APPROVED, NOT ACCEPTED
2
$124,955
6
$62,018
11
$95,054
1
$27,560
1
$24,810
3
$62,173
APPLICATIONS DENIED
1
$82,690
18
$70,901
62
$86,590
8
$48,238
6
$36,293
28
$68,352
APPLICATIONS WITHDRAWN
0
$0
6
$85,602
40
$104,008
2
$56,045
3
$67,073
6
$94,943
FILES CLOSED FOR INCOMPLETENESS
1
$155,280
0
$0
7
$161,577
0
$0
0
$0
0
$0
Aggregated Statistics For Year 2005 (Based on 2 partial tracts)
A) FHA, FSA/RHS & VA Home Purchase Loans
B) Conventional Home Purchase Loans
C) Refinancings
D) Home Improvement Loans
F) Non-occupant Loans on < 5 Family Dwellings (A B C & D)
G) Loans On Manufactured Home Dwelling (A B C & D)
Number
Average Value
Number
Average Value
Number
Average Value
Number
Average Value
Number
Average Value
Number
Average Value
LOANS ORIGINATED
10
$108,418
50
$96,033
74
$106,159
18
$19,244
12
$72,738
31
$62,360
APPLICATIONS APPROVED, NOT ACCEPTED
1
$127,710
6
$74,117
16
$129,149
4
$17,688
0
$0
6
$52,678
APPLICATIONS DENIED
1
$69,830
20
$57,517
65
$105,139
13
$47,848
4
$29,402
24
$52,678
APPLICATIONS WITHDRAWN
3
$108,723
6
$76,720
32
$121,971
5
$99,230
3
$78,403
7
$90,961
FILES CLOSED FOR INCOMPLETENESS
0
$0
2
$65,235
4
$205,352
0
$0
0
$0
0
$0
Aggregated Statistics For Year 2004 (Based on 2 partial tracts)
A) FHA, FSA/RHS & VA Home Purchase Loans
B) Conventional Home Purchase Loans
C) Refinancings
D) Home Improvement Loans
F) Non-occupant Loans on < 5 Family Dwellings (A B C & D)
G) Loans On Manufactured Home Dwelling (A B C & D)
Detailed PMIC statistics for the following Tracts:0214.00
2002 - 2016 National Fire Incident Reporting System (NFIRS) incidents
According to the data from the years 2002 - 2016 the average number of fires per year is 9. The highest number of reported fire incidents - 20 took place in 2008, and the least - 3 in 2011. The data has a declining trend.
When looking into fire subcategories, the most incidents belonged to: Outside Fires (47.4%), and Structure Fires (37.6%).
Fire incident types reported to NFIRS in Zip Code 24162

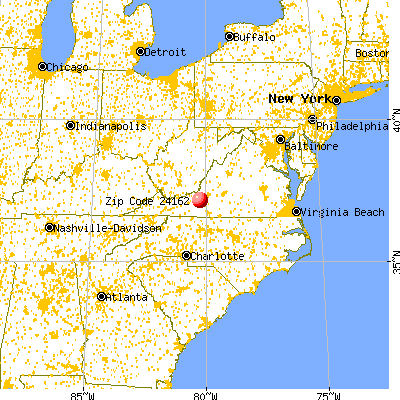


 Nearest zip codes: 24087, 24072, 24138, 24079, 24059, 24073.


 According to the data from the years 2002 - 2016 the average number of fires per year is 9. The highest number of reported fire incidents - 20 took place in 2008, and the least - 3 in 2011. The data has a declining trend.
 When looking into fire subcategories, the most incidents belonged to: Outside Fires (47.4%), and Structure Fires (37.6%).