Estimated zip code population in 2022: 2,423 Zip code population in 2010: 2,626 Zip code population in 2000: 2,578
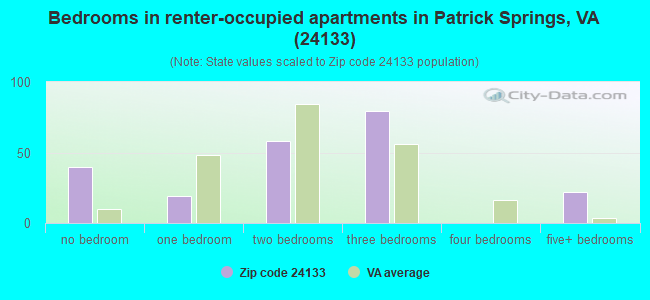
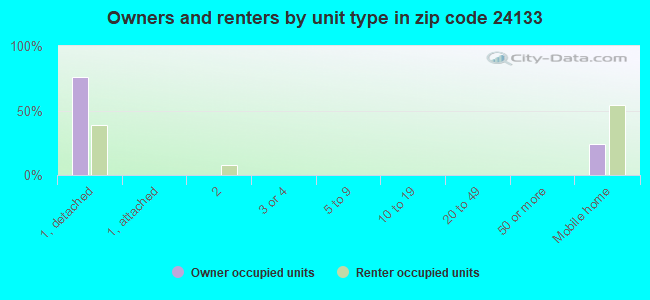
Houses and condos: 1,111 Renter-occupied apartments: 215
% of renters here:
22%
State:
33%
March 2022 cost of living index in zip code 24133: 83.5 (less than average, U.S. average is 100)
Land area: 43.3 sq. mi. Water area: 0.0 sq. mi.
Population density: 56 people per square mile
(very low).
OSM Map
General Map
Google Map
MSN Map
OSM Map
General Map
Google Map
MSN Map
OSM Map
General Map
Google Map
MSN Map
OSM Map
General Map
Google Map
MSN Map
Please wait while loading the map...
Real estate property taxes paid for housing units in 2022:
This zip code:
0.5% ($601)
Virginia:
0.7% ($2,617)
Median real estate property taxes paid for housing units with mortgages in 2022: $947 (0.6%) Median real estate property taxes paid for housing units with no mortgage in 2022: $493 (0.5%)
Business Search- 14 Million verified businesses
Males: 1,161
(47.9%)
Females: 1,262
(52.1%)
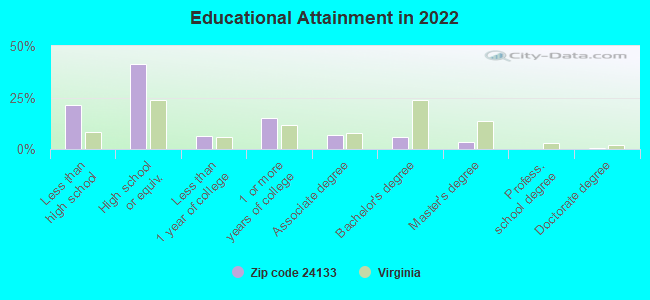
For population 25 years and over in 24133:
High school or higher: 76.6%
Bachelor's degree or higher: 9.6%
Graduate or professional degree: 3.9%
Unemployed: 0.8%
Mean travel time to work (commute): 29.6 minutes
For population 15 years and over in 24133:
Never married: 24.0%
Now married: 56.4%
Separated: 2.1%
Widowed: 4.6%
Divorced: 12.9%
Zip code 24133 compared to state average:
Median household income below state average.
Median house value significantly below state average.
Unemployed percentage significantly below state average.
Black race population percentage significantly below state average.
Hispanic race population percentage significantly below state average.
Median age above state average.
Foreign-born population percentage significantly below state average.
Renting percentage below state average.
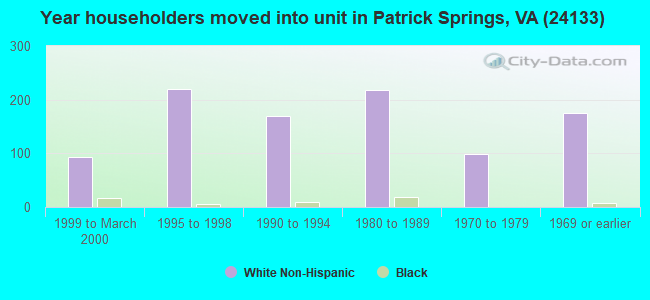
Length of stay since moving in significantly above state average.
Number of college students below state average.
Percentage of population with a bachelor's degree or higher significantly below state average.
Estimated median house/condo value in 2022: $121,183
24133:
$121,183
Virginia:
$365,700
According to our research of Virginia and other state lists, there were 7 registered sex offenders living in 24133 zip code as of May 28, 2024. The ratio of all residents to sex offenders in zip code 24133 is 363 to 1. The ratio of registered sex offenders to all residents in this zip code is near the state average.
Median resident age:
This zip code:
45.3 years
Virginia median age:
39.0 years
Average household size:
This zip code:
2.4 people
Virginia:
2.5 people
Averages for the 2020 tax year for zip code 24133, filed in 2021:
Average Adjusted Gross Income (AGI) in 2020: $43,257 (Individual Income Tax Returns)
Here:
$43,257
State:
$86,446
Salary/wage: $36,991 (reported on 85.8% of returns)
Here:
$36,991
State:
$71,185
(% of AGI for various income ranges: 1100.9% for AGIs below $25k, 3425.0% for AGIs $25k-50k, 6480.0% for AGIs $50k-75k, 9808.0% for AGIs $75k-100k, 16448.0% for AGIs $100k-200k)
Taxable interest for individuals: $604 (reported on 23.6% of returns)
This zip code:
$604
Virginia:
$1,805
(% of AGI for various income ranges: 6.9% for AGIs below $25k, 5.8% for AGIs $25k-50k, 35.8% for AGIs $50k-75k, 74.0% for AGIs $75k-100k, 64.0% for AGIs $100k-200k)
Ordinary dividends: $2,545 (reported on 10.4% of returns)
Here:
$2,545
State:
$8,327
(% of AGI for various income ranges: 5.4% for AGIs below $25k, 39.2% for AGIs $25k-50k, 109.2% for AGIs $50k-75k, 56.0% for AGIs $100k-200k)
Net capital gain/loss in AGI: +$5,100 (reported on 8.5% of returns)
Here:
+$5,100
State:
+$24,644
(% of AGI for various income ranges: 2.9% for AGIs below $25k, 6.7% for AGIs $50k-75k, 882.0% for AGIs $75k-100k)
Profit/loss from business: +$7,985 (reported on 12.3% of returns)
Here:
+$7,985
State:
+$12,836
(% of AGI for various income ranges: 54.0% for AGIs below $25k, 54.6% for AGIs $25k-50k, 192.5% for AGIs $50k-75k, 952.0% for AGIs $75k-100k)
Taxable individual retirement arrangement distribution: $9,138 (reported on 7.5% of returns)
24133:
$9,138
Virginia:
$21,535
(% of AGI for various income ranges: 46.3% for AGIs below $25k, 108.8% for AGIs $25k-50k, 238.3% for AGIs $50k-75k)
Total itemized deductions: $32,250 (reported on 1.9% of returns)
Here:
$32,250
State:
$33,287
(% of AGI for various income ranges: 248.1% for AGIs $25k-50k)
Taxes paid: $7,750 (reported on 1.9% of returns)
24133:
$7,750
State:
$8,284
(% of AGI for various income ranges: 59.6% for AGIs $25k-50k)
Earned income credit: $2,238 (reported on 22.6% of returns)
Here:
$2,238
State:
$2,214
(% of AGI for various income ranges: 94.3% for AGIs below $25k, 79.6% for AGIs $25k-50k)
Percentage of individuals using paid preparers for their 2020 taxes: 95.3%
Here:
95%
State:
92%
(% for various income ranges: 95.3% for AGIs below $25k, 93.5% for AGIs $25k-50k, 100.0% for AGIs $50k-75k, 100.0% for AGIs $75k-100k, 87.5% for AGIs $100k-200k)
Averages for the 2012 tax year for zip code 24133, filed in 2013:
Average Adjusted Gross Income (AGI) in 2012: $33,230 (Individual Income Tax Returns)
Here:
$33,230
State:
$71,192
Salary/wage: $31,340 (reported on 86.2% of returns)
Here:
$31,340
State:
$59,229
(% of AGI for various income ranges: 75.6% for AGIs below $25k, 85.8% for AGIs $25k-50k, 82.6% for AGIs $50k-75k, 83.9% for AGIs $75k-100k, 74.1% for AGIs $100k-200k)
Taxable interest for individuals: $748 (reported on 28.4% of returns)
This zip code:
$748
Virginia:
$1,600
(% of AGI for various income ranges: 1.5% for AGIs below $25k, 0.6% for AGIs $25k-50k, 0.4% for AGIs $50k-75k, 0.2% for AGIs $75k-100k, 0.4% for AGIs $100k-200k)
Ordinary dividends: $1,646 (reported on 11.9% of returns)
Here:
$1,646
State:
$6,959
(% of AGI for various income ranges: 0.5% for AGIs below $25k, 0.2% for AGIs $25k-50k, 1.1% for AGIs $50k-75k, 1.4% for AGIs $75k-100k)
Net capital gain/loss in AGI: +$871 (reported on 6.4% of returns)
Here:
+$871
State:
+$16,672
(% of AGI for various income ranges: 0.2% for AGIs below $25k, 0.4% for AGIs $25k-50k)
Profit/loss from business: +$5,987 (reported on 13.8% of returns)
Here:
+$5,987
State:
+$14,116
(% of AGI for various income ranges: 5.8% for AGIs below $25k, 1.8% for AGIs $25k-50k, 0.6% for AGIs $50k-75k, 4.2% for AGIs $75k-100k)
Taxable individual retirement arrangement distribution: $5,978 (reported on 8.3% of returns)
24133:
$5,978
Virginia:
$16,667
(% of AGI for various income ranges: 3.3% for AGIs below $25k, 1.1% for AGIs $25k-50k, 2.3% for AGIs $50k-75k)
Total itemized deductions: $17,100 (25% of AGI, reported on 11.9% of returns)
Here:
$17,100
State:
$26,596
Here:
25.1% of AGI
State:
20.1% of AGI
(% of AGI for various income ranges: 6.6% for AGIs $25k-50k, 6.9% for AGIs $50k-75k, 9.0% for AGIs $75k-100k, 9.7% for AGIs $100k-200k)
Charity contributions: $4,282 (reported on 10.1% of returns)
Here:
$4,282
State:
$4,443
(% of AGI for various income ranges: 1.5% for AGIs $25k-50k, 1.1% for AGIs $50k-75k, 3.8% for AGIs $75k-100k)
Taxes paid: $4,477 (reported on 11.9% of returns)
24133:
$4,477
State:
$9,951
(% of AGI for various income ranges: 1.0% for AGIs $25k-50k, 1.9% for AGIs $50k-75k, 2.8% for AGIs $75k-100k, 3.5% for AGIs $100k-200k)
Earned income credit: $2,226 (reported on 28.4% of returns)
Here:
$2,226
State:
$2,211
(% of AGI for various income ranges: 7.2% for AGIs below $25k, 1.6% for AGIs $25k-50k)
Percentage of individuals using paid preparers for their 2012 taxes: 68.8%
Here:
69%
State:
46%
(% for various income ranges: 64.8% for AGIs below $25k, 71.0% for AGIs $25k-50k, 76.9% for AGIs $50k-75k, 71.4% for AGIs $75k-100k, 75.0% for AGIs $100k-200k)
Averages for the 2004 tax year for zip code 24133, filed in 2005:
Average Adjusted Gross Income (AGI) in 2004: $28,399 (Individual Income Tax Returns)
Here:
$28,399
State:
$56,704
Salary/wage: $26,333 (reported on 89.0% of returns)
Here:
$26,333
State:
$48,441
(% of AGI for various income ranges: 163.7% for AGIs below $10k, 79.4% for AGIs $10k-25k, 83.3% for AGIs $25k-50k, 84.3% for AGIs $50k-75k, 85.0% for AGIs $75k-100k, 52.2% for AGIs over 100k)
Taxable interest for individuals: $950 (reported on 34.9% of returns)
This zip code:
$950
Virginia:
$1,688
(% of AGI for various income ranges: 3.4% for AGIs below $10k, 2.3% for AGIs $10k-25k, 0.9% for AGIs $25k-50k, 0.8% for AGIs $50k-75k, 0.4% for AGIs $75k-100k, 0.7% for AGIs over 100k)
Taxable dividends: $1,079 (reported on 12.1% of returns)
Here:
$1,079
State:
$4,028
(% of AGI for various income ranges: 1.4% for AGIs below $10k, 0.8% for AGIs $10k-25k, 0.2% for AGIs $25k-50k, 0.4% for AGIs $50k-75k, 0.7% for AGIs $75k-100k)
Net capital gain/loss: +$4,031 (reported on 8.5% of returns)
Here:
+$4,031
State:
+$14,375
(% of AGI for various income ranges: -0.8% for AGIs below $10k, 0.6% for AGIs $10k-25k, 0.7% for AGIs $25k-50k, 0.4% for AGIs $50k-75k, 7.4% for AGIs $75k-100k)
Profit/loss from business: +$4,351 (reported on 11.3% of returns)
Here:
+$4,351
State:
+$13,342
(% of AGI for various income ranges: -16.7% for AGIs below $10k, 3.9% for AGIs $10k-25k, 1.7% for AGIs $25k-50k, 2.0% for AGIs $50k-75k, 2.1% for AGIs $75k-100k)
IRA payment deduction: $3,000 (reported on 1.7% of returns)
24133:
$3,000
Virginia:
$2,943
Total itemized deductions: $13,733 (24% of AGI, reported on 15.2% of returns)
Here:
$13,733
State:
$21,492
Here:
24.3% of AGI
State:
21.0% of AGI
(% of AGI for various income ranges: 3.7% for AGIs $10k-25k, 6.1% for AGIs $25k-50k, 10.1% for AGIs $50k-75k, 11.5% for AGIs $75k-100k, 11.9% for AGIs over 100k)
Charity contributions deductions: $3,174 (5% of AGI, reported on 12.9% of returns)
Here:
$3,174
State:
$3,794
Here:
5.5% of AGI
State:
3.5% of AGI
(% of AGI for various income ranges: 0.8% for AGIs $10k-25k, 1.0% for AGIs $25k-50k, 1.8% for AGIs $50k-75k, 2.6% for AGIs $75k-100k, 3.3% for AGIs over 100k)
Total tax: $2,879 (reported on 69.3% of returns)
24133:
$2,879
State:
$9,537
(% of AGI for various income ranges: 3.5% for AGIs below $10k, 3.5% for AGIs $10k-25k, 6.0% for AGIs $25k-50k, 8.2% for AGIs $50k-75k, 10.1% for AGIs $75k-100k, 16.1% for AGIs over 100k)
Earned income credit: $1,758 (reported on 26.1% of returns)
Here:
$1,758
State:
$1,734
Percentage of individuals using paid preparers for their 2004 taxes: 78.0%
Here:
78%
State:
52%
(% for various income ranges: 74.6% for AGIs below $10k, 78.1% for AGIs $10k-25k, 78.9% for AGIs $25k-50k, 82.1% for AGIs $50k-75k, 74.4% for AGIs $75k-100k, 81.2% for AGIs over 100k)
Churches in zip code 24133 include: Salem Church (A), Stella Church (B), Goodwill Church (C), Liberty Church (D), Mayo Church (E), Mount Nemo Church (F), Patrick Springs Church (G), Pleasant View Church (H). Display/hide their locations on the map
Streams, rivers, and creeks: Spencer Creek (A), Polebridge Creek (B), Little Mill Creek (C), Laurel Branch (D), Grassy Branch (E). Display/hide their locations on the map
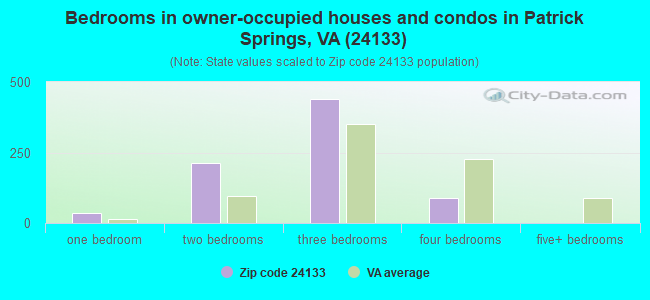
Size of family households: 260 2-persons, 131 3-persons, 102 4-persons, 74 5-persons, 16 7-or-more-persons
Size of nonfamily households: 279 1-person, 130 2-persons
371 married couples with children.
109 single-parent households (109 women).
99.7% of residents of 24133 zip code speak English at home.
0.4% of residents speak Asian or Pacific Island language at home (100% very well).
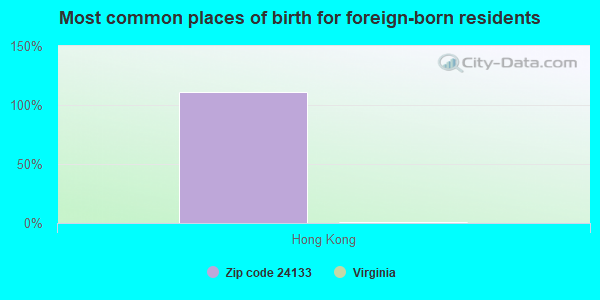
Foreign born population: 9 (0.4%) (100.0% of them are naturalized citizens)
This zip code:
0.4%
Whole state:
12.7%
111%Hong Kong
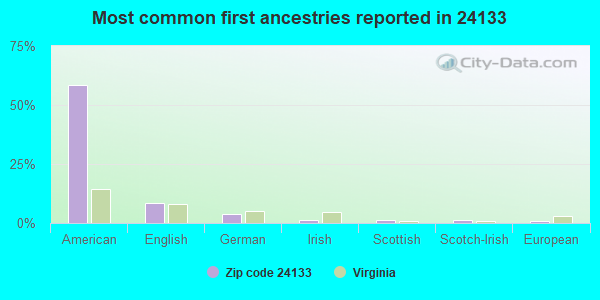
58%American
9%English
4%German
1%Irish
1%Scottish
1%Scotch-Irish
1%European
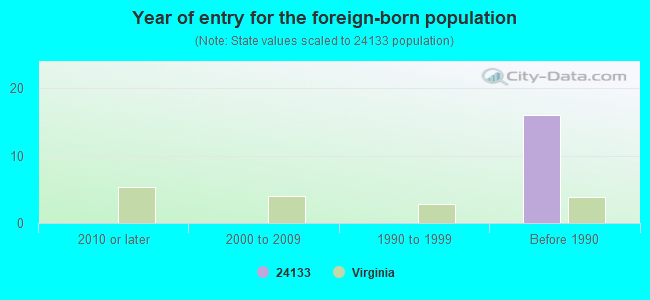
Year of entry for the foreign-born population
02010 or later
02000 to 2009
01990 to 1999
16Before 1990
Housing units lacking complete plumbing facilities: 3.4% Housing units lacking complete kitchen facilities: 5.7%
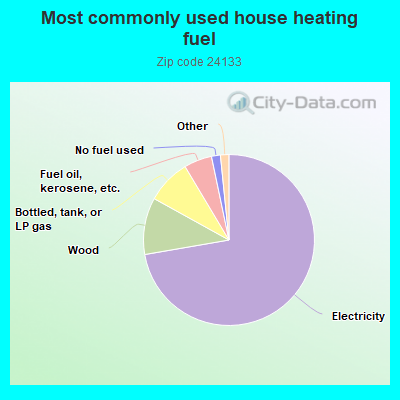
72.5%Electricity
10.8%Wood
8.4%Bottled, tank, or LP gas
5.3%Fuel oil, kerosene, etc.
1.7%No fuel used
0.8%Utility gas
0.8%Other fuel
Population in 1990: 2,789.
Place of birth for U.S.-born residents:
This state: 1,838
Northeast: 84
Midwest: 101
South: 342
West: 22
70% of the 24133 zip code residents lived in the same house 5 years ago. Out of people who lived in different houses, 46% lived in this county. Out of people who lived in different counties, 50% lived in Virginia.
97% of the 24133 zip code residents lived in the same house 1 year ago. Out of people who lived in different houses, 45% moved from this county. Out of people who lived in different houses, 69% moved from different county within same state.
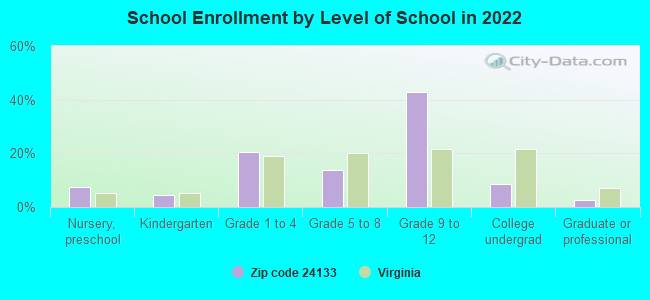
Private vs. public school enrollment:
Students in private schools in grades 1 to 8 (elementary and middle school): 8
Here:
4.1%
Virginia:
13.2%
Students in private schools in grades 9 to 12 (high school): 10
Here:
3.6%
Virginia:
10.2%
Students in private undergraduate colleges:
Here:
0.0%
Virginia:
18.7%
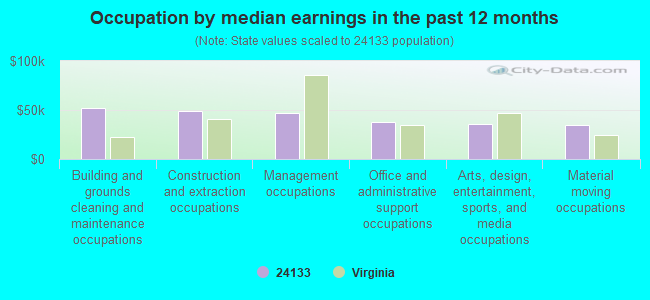
Occupation by median earnings in the past 12 months ($)
52,170Building and grounds cleaning and maintenance occupations
48,628Construction and extraction occupations
46,620Management occupations
38,249Office and administrative support occupations
35,764Arts, design, entertainment, sports, and media occupations
34,375Material moving occupations
Companies with federal contracts located in this zip code:
OPHUS C AGNEW (55 MAPLE STREET in PATRICK SPRING, VA; small business) : $42,120 in 5 contractsfrom 2004 to 2006
Contracts for Guard Services by Army, U.S. Army Corps of Engineers - civil program financing only Signed by year:2000: $0; 2001: $0; 2002: $0; 2003: $0; 2004: $32,760; 2005: $0; 2006: $9,360.
Biggest contracts:
$9,360 with Army for Guard Services. Signed on 2006-02-22. Completion date: 2006-10-31.
$8,580 with U.S. Army Corps of Engineers - civil program financing only for Guard Services. Signed on 2004-12-15. Completion date: 2005-09-30.
$8,580 with Army for Guard Services. Signed on 2004-12-15. Completion date: 2005-09-30.
$7,800 with U.S. Army Corps of Engineers - civil program financing only for Guard Services. Signed on 2004-02-18. Completion date: 2004-04-29.
Top industries in this zip code by the number of employees in 2005:
Construction: Commercial and Institutional Building Construction (20-49 employees: 1 establishment)
Construction: Electrical Contractors (5-9: 1)
Finance and Insurance: Commercial Banking (5-9: 1)
Fatal accident statistics in 2014:
Fatal accident count: 1
Vehicles involved in fatal accidents: 1
Fatal accidents caused by drunken drivers: 0
Fatalities: 1
Persons involved in fatal accidents: 1
Pedestrians involved in fatal accidents: 1
Fatal accident statistics in 2011:
Fatal accident count: 1
Vehicles involved in fatal accidents: 2
Fatal accidents caused by drunken drivers: 0
Fatalities: 1
Persons involved in fatal accidents: 2
Pedestrians involved in fatal accidents: 0
2002 - 2018 National Fire Incident Reporting System (NFIRS) incidents
Based on the data from the years 2002 - 2018 the average number of fires per year is 19. The highest number of reported fire incidents - 38 took place in 2007, and the least - 3 in 2002. The data has an increasing trend.
When looking into fire subcategories, the most reports belonged to: Structure Fires (47.2%), and Outside Fires (40.2%).
Fire incident types reported to NFIRS in Zip Code 24133

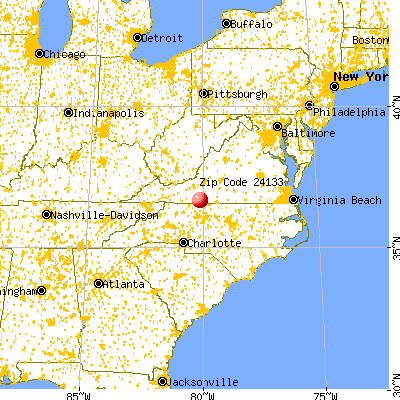


 Nearest zip codes: 24082, 24171, 24165, 24055, 24089, 27046.


 : $42,120 in 5 contracts from 2004 to 2006

 Based on the data from the years 2002 - 2018 the average number of fires per year is 19. The highest number of reported fire incidents - 38 took place in 2007, and the least - 3 in 2002. The data has an increasing trend.
 When looking into fire subcategories, the most reports belonged to: Structure Fires (47.2%), and Outside Fires (40.2%).