Estimated zip code population in 2022: 1,389 Zip code population in 2010: 1,613 Zip code population in 2000: 1,635
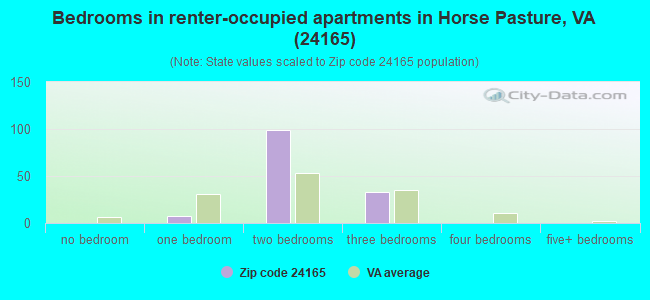
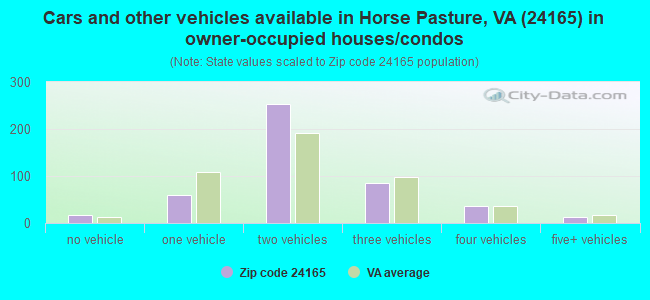
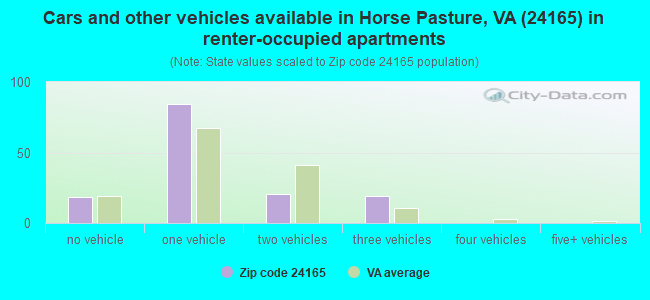
Houses and condos: 713 Renter-occupied apartments: 141
% of renters here:
23%
State:
33%
March 2022 cost of living index in zip code 24165: 83.4 (less than average, U.S. average is 100)
Land area: 43.4 sq. mi. Water area: 0.0 sq. mi.
Population density: 32 people per square mile
(very low).
OSM Map
General Map
Google Map
MSN Map
OSM Map
General Map
Google Map
MSN Map
OSM Map
General Map
Google Map
MSN Map
OSM Map
General Map
Google Map
MSN Map
Please wait while loading the map...
Real estate property taxes paid for housing units in 2022:
This zip code:
0.6% ($764)
Virginia:
0.7% ($2,617)
Median real estate property taxes paid for housing units with mortgages in 2022: $894 (0.5%) Median real estate property taxes paid for housing units with no mortgage in 2022: $640 (0.5%)
Business Search- 14 Million verified businesses
Males: 789
(56.8%)
Females: 599
(43.2%)
For population 25 years and over in 24165:
High school or higher: 84.6%
Bachelor's degree or higher: 7.7%
Graduate or professional degree: 2.9%
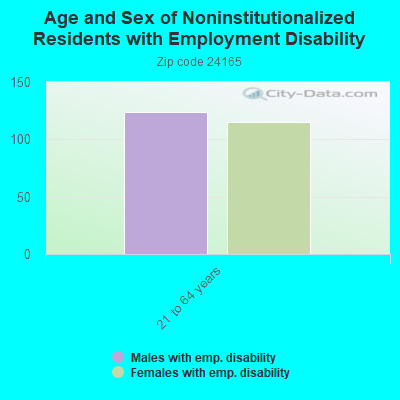
Unemployed: 4.0%
Mean travel time to work (commute): 24.2 minutes
For population 15 years and over in 24165:
Never married: 21.6%
Now married: 49.1%
Separated: 2.8%
Widowed: 10.3%
Divorced: 16.1%
Zip code 24165 compared to state average:
Median house value significantly below state average.
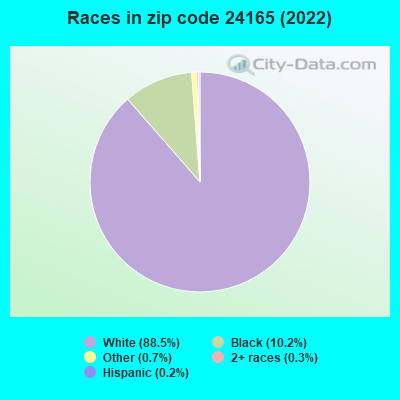
Black race population percentage below state average.
Hispanic race population percentage significantly below state average.
Median age significantly above state average.
Foreign-born population percentage significantly below state average.
Length of stay since moving in significantly above state average.
Number of college students below state average.
Percentage of population with a bachelor's degree or higher significantly below state average.
Averages for the 2020 tax year for zip code 24165, filed in 2021:
Average Adjusted Gross Income (AGI) in 2020: $43,570 (Individual Income Tax Returns)
Here:
$43,570
State:
$86,446
Salary/wage: $39,677 (reported on 84.9% of returns)
Here:
$39,677
State:
$71,185
(% of AGI for various income ranges: 1147.0% for AGIs below $25k, 3636.5% for AGIs $25k-50k, 7655.7% for AGIs $50k-75k, 9230.0% for AGIs $75k-100k, 16822.5% for AGIs $100k-200k)
Taxable interest for individuals: $721 (reported on 26.0% of returns)
This zip code:
$721
Virginia:
$1,805
(% of AGI for various income ranges: 5.2% for AGIs below $25k, 12.4% for AGIs $25k-50k, 90.0% for AGIs $50k-75k, 42.5% for AGIs $75k-100k, 60.0% for AGIs $100k-200k)
Ordinary dividends: $2,422 (reported on 12.3% of returns)
Here:
$2,422
State:
$8,327
(% of AGI for various income ranges: 30.0% for AGIs below $25k, 67.1% for AGIs $50k-75k, 255.0% for AGIs $100k-200k)
Net capital gain/loss in AGI: +$3,057 (reported on 9.6% of returns)
Here:
+$3,057
State:
+$24,644
(% of AGI for various income ranges: 50.0% for AGIs $25k-50k, 322.5% for AGIs $75k-100k)
Profit/loss from business: +$4,788 (reported on 11.0% of returns)
Here:
+$4,788
State:
+$12,836
(% of AGI for various income ranges: 41.7% for AGIs below $25k, 99.4% for AGIs $25k-50k, 168.6% for AGIs $50k-75k)
Taxable individual retirement arrangement distribution: $8,333 (reported on 8.2% of returns)
24165:
$8,333
Virginia:
$21,535
(% of AGI for various income ranges: 106.5% for AGIs below $25k, 364.3% for AGIs $50k-75k)
Total itemized deductions: $27,500 (reported on 2.7% of returns)
Here:
$27,500
State:
$33,287
(% of AGI for various income ranges: 323.5% for AGIs $25k-50k)
Earned income credit: $2,325 (reported on 21.9% of returns)
Here:
$2,325
State:
$2,214
(% of AGI for various income ranges: 103.5% for AGIs below $25k, 78.8% for AGIs $25k-50k)
Percentage of individuals using paid preparers for their 2020 taxes: 93.2%
Here:
93%
State:
92%
(% for various income ranges: 93.1% for AGIs below $25k, 95.2% for AGIs $25k-50k, 90.9% for AGIs $50k-75k, 83.3% for AGIs $75k-100k, 100.0% for AGIs $100k-200k)
Averages for the 2012 tax year for zip code 24165, filed in 2013:
Average Adjusted Gross Income (AGI) in 2012: $37,209 (Individual Income Tax Returns)
Here:
$37,209
State:
$71,192
Salary/wage: $33,656 (reported on 85.1% of returns)
Here:
$33,656
State:
$59,229
(% of AGI for various income ranges: 73.6% for AGIs below $25k, 81.8% for AGIs $25k-50k, 81.2% for AGIs $50k-75k, 65.3% for AGIs $75k-100k, 78.6% for AGIs $100k-200k)
Taxable interest for individuals: $967 (reported on 32.4% of returns)
This zip code:
$967
Virginia:
$1,600
(% of AGI for various income ranges: 0.9% for AGIs below $25k, 0.9% for AGIs $25k-50k, 1.0% for AGIs $50k-75k, 1.0% for AGIs $75k-100k, 0.4% for AGIs $100k-200k)
Ordinary dividends: $2,382 (reported on 14.9% of returns)
Here:
$2,382
State:
$6,959
(% of AGI for various income ranges: 1.1% for AGIs below $25k, 1.4% for AGIs $25k-50k, 2.4% for AGIs $75k-100k)
Net capital gain/loss in AGI: +$2,238 (reported on 10.8% of returns)
Here:
+$2,238
State:
+$16,672
(% of AGI for various income ranges: 0.1% for AGIs below $25k, 1.1% for AGIs $25k-50k, 2.1% for AGIs $75k-100k)
Profit/loss from business: +$4,436 (reported on 14.9% of returns)
Here:
+$4,436
State:
+$14,116
(% of AGI for various income ranges: 6.4% for AGIs below $25k, 1.6% for AGIs $25k-50k, 1.0% for AGIs $50k-75k)
Taxable individual retirement arrangement distribution: $8,367 (reported on 8.1% of returns)
24165:
$8,367
Virginia:
$16,667
Total itemized deductions: $16,485 (24% of AGI, reported on 17.6% of returns)
Here:
$16,485
State:
$26,596
Here:
24.3% of AGI
State:
20.1% of AGI
(% of AGI for various income ranges: 4.9% for AGIs below $25k, 6.8% for AGIs $25k-50k, 7.4% for AGIs $50k-75k, 8.7% for AGIs $75k-100k, 11.8% for AGIs $100k-200k)
Charity contributions: $4,200 (reported on 14.9% of returns)
Here:
$4,200
State:
$4,443
(% of AGI for various income ranges: 2.0% for AGIs $25k-50k, 2.8% for AGIs $50k-75k, 3.0% for AGIs $100k-200k)
Taxes paid: $4,185 (reported on 17.6% of returns)
24165:
$4,185
State:
$9,951
(% of AGI for various income ranges: 1.4% for AGIs $25k-50k, 1.7% for AGIs $50k-75k, 2.5% for AGIs $75k-100k, 4.7% for AGIs $100k-200k)
Earned income credit: $2,214 (reported on 29.7% of returns)
Here:
$2,214
State:
$2,211
(% of AGI for various income ranges: 8.1% for AGIs below $25k, 1.3% for AGIs $25k-50k)
Percentage of individuals using paid preparers for their 2012 taxes: 68.9%
Here:
69%
State:
46%
(% for various income ranges: 62.9% for AGIs below $25k, 70.0% for AGIs $25k-50k, 80.0% for AGIs $50k-75k, 80.0% for AGIs $75k-100k, 75.0% for AGIs $100k-200k)
Averages for the 2004 tax year for zip code 24165, filed in 2005:
Average Adjusted Gross Income (AGI) in 2004: $31,045 (Individual Income Tax Returns)
Here:
$31,045
State:
$56,704
Salary/wage: $27,352 (reported on 86.3% of returns)
Here:
$27,352
State:
$48,441
(% of AGI for various income ranges: 90.2% for AGIs below $10k, 78.9% for AGIs $10k-25k, 78.6% for AGIs $25k-50k, 81.8% for AGIs $50k-75k, 74.0% for AGIs $75k-100k, 51.9% for AGIs over 100k)
Taxable interest for individuals: $976 (reported on 41.6% of returns)
This zip code:
$976
Virginia:
$1,688
(% of AGI for various income ranges: 4.0% for AGIs below $10k, 1.5% for AGIs $10k-25k, 1.4% for AGIs $25k-50k, 1.1% for AGIs $50k-75k, 1.3% for AGIs $75k-100k, 0.4% for AGIs over 100k)
Taxable dividends: $2,236 (reported on 16.6% of returns)
Here:
$2,236
State:
$4,028
(% of AGI for various income ranges: 2.9% for AGIs below $10k, 1.5% for AGIs $10k-25k, 0.9% for AGIs $25k-50k, 0.7% for AGIs $50k-75k, 1.7% for AGIs $75k-100k, 1.4% for AGIs over 100k)
Net capital gain/loss: +$2,467 (reported on 10.3% of returns)
Here:
+$2,467
State:
+$14,375
(% of AGI for various income ranges: -0.0% for AGIs $10k-25k, 1.2% for AGIs $25k-50k, 0.9% for AGIs $50k-75k, 1.9% for AGIs $75k-100k)
Profit/loss from business: +$5,932 (reported on 9.9% of returns)
Here:
+$5,932
State:
+$13,342
(% of AGI for various income ranges: 3.6% for AGIs below $10k, 1.2% for AGIs $10k-25k, 3.9% for AGIs $25k-50k, 1.8% for AGIs $50k-75k)
IRA payment deduction: $2,083 (reported on 1.3% of returns)
24165:
$2,083
Virginia:
$2,943
Total itemized deductions: $14,178 (25% of AGI, reported on 17.1% of returns)
Here:
$14,178
State:
$21,492
Here:
24.6% of AGI
State:
21.0% of AGI
(% of AGI for various income ranges: 5.7% for AGIs $10k-25k, 8.3% for AGIs $25k-50k, 6.8% for AGIs $50k-75k, 10.8% for AGIs $75k-100k, 10.5% for AGIs over 100k)
Charity contributions deductions: $3,492 (6% of AGI, reported on 14.4% of returns)
Here:
$3,492
State:
$3,794
Here:
5.9% of AGI
State:
3.5% of AGI
(% of AGI for various income ranges: 0.7% for AGIs $10k-25k, 1.7% for AGIs $25k-50k, 1.5% for AGIs $50k-75k, 2.4% for AGIs $75k-100k, 2.6% for AGIs over 100k)
Total tax: $3,538 (reported on 68.7% of returns)
24165:
$3,538
State:
$9,537
(% of AGI for various income ranges: 1.4% for AGIs below $10k, 3.2% for AGIs $10k-25k, 6.1% for AGIs $25k-50k, 8.6% for AGIs $50k-75k, 10.7% for AGIs $75k-100k, 16.8% for AGIs over 100k)
Earned income credit: $1,577 (reported on 21.3% of returns)
Here:
$1,577
State:
$1,734
Percentage of individuals using paid preparers for their 2004 taxes: 79.0%
Here:
79%
State:
52%
(% for various income ranges: 70.1% for AGIs below $10k, 80.8% for AGIs $10k-25k, 81.0% for AGIs $25k-50k, 81.0% for AGIs $50k-75k, 86.4% for AGIs $75k-100k, 78.3% for AGIs over 100k)
Household received Food Stamps/SNAP in the past 12 months: 114 Household did not receive Food Stamps/SNAP in the past 12 months: 498
Women who had a birth in the past 12 months: 8 (8 now married, 0 unmarried) Women who did not have a birth in the past 12 months: 189 (123 now married, 64 unmarried)
Housing units in zip code 24165 with a mortgage: 187 Houses without a mortgage: 57
Median monthly owner costs for units with a mortgage: $1,141 Median monthly owner costs for units without a mortgage: $271
Residents with income below the poverty level in 2022:
This zip code:
16.2%
Whole state:
10.6%
Residents with income below 50% of the poverty level in 2022:
This zip code:
4.5%
Whole state:
5.2%
Median number of rooms in houses and condos:
Here:
6.5
State:
7.0
Median number of rooms in apartments:
Here:
4.2
State:
4.3
Notable locations in this zip code not listed on our city pages
Notable locations in zip code 24165: Gordon Trent Golf Club (A), Trent Store (B), Penns Store (C), Horsepasture Volunteer Rescue Squad (D). Display/hide their locations on the map
Churches in zip code 24165 include: Red Hollow Church (A), Blue Ridge Church (B), Christian View Church (C), Mayo Church (D), Meadow Church (E), Old Well Church (F), Pleasant Ridge Church (G). Display/hide their locations on the map
Streams, rivers, and creeks: Price Branch (A), Muddy Creek (B), Mill Creek (C), Koger Creek (D), Jackson Branch (E), Green Creek (F), Back Creek (G). Display/hide their locations on the map
Size of family households: 205 2-persons, 40 3-persons, 66 4-persons, 30 5-persons
Size of nonfamily households: 177 1-person, 32 2-persons, 52 4-persons
165 married couples with children.
1 single-parent households (1 men).
98.3% of residents of 24165 zip code speak English at home.
1.7% of residents speak Spanish at home (100% very well).
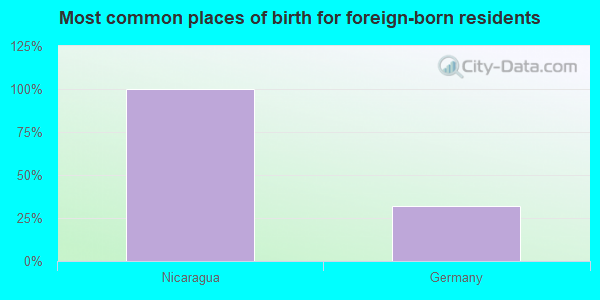
Foreign born population: 18 (1.3%) (0.0% of them are naturalized citizens)
:
1.3%
Whole state:
12.7%
100%Nicaragua
32%Germany
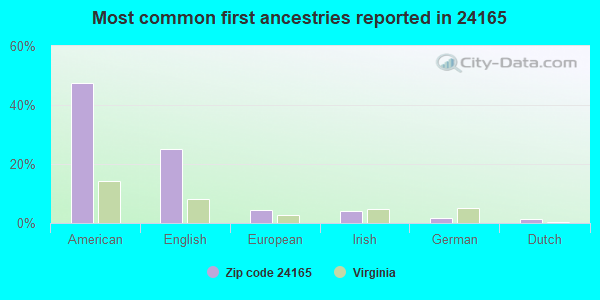
48%American
25%English
4%European
4%Irish
2%German
1%Dutch
Year of entry for the foreign-born population
552010 or later
02000 to 2009
181990 to 1999
0Before 1990
Facilities with environmental interests located in this zip code:
AT&T-SPENCER -VA2160 (RTE 687 W OF MARTINSVILLE in SPENCER, VA)
Conditionally Exempt Small Quantity Generators, less than 100 kg/month of hazardous waste (Resource Conservation and Recovery Act (tracking hazardous waste)) - notification Organizations: AT&T COMMUNICATIONS (CONTACT/OWNER)
Housing units lacking complete plumbing facilities: 4.5% Housing units lacking complete kitchen facilities: 1.1%
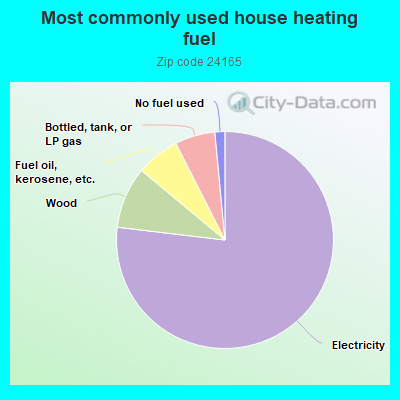
77.2%Electricity
9.2%Wood
6.5%Fuel oil, kerosene, etc.
6.0%Bottled, tank, or LP gas
1.5%No fuel used
Population in 1990: 1,537. Population change in the 1990s: +98 (+6.4%).
Place of birth for U.S.-born residents:
This state: 992
Northeast: 12
Midwest: 9
South: 295
West: 3
71% of the 24165 zip code residents lived in the same house 5 years ago. Out of people who lived in different houses, 77% lived in this county. Out of people who lived in different counties, 50% lived in Virginia.
89% of the 24165 zip code residents lived in the same house 1 year ago. Out of people who lived in different houses, 53% moved from this county. Out of people who lived in different houses, 16% moved from different county within same state. Out of people who lived in different houses, 14% moved from different state. Out of people who lived in different houses, 15% moved from abroad.
Private vs. public school enrollment:
Students in private schools in grades 1 to 8 (elementary and middle school): 14
Here:
12.3%
Virginia:
13.2%
Students in private schools in grades 9 to 12 (high school):
Here:
0.0%
Virginia:
10.2%
Students in private undergraduate colleges:
Here:
0.0%
Virginia:
18.7%
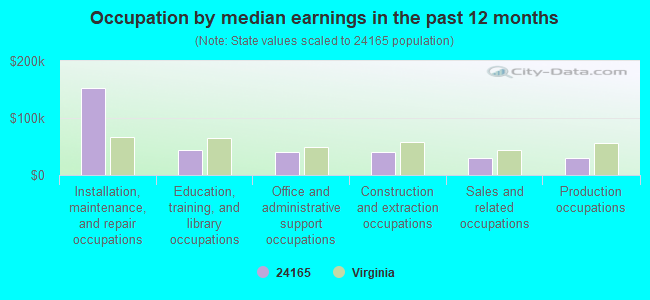
Occupation by median earnings in the past 12 months ($)
152,640Installation, maintenance, and repair occupations
44,308Education, training, and library occupations
40,953Office and administrative support occupations
40,509Construction and extraction occupations
30,159Sales and related occupations
30,033Production occupations
Top industries in this zip code by the number of employees in 2005:
Construction: Plumbing, Heating, and Air-Conditioning Contractors (5-9 employees: 1 establishment)
Other Services (except Public Administration): Religious Organizations (1-4: 2)
Construction: Flooring Contractors (1-4: 1)
Finance and Insurance: All Other Insurance Related Activities (1-4: 1)
Fatal accident statistics in 2013:
Fatal accident count: 2
Vehicles involved in fatal accidents: 3
Fatal accidents caused by drunken drivers: 1
Fatalities: 2
Persons involved in fatal accidents: 4
Pedestrians involved in fatal accidents: 0
Fatal accident statistics in 2010:
Fatal accident count: 1
Vehicles involved in fatal accidents: 2
Fatal accidents caused by drunken drivers: 1
Fatalities: 1
Persons involved in fatal accidents: 6
Pedestrians involved in fatal accidents: 0
2003 - 2018 National Fire Incident Reporting System (NFIRS) incidents
According to the data from the years 2003 - 2018 the average number of fires per year is 10. The highest number of reported fire incidents - 21 took place in 2006, and the least - 2 in 2016. The data has a declining trend.
When looking into fire subcategories, the most incidents belonged to: Structure Fires (41.9%), and Outside Fires (34.1%).
Fire incident types reported to NFIRS in Zip Code 24165


 Nearest zip codes: 24082, 27046, 24133, 24089, 27027, 27048.


 According to the data from the years 2003 - 2018 the average number of fires per year is 10. The highest number of reported fire incidents - 21 took place in 2006, and the least - 2 in 2016. The data has a declining trend.
 When looking into fire subcategories, the most incidents belonged to: Structure Fires (41.9%), and Outside Fires (34.1%).