Estimated zip code population in 2022: 5,769 Zip code population in 2010: 6,572 Zip code population in 2000: 6,884
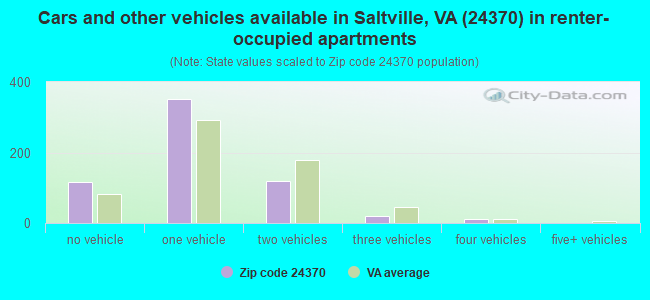
Houses and condos: 3,055 Renter-occupied apartments: 611
% of renters here:
25%
State:
33%
March 2022 cost of living index in zip code 24370: 82.3 (low, U.S. average is 100)
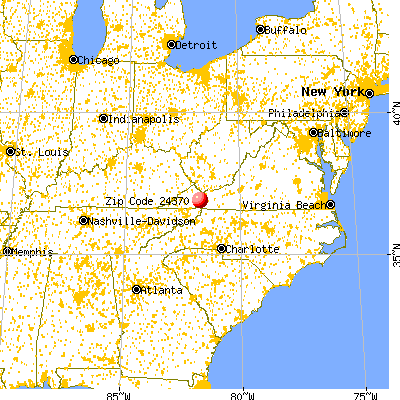
Land area: 150.5 sq. mi. Water area: 0.8 sq. mi.
Population density: 38 people per square mile
(very low).
OSM Map
General Map
Google Map
MSN Map
OSM Map
General Map
Google Map
MSN Map
OSM Map
General Map
Google Map
MSN Map
OSM Map
General Map
Google Map
MSN Map
Please wait while loading the map...
Real estate property taxes paid for housing units in 2022:
This zip code:
0.6% ($585)
Virginia:
0.7% ($2,617)
Median real estate property taxes paid for housing units with mortgages in 2022: $644 (0.5%) Median real estate property taxes paid for housing units with no mortgage in 2022: $544 (0.6%)
Business Search- 14 Million verified businesses
Males: 2,891
(50.1%)
Females: 2,877
(49.9%)
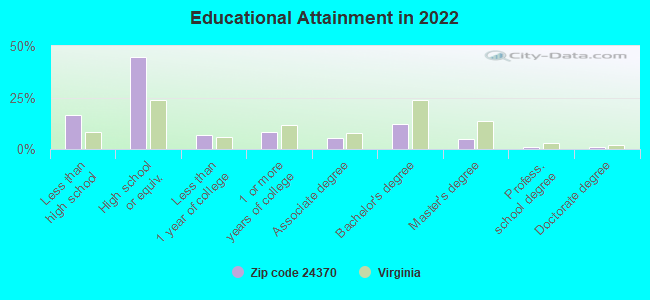
For population 25 years and over in 24370:
High school or higher: 82.6%
Bachelor's degree or higher: 18.5%
Graduate or professional degree: 6.6%
Unemployed: 5.2%
Mean travel time to work (commute): 28.2 minutes
For population 15 years and over in 24370:
Never married: 24.1%
Now married: 52.5%
Separated: 3.0%
Widowed: 8.5%
Divorced: 11.8%
Zip code 24370 compared to state average:
Median household income below state average.
Median house value significantly below state average.
Black race population percentage significantly below state average.
Hispanic race population percentage significantly below state average.
Median age above state average.
Foreign-born population percentage significantly below state average.
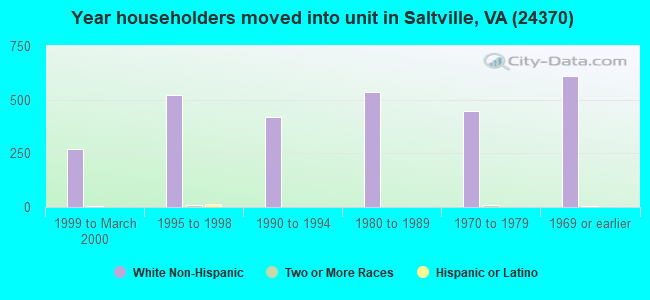
Length of stay since moving in significantly above state average.
House age above state average.
Number of college students below state average.
Percentage of population with a bachelor's degree or higher below state average.
Averages for the 2020 tax year for zip code 24370, filed in 2021:
Average Adjusted Gross Income (AGI) in 2020: $41,585 (Individual Income Tax Returns)
Here:
$41,585
State:
$86,446
Salary/wage: $38,014 (reported on 84.1% of returns)
Here:
$38,014
State:
$71,185
(% of AGI for various income ranges: 1094.4% for AGIs below $25k, 3469.8% for AGIs $25k-50k, 6019.1% for AGIs $50k-75k, 8631.3% for AGIs $75k-100k, 18163.0% for AGIs $100k-200k)
Taxable interest for individuals: $870 (reported on 20.8% of returns)
This zip code:
$870
Virginia:
$1,805
(% of AGI for various income ranges: 12.8% for AGIs below $25k, 16.9% for AGIs $25k-50k, 35.2% for AGIs $50k-75k, 67.3% for AGIs $75k-100k, 36.0% for AGIs $100k-200k)
Ordinary dividends: $2,721 (reported on 6.2% of returns)
Here:
$2,721
State:
$8,327
(% of AGI for various income ranges: 7.3% for AGIs below $25k, 7.6% for AGIs $25k-50k, 49.6% for AGIs $50k-75k, 97.3% for AGIs $75k-100k, 23.0% for AGIs $100k-200k)
Net capital gain/loss in AGI: +$7,083 (reported on 5.3% of returns)
Here:
+$7,083
State:
+$24,644
(% of AGI for various income ranges: 3.8% for AGIs below $25k, 26.1% for AGIs $25k-50k, 10.0% for AGIs $50k-75k, 44.0% for AGIs $75k-100k, 590.0% for AGIs $100k-200k)
Profit/loss from business: +$9,058 (reported on 10.6% of returns)
Here:
+$9,058
State:
+$12,836
(% of AGI for various income ranges: 83.2% for AGIs below $25k, 67.2% for AGIs $25k-50k, 203.0% for AGIs $50k-75k, 204.7% for AGIs $75k-100k, 388.0% for AGIs $100k-200k)
Taxable individual retirement arrangement distribution: $9,920 (reported on 6.6% of returns)
24370:
$9,920
Virginia:
$21,535
(% of AGI for various income ranges: 46.4% for AGIs below $25k, 28.7% for AGIs $25k-50k, 134.3% for AGIs $50k-75k, 441.3% for AGIs $75k-100k)
Total itemized deductions: $36,933 (reported on 1.3% of returns)
Here:
$36,933
State:
$33,287
(% of AGI for various income ranges: 738.7% for AGIs $75k-100k)
Charity contributions: $11,050 (reported on 0.9% of returns)
Here:
$11,050
State:
$10,381
(% of AGI for various income ranges: 40.9% for AGIs $25k-50k)
Taxes paid: $7,267 (reported on 1.3% of returns)
24370:
$7,267
State:
$8,284
(% of AGI for various income ranges: 145.3% for AGIs $75k-100k)
Earned income credit: $2,200 (reported on 23.9% of returns)
Here:
$2,200
State:
$2,214
(% of AGI for various income ranges: 96.0% for AGIs below $25k, 81.3% for AGIs $25k-50k)
Percentage of individuals using paid preparers for their 2020 taxes: 93.8%
Here:
94%
State:
92%
(% for various income ranges: 93.8% for AGIs below $25k, 95.2% for AGIs $25k-50k, 93.3% for AGIs $50k-75k, 90.0% for AGIs $75k-100k, 94.1% for AGIs $100k-200k)
Averages for the 2012 tax year for zip code 24370, filed in 2013:
Average Adjusted Gross Income (AGI) in 2012: $35,645 (Individual Income Tax Returns)
Here:
$35,645
State:
$71,192
Salary/wage: $33,668 (reported on 87.3% of returns)
Here:
$33,668
State:
$59,229
(% of AGI for various income ranges: 78.3% for AGIs below $25k, 85.4% for AGIs $25k-50k, 83.9% for AGIs $50k-75k, 82.7% for AGIs $75k-100k, 77.6% for AGIs $100k-200k)
Taxable interest for individuals: $1,047 (reported on 21.6% of returns)
This zip code:
$1,047
Virginia:
$1,600
(% of AGI for various income ranges: 1.0% for AGIs below $25k, 0.8% for AGIs $25k-50k, 0.5% for AGIs $50k-75k, 0.4% for AGIs $75k-100k, 0.4% for AGIs $100k-200k)
Ordinary dividends: $793 (reported on 5.9% of returns)
Here:
$793
State:
$6,959
(% of AGI for various income ranges: 0.2% for AGIs below $25k, 0.2% for AGIs $50k-75k, 0.1% for AGIs $100k-200k)
Net capital gain/loss in AGI: +$3,386 (reported on 5.9% of returns)
Here:
+$3,386
State:
+$16,672
(% of AGI for various income ranges: 0.1% for AGIs below $25k, 0.3% for AGIs $25k-50k, 0.8% for AGIs $50k-75k, 1.6% for AGIs $75k-100k)
Profit/loss from business: +$6,244 (reported on 10.6% of returns)
Here:
+$6,244
State:
+$14,116
(% of AGI for various income ranges: 5.9% for AGIs below $25k, 1.7% for AGIs $25k-50k, 0.8% for AGIs $50k-75k, 1.3% for AGIs $75k-100k)
Taxable individual retirement arrangement distribution: $7,833 (reported on 7.6% of returns)
24370:
$7,833
Virginia:
$16,667
(% of AGI for various income ranges: 2.8% for AGIs below $25k, 1.2% for AGIs $25k-50k, 2.3% for AGIs $50k-75k, 1.9% for AGIs $75k-100k)
Total itemized deductions: $18,420 (24% of AGI, reported on 10.6% of returns)
Here:
$18,420
State:
$26,596
Here:
24.4% of AGI
State:
20.1% of AGI
(% of AGI for various income ranges: 3.6% for AGIs below $25k, 3.1% for AGIs $25k-50k, 5.0% for AGIs $50k-75k, 7.6% for AGIs $75k-100k, 11.1% for AGIs $100k-200k)
Charity contributions: $3,961 (reported on 7.6% of returns)
Here:
$3,961
State:
$4,443
(% of AGI for various income ranges: 0.4% for AGIs $25k-50k, 0.8% for AGIs $50k-75k, 1.5% for AGIs $75k-100k, 2.1% for AGIs $100k-200k)
Taxes paid: $4,808 (reported on 10.6% of returns)
24370:
$4,808
State:
$9,951
(% of AGI for various income ranges: 0.4% for AGIs below $25k, 0.6% for AGIs $25k-50k, 1.2% for AGIs $50k-75k, 2.1% for AGIs $75k-100k, 4.1% for AGIs $100k-200k)
Earned income credit: $2,146 (reported on 27.5% of returns)
Here:
$2,146
State:
$2,211
(% of AGI for various income ranges: 7.6% for AGIs below $25k, 1.6% for AGIs $25k-50k)
Percentage of individuals using paid preparers for their 2012 taxes: 60.6%
Here:
61%
State:
46%
(% for various income ranges: 56.6% for AGIs below $25k, 63.0% for AGIs $25k-50k, 59.4% for AGIs $50k-75k, 64.7% for AGIs $75k-100k, 87.5% for AGIs $100k-200k)
Averages for the 2004 tax year for zip code 24370, filed in 2005:
Average Adjusted Gross Income (AGI) in 2004: $28,994 (Individual Income Tax Returns)
Here:
$28,994
State:
$56,704
Salary/wage: $28,010 (reported on 87.5% of returns)
Here:
$28,010
State:
$48,441
(% of AGI for various income ranges: 96.2% for AGIs below $10k, 80.6% for AGIs $10k-25k, 88.7% for AGIs $25k-50k, 88.5% for AGIs $50k-75k, 82.8% for AGIs $75k-100k, 56.3% for AGIs over 100k)
Taxable interest for individuals: $974 (reported on 30.3% of returns)
This zip code:
$974
Virginia:
$1,688
(% of AGI for various income ranges: 3.1% for AGIs below $10k, 1.8% for AGIs $10k-25k, 1.0% for AGIs $25k-50k, 0.5% for AGIs $50k-75k, 0.5% for AGIs $75k-100k, 0.7% for AGIs over 100k)
Taxable dividends: $846 (reported on 8.3% of returns)
Here:
$846
State:
$4,028
(% of AGI for various income ranges: 0.7% for AGIs below $10k, 0.2% for AGIs $10k-25k, 0.3% for AGIs $25k-50k, 0.1% for AGIs $50k-75k, 0.2% for AGIs $75k-100k, 0.5% for AGIs over 100k)
Net capital gain/loss: +$5,322 (reported on 5.8% of returns)
Here:
+$5,322
State:
+$14,375
(% of AGI for various income ranges: 0.0% for AGIs below $10k, 0.1% for AGIs $10k-25k, 0.3% for AGIs $25k-50k, 0.5% for AGIs $50k-75k, 0.4% for AGIs $75k-100k, 12.4% for AGIs over 100k)
Profit/loss from business: +$5,898 (reported on 12.9% of returns)
Here:
+$5,898
State:
+$13,342
(% of AGI for various income ranges: 7.6% for AGIs below $10k, 3.9% for AGIs $10k-25k, 3.0% for AGIs $25k-50k, 1.2% for AGIs $50k-75k, 2.7% for AGIs $75k-100k)
IRA payment deduction: $2,694 (reported on 2.0% of returns)
24370:
$2,694
Virginia:
$2,943
Total itemized deductions: $14,123 (23% of AGI, reported on 9.4% of returns)
Here:
$14,123
State:
$21,492
Here:
22.6% of AGI
State:
21.0% of AGI
(% of AGI for various income ranges: 2.5% for AGIs $10k-25k, 3.4% for AGIs $25k-50k, 5.2% for AGIs $50k-75k, 8.1% for AGIs $75k-100k, 9.7% for AGIs over 100k)
Charity contributions deductions: $2,834 (4% of AGI, reported on 7.0% of returns)
Here:
$2,834
State:
$3,794
Here:
4.2% of AGI
State:
3.5% of AGI
(% of AGI for various income ranges: 0.3% for AGIs $10k-25k, 0.4% for AGIs $25k-50k, 0.9% for AGIs $50k-75k, 1.5% for AGIs $75k-100k, 1.4% for AGIs over 100k)
Total tax: $3,032 (reported on 70.5% of returns)
24370:
$3,032
State:
$9,537
(% of AGI for various income ranges: 3.4% for AGIs below $10k, 3.6% for AGIs $10k-25k, 6.1% for AGIs $25k-50k, 8.5% for AGIs $50k-75k, 10.4% for AGIs $75k-100k, 16.6% for AGIs over 100k)
Earned income credit: $1,535 (reported on 23.1% of returns)
Here:
$1,535
State:
$1,734
Percentage of individuals using paid preparers for their 2004 taxes: 69.5%
Here:
70%
State:
52%
(% for various income ranges: 61.2% for AGIs below $10k, 72.2% for AGIs $10k-25k, 72.4% for AGIs $25k-50k, 69.4% for AGIs $50k-75k, 69.2% for AGIs $75k-100k, 96.8% for AGIs over 100k)
Household received Food Stamps/SNAP in the past 12 months: 570 Household did not receive Food Stamps/SNAP in the past 12 months: 1,943
Women who had a birth in the past 12 months: 52 (23 now married, 27 unmarried) Women who did not have a birth in the past 12 months: 1,156 (540 now married, 613 unmarried)
Housing units in zip code 24370 with a mortgage: 740 (38 second mortgage, 15 home equity loan, 18 both second mortgage and home equity loan) Houses without a mortgage: 57
Median monthly owner costs for units with a mortgage: $946 Median monthly owner costs for units without a mortgage: $324
Residents with income below the poverty level in 2022:
This zip code:
23.9%
Whole state:
10.6%
Residents with income below 50% of the poverty level in 2022:
This zip code:
14.0%
Whole state:
5.2%
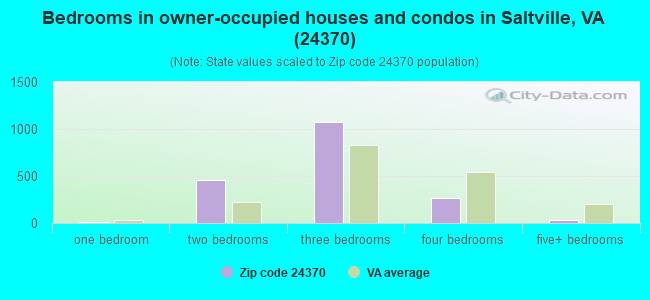
Median number of rooms in houses and condos:
Here:
6.2
State:
7.0
Median number of rooms in apartments:
Here:
5.4
State:
4.3
Notable locations in this zip code not listed on our city pages
Notable locations in zip code 24370: Old Broad Ford (A), White Rock (B), Broady Bottom (C), Redrock Camp (D), Hayters Gap (E). Display/hide their locations on the map
Churches in zip code 24370 include: Anderson Church (A), Goodman Chapel (B), Macedonia Church (C), McCray Chapel (D), Mount Pleasant Church (E), Mountain View Church (F), New Bethel Church (G), New Cove Church (H), Oak Grove Church (I). Display/hide their locations on the map
Cemeteries: Olinger Cemetery (1), Orr Cemetery (2), Parker Cemetery (3), Poore Cemetery (4), Richardson Cemetery (5), Roberts Cemetery (6), Scott Hill Cemetery (7). Display/hide their locations on the map
Streams, rivers, and creeks: McHenry Creek (A), Woodward Cove Branch (B), Wolf Creek (C), White Oak Branch (D), Watson Gap Branch (E), Van Hook Branch (F), Turkey Run Creek (G), Stonemill Creek (H), Sprouts Creek (I). Display/hide their locations on the map
Size of family households: 762 2-persons, 341 3-persons, 228 4-persons, 144 5-persons, 146 6-persons, 6 7-or-more-persons
Size of nonfamily households: 738 1-person, 101 2-persons
392 married couples with children.
512 single-parent households (324 men, 188 women).
98.0% of residents of 24370 zip code speak English at home.
1.1% of residents speak Spanish at home (100% very well).
0.8% of residents speak other Indo-European language at home (39% very well, 23% well, 39% not well).
0.2% of residents speak other language at home (100% very well).
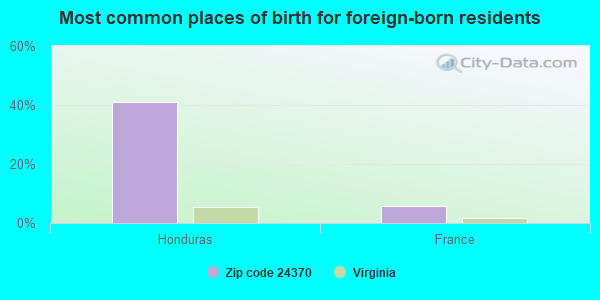
Foreign born population: 100 (1.7%) (12.7% of them are naturalized citizens)
This zip code:
1.7%
Whole state:
12.7%
41%Honduras
6%France
55%American
20%English
4%Irish
4%German
2%Scotch-Irish
1%European
1%Welsh
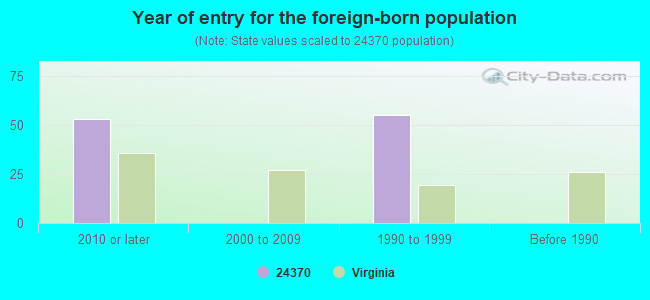
Year of entry for the foreign-born population
532010 or later
02000 to 2009
551990 to 1999
0Before 1990
Facilities with environmental interests located in this zip code:
ACCO BABCOCK INCORPORATED (ROUTE 91 NORTH in SALTVILLE, VA)
AIR MINOR (AIRS/AFS) Conditionally Exempt Small Quantity Generators, less than 100 kg/month of hazardous waste (Resource Conservation and Recovery Act (tracking hazardous waste)) Business SIC classification: OVERHEAD TRAVELING CRANES, HOISTS, AND MONORAIL SYSTEMS Organizations: OPERNAME (CONTACT/OPERATOR)
Alternative names: ACCO CHAIN & LIFTING PRODUCTS
Housing units lacking complete plumbing facilities: 6.3% Housing units lacking complete kitchen facilities: 6.3%
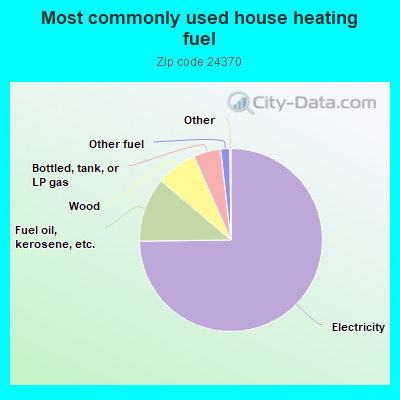
74.8%Electricity
11.4%Fuel oil, kerosene, etc.
7.2%Wood
4.8%Bottled, tank, or LP gas
1.6%Other fuel
Population in 1990: 6,739. Population change in the 1990s: +145 (+2.2%).
Place of birth for U.S.-born residents:
This state: 4,623
Northeast: 83
Midwest: 139
South: 723
West: 52
72% of the 24370 zip code residents lived in the same house 5 years ago. Out of people who lived in different houses, 62% lived in this county. Out of people who lived in different counties, 50% lived in Virginia.
94% of the 24370 zip code residents lived in the same house 1 year ago. Out of people who lived in different houses, 29% moved from this county. Out of people who lived in different houses, 22% moved from different county within same state. Out of people who lived in different houses, 55% moved from different state.
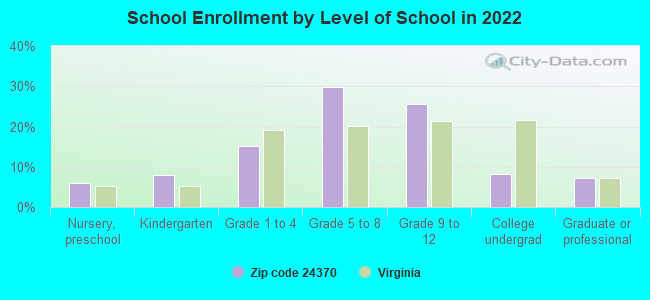
Private vs. public school enrollment:
Students in private schools in grades 1 to 8 (elementary and middle school): 19
Here:
4.4%
Virginia:
13.2%
Students in private schools in grades 9 to 12 (high school):
Here:
0.0%
Virginia:
10.2%
Students in private undergraduate colleges: 25
Here:
31.6%
Virginia:
18.7%
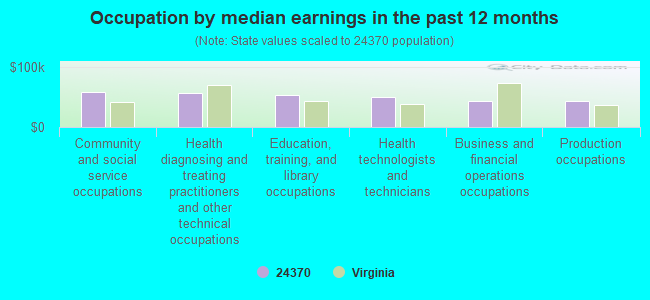
Occupation by median earnings in the past 12 months ($)
58,437Community and social service occupations
56,647Health diagnosing and treating practitioners and other technical occupations
53,384Education, training, and library occupations
49,959Health technologists and technicians
43,747Business and financial operations occupations
43,350Production occupations
Companies with federal contracts located in this zip code:
DOUGLAS W OGLE, LLC (300 POOR VALLEY ROAD in SALTVILLE, VA) : $6,456 in 2 contractsin 2005
$3,228 with U.S. Army Corps of Engineers - civil program financing only for Endangered Species Studies - Plant and Animal. Signed on 2005-06-08. Completion date: 2005-09-30.
$3,228 with Army for Endangered Species Studies - Plant and Animal. Signed on 2005-06-08. Completion date: 2005-09-30.
Top industries in this zip code by the number of employees in 2005:
Health Care and Social Assistance: Offices of Physicians (except Mental Health Specialists) (50-99 employees: 1 establishment)
Utilities: Natural Gas Distribution (20-49: 1)
Administrative and Support and Waste Management and Remediation Services: Telemarketing Bureaus (20-49: 1)
Construction: Structural Steel and Precast Concrete Contractors (20-49: 1)
Finance and Insurance: Commercial Banking (10-19: 1, 5-9: 1)
People in group quarters in 2000:
19 people in homes for the mentally ill
Fatal accident statistics in 2012:
Fatal accident count: 1
Vehicles involved in fatal accidents: 2
Fatal accidents caused by drunken drivers: 0
Fatalities: 1
Persons involved in fatal accidents: 3
Pedestrians involved in fatal accidents: 0
Fatal accident statistics in 2011:
Fatal accident count: 1
Vehicles involved in fatal accidents: 1
Fatal accidents caused by drunken drivers: 1
Fatalities: 1
Persons involved in fatal accidents: 1
Pedestrians involved in fatal accidents: 0
Home Mortgage Disclosure Act Aggregated Statistics For Year 2009 (Based on 4 partial tracts)
A) FHA, FSA/RHS & VA Home Purchase Loans
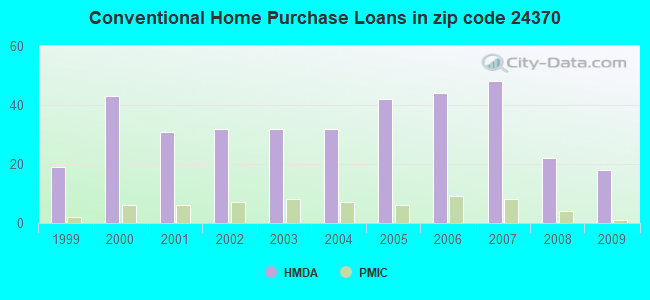
B) Conventional Home Purchase Loans
C) Refinancings
D) Home Improvement Loans
F) Non-occupant Loans on < 5 Family Dwellings (A B C & D)
G) Loans On Manufactured Home Dwelling (A B C & D)
Number
Average Value
Number
Average Value
Number
Average Value
Number
Average Value
Number
Average Value
Number
Average Value
LOANS ORIGINATED
5
$116,768
18
$126,013
57
$123,306
14
$50,248
7
$95,677
10
$64,825
APPLICATIONS APPROVED, NOT ACCEPTED
0
$0
2
$107,915
3
$111,323
2
$32,500
1
$62,850
2
$40,770
APPLICATIONS DENIED
3
$133,367
8
$87,106
26
$131,148
4
$25,190
2
$255,220
5
$82,256
APPLICATIONS WITHDRAWN
1
$80,640
2
$125,060
12
$143,987
0
$0
0
$0
0
$0
FILES CLOSED FOR INCOMPLETENESS
1
$93,050
1
$56,210
3
$140,127
1
$73,580
0
$0
1
$49,060
Aggregated Statistics For Year 2008 (Based on 4 partial tracts)
A) FHA, FSA/RHS & VA Home Purchase Loans
B) Conventional Home Purchase Loans
C) Refinancings
D) Home Improvement Loans
E) Loans on Dwellings For 5+ Families
F) Non-occupant Loans on < 5 Family Dwellings (A B C & D)
G) Loans On Manufactured Home Dwelling (A B C & D)
Number
Average Value
Number
Average Value
Number
Average Value
Number
Average Value
Number
Average Value
Number
Average Value
Number
Average Value
LOANS ORIGINATED
3
$117,553
22
$121,987
48
$111,804
12
$43,334
1
$265,440
7
$117,121
11
$59,009
APPLICATIONS APPROVED, NOT ACCEPTED
0
$0
1
$97,540
6
$128,623
1
$16,540
0
$0
1
$90,690
1
$49,390
APPLICATIONS DENIED
3
$77,587
6
$87,828
38
$120,052
4
$55,068
0
$0
4
$120,705
7
$95,397
APPLICATIONS WITHDRAWN
0
$0
2
$122,990
9
$119,960
1
$73,850
0
$0
0
$0
1
$125,860
FILES CLOSED FOR INCOMPLETENESS
0
$0
1
$147,810
2
$78,870
0
$0
0
$0
0
$0
0
$0
Aggregated Statistics For Year 2007 (Based on 4 partial tracts)
A) FHA, FSA/RHS & VA Home Purchase Loans
B) Conventional Home Purchase Loans
C) Refinancings
D) Home Improvement Loans
F) Non-occupant Loans on < 5 Family Dwellings (A B C & D)
G) Loans On Manufactured Home Dwelling (A B C & D)
Number
Average Value
Number
Average Value
Number
Average Value
Number
Average Value
Number
Average Value
Number
Average Value
LOANS ORIGINATED
3
$80,837
48
$114,893
50
$101,299
14
$31,806
10
$122,928
19
$58,777
APPLICATIONS APPROVED, NOT ACCEPTED
0
$0
2
$85,995
9
$77,430
1
$35,450
0
$0
2
$58,820
APPLICATIONS DENIED
1
$173,970
16
$74,339
54
$115,308
8
$50,205
1
$90,600
10
$72,480
APPLICATIONS WITHDRAWN
1
$98,340
3
$98,287
25
$124,617
0
$0
1
$92,210
1
$95,410
FILES CLOSED FOR INCOMPLETENESS
0
$0
0
$0
3
$109,950
0
$0
0
$0
0
$0
Aggregated Statistics For Year 2006 (Based on 4 partial tracts)
A) FHA, FSA/RHS & VA Home Purchase Loans
B) Conventional Home Purchase Loans
C) Refinancings
D) Home Improvement Loans
F) Non-occupant Loans on < 5 Family Dwellings (A B C & D)
G) Loans On Manufactured Home Dwelling (A B C & D)
Number
Average Value
Number
Average Value
Number
Average Value
Number
Average Value
Number
Average Value
Number
Average Value
LOANS ORIGINATED
2
$83,620
44
$99,871
57
$89,613
18
$25,118
8
$89,468
15
$60,965
APPLICATIONS APPROVED, NOT ACCEPTED
1
$58,780
9
$153,243
8
$59,250
1
$2,530
1
$521,400
6
$84,185
APPLICATIONS DENIED
1
$37,590
19
$80,433
39
$97,343
7
$31,031
2
$37,160
17
$70,603
APPLICATIONS WITHDRAWN
0
$0
5
$110,262
26
$99,099
2
$29,035
1
$75,840
2
$68,935
FILES CLOSED FOR INCOMPLETENESS
1
$78,660
3
$122,407
4
$100,580
1
$73,850
0
$0
0
$0
Aggregated Statistics For Year 2005 (Based on 4 partial tracts)
A) FHA, FSA/RHS & VA Home Purchase Loans
B) Conventional Home Purchase Loans
C) Refinancings
D) Home Improvement Loans
F) Non-occupant Loans on < 5 Family Dwellings (A B C & D)
G) Loans On Manufactured Home Dwelling (A B C & D)
Number
Average Value
Number
Average Value
Number
Average Value
Number
Average Value
Number
Average Value
Number
Average Value
LOANS ORIGINATED
4
$62,118
42
$100,680
67
$93,354
16
$31,532
10
$81,011
19
$45,659
APPLICATIONS APPROVED, NOT ACCEPTED
1
$62,370
8
$68,305
10
$77,861
1
$21,370
2
$94,740
6
$56,328
APPLICATIONS DENIED
2
$68,075
20
$77,677
55
$91,429
9
$33,218
2
$111,020
16
$63,753
APPLICATIONS WITHDRAWN
0
$0
3
$87,337
28
$97,459
3
$153,157
0
$0
2
$76,780
FILES CLOSED FOR INCOMPLETENESS
0
$0
2
$73,500
3
$74,100
0
$0
0
$0
0
$0
Aggregated Statistics For Year 2004 (Based on 4 partial tracts)
A) FHA, FSA/RHS & VA Home Purchase Loans
B) Conventional Home Purchase Loans
C) Refinancings
D) Home Improvement Loans
E) Loans on Dwellings For 5+ Families
F) Non-occupant Loans on < 5 Family Dwellings (A B C & D)
G) Loans On Manufactured Home Dwelling (A B C & D)
Number
Average Value
Number
Average Value
Number
Average Value
Number
Average Value
Number
Average Value
Number
Average Value
Number
Average Value
LOANS ORIGINATED
2
$72,160
32
$81,906
46
$75,951
18
$27,064
1
$821,530
6
$59,207
13
$42,051
APPLICATIONS APPROVED, NOT ACCEPTED
0
$0
5
$72,002
14
$80,163
0
$0
0
$0
2
$66,480
2
$50,125
APPLICATIONS DENIED
0
$0
10
$52,023
45
$79,110
9
$31,469
0
$0
2
$53,185
8
$57,036
APPLICATIONS WITHDRAWN
0
$0
3
$94,500
26
$95,232
2
$35,455
0
$0
1
$27,060
3
$59,080
FILES CLOSED FOR INCOMPLETENESS
0
$0
1
$181,650
3
$116,637
0
$0
0
$0
0
$0
1
$59,080
Aggregated Statistics For Year 2003 (Based on 4 partial tracts)
A) FHA, FSA/RHS & VA Home Purchase Loans
B) Conventional Home Purchase Loans
C) Refinancings
D) Home Improvement Loans
F) Non-occupant Loans on < 5 Family Dwellings (A B C & D)
Number
Average Value
Number
Average Value
Number
Average Value
Number
Average Value
Number
Average Value
LOANS ORIGINATED
1
$117,730
32
$77,738
83
$80,431
18
$25,201
9
$57,432
APPLICATIONS APPROVED, NOT ACCEPTED
0
$0
6
$64,942
10
$81,696
2
$19,780
0
$0
APPLICATIONS DENIED
1
$33,080
21
$50,200
29
$73,170
3
$11,997
1
$29,450
APPLICATIONS WITHDRAWN
0
$0
2
$47,905
17
$83,893
0
$0
0
$0
FILES CLOSED FOR INCOMPLETENESS
0
$0
1
$88,030
1
$73,370
0
$0
0
$0
Aggregated Statistics For Year 2002 (Based on 4 partial tracts)
A) FHA, FSA/RHS & VA Home Purchase Loans
B) Conventional Home Purchase Loans
C) Refinancings
D) Home Improvement Loans
F) Non-occupant Loans on < 5 Family Dwellings (A B C & D)
Number
Average Value
Number
Average Value
Number
Average Value
Number
Average Value
Number
Average Value
LOANS ORIGINATED
2
$70,880
32
$78,825
70
$73,631
16
$23,029
7
$69,393
APPLICATIONS APPROVED, NOT ACCEPTED
0
$0
8
$70,586
10
$71,470
1
$5,320
1
$99,400
APPLICATIONS DENIED
1
$16,840
15
$45,569
37
$75,832
4
$20,885
2
$27,235
APPLICATIONS WITHDRAWN
0
$0
3
$77,850
22
$95,544
0
$0
1
$85,120
FILES CLOSED FOR INCOMPLETENESS
0
$0
1
$51,510
4
$66,418
0
$0
0
$0
Aggregated Statistics For Year 2001 (Based on 4 partial tracts)
A) FHA, FSA/RHS & VA Home Purchase Loans
B) Conventional Home Purchase Loans
C) Refinancings
D) Home Improvement Loans
F) Non-occupant Loans on < 5 Family Dwellings (A B C & D)
Number
Average Value
Number
Average Value
Number
Average Value
Number
Average Value
Number
Average Value
LOANS ORIGINATED
2
$63,985
31
$64,439
70
$70,979
15
$18,998
7
$56,390
APPLICATIONS APPROVED, NOT ACCEPTED
1
$43,420
9
$41,738
11
$61,851
2
$19,420
1
$25,450
APPLICATIONS DENIED
1
$65,520
22
$41,454
31
$68,645
5
$13,994
2
$48,685
APPLICATIONS WITHDRAWN
0
$0
3
$85,970
12
$68,233
2
$23,610
1
$53,320
FILES CLOSED FOR INCOMPLETENESS
1
$43,450
0
$0
4
$72,808
0
$0
0
$0
Aggregated Statistics For Year 2000 (Based on 4 partial tracts)
A) FHA, FSA/RHS & VA Home Purchase Loans
B) Conventional Home Purchase Loans
C) Refinancings
D) Home Improvement Loans
F) Non-occupant Loans on < 5 Family Dwellings (A B C & D)
Number
Average Value
Number
Average Value
Number
Average Value
Number
Average Value
Number
Average Value
LOANS ORIGINATED
3
$84,093
43
$52,132
32
$66,513
16
$12,696
5
$67,548
APPLICATIONS APPROVED, NOT ACCEPTED
5
$42,168
13
$55,809
8
$51,544
3
$22,417
0
$0
APPLICATIONS DENIED
5
$42,048
39
$36,826
23
$49,727
6
$11,752
2
$41,270
APPLICATIONS WITHDRAWN
1
$56,530
8
$64,435
12
$52,558
1
$52,010
0
$0
FILES CLOSED FOR INCOMPLETENESS
1
$43,560
0
$0
2
$45,315
0
$0
0
$0
Aggregated Statistics For Year 1999 (Based on 2 partial tracts)
A) FHA, FSA/RHS & VA Home Purchase Loans
B) Conventional Home Purchase Loans
C) Refinancings
D) Home Improvement Loans
F) Non-occupant Loans on < 5 Family Dwellings (A B C & D)
Detailed PMIC statistics for the following Tracts:0103.00
, 0107.00
2002 - 2018 National Fire Incident Reporting System (NFIRS) incidents
Based on the data from the years 2002 - 2018 the average number of fire incidents per year is 27. The highest number of fire incidents - 55 took place in 2007, and the least - 6 in 2002. The data has an increasing trend.
When looking into fire subcategories, the most incidents belonged to: Structure Fires (51.0%), and Outside Fires (28.4%).
Fire incident types reported to NFIRS in Zip Code 24370


 Nearest zip codes: 24316, 24377, 24637, 24609, 24319, 24354.
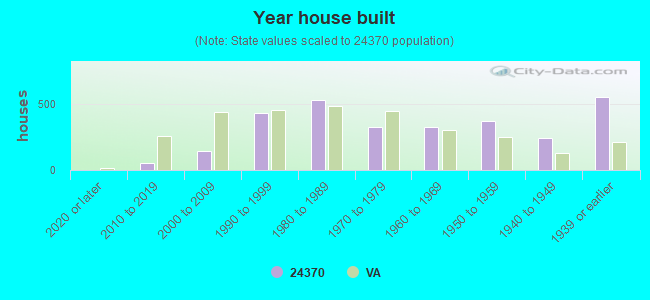


 Based on the data from the years 2002 - 2018 the average number of fire incidents per year is 27. The highest number of fire incidents - 55 took place in 2007, and the least - 6 in 2002. The data has an increasing trend.
 When looking into fire subcategories, the most incidents belonged to: Structure Fires (51.0%), and Outside Fires (28.4%).