Estimated zip code population in 2022: 2,759 Zip code population in 2010: 2,639 Zip code population in 2000: 2,560
Houses and condos: 1,635 Renter-occupied apartments: 189
% of renters here:
14%
State:
33%
March 2022 cost of living index in zip code 24380: 85.0 (less than average, U.S. average is 100)
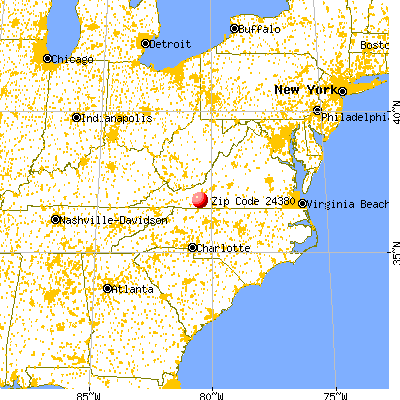
Land area: 84.4 sq. mi. Water area: 0.0 sq. mi.
Population density: 33 people per square mile
(very low).
OSM Map
General Map
Google Map
MSN Map
OSM Map
General Map
Google Map
MSN Map
OSM Map
General Map
Google Map
MSN Map
OSM Map
General Map
Google Map
MSN Map
Please wait while loading the map...
Real estate property taxes paid for housing units in 2022:
This zip code:
0.5% ($1,015)
Virginia:
0.7% ($2,617)
Median real estate property taxes paid for housing units with mortgages in 2022: $1,332 (0.6%) Median real estate property taxes paid for housing units with no mortgage in 2022: $739 (0.3%)
Business Search- 14 Million verified businesses
Males: 1,503
(54.5%)
Females: 1,256
(45.5%)
For population 25 years and over in 24380:
High school or higher: 82.7%
Bachelor's degree or higher: 13.1%
Graduate or professional degree: 7.0%
Unemployed: 0.6%
Mean travel time to work (commute): 36.6 minutes
For population 15 years and over in 24380:
Never married: 20.8%
Now married: 51.0%
Separated: 0.3%
Widowed: 13.7%
Divorced: 14.2%
Zip code 24380 compared to state average:
Median household income below state average.
Median house value below state average.
Unemployed percentage significantly below state average.
Black race population percentage significantly below state average.
Hispanic race population percentage below state average.
Median age significantly above state average.
Foreign-born population percentage significantly below state average.
Renting percentage significantly below state average.
Length of stay since moving in significantly above state average.
Percentage of population with a bachelor's degree or higher significantly below state average.
Estimated median house/condo value in 2022: $211,800
24380:
$211,800
Virginia:
$365,700
According to our research of Virginia and other state lists, there were 8 registered sex offenders living in 24380 zip code as of May 28, 2024. The ratio of all residents to sex offenders in zip code 24380 is 346 to 1. The ratio of registered sex offenders to all residents in this zip code is near the state average.
Median resident age:
This zip code:
57.0 years
Virginia median age:
39.0 years
Average household size:
This zip code:
2.1 people
Virginia:
2.5 people
Averages for the 2020 tax year for zip code 24380, filed in 2021:
Average Adjusted Gross Income (AGI) in 2020: $54,928 (Individual Income Tax Returns)
Here:
$54,928
State:
$86,446
Salary/wage: $45,049 (reported on 79.2% of returns)
Here:
$45,049
State:
$71,185
(% of AGI for various income ranges: 1122.5% for AGIs below $25k, 3513.8% for AGIs $25k-50k, 5984.6% for AGIs $50k-75k, 8666.4% for AGIs $75k-100k, 17385.0% for AGIs $100k-200k)
Taxable interest for individuals: $1,050 (reported on 30.0% of returns)
This zip code:
$1,050
Virginia:
$1,805
(% of AGI for various income ranges: 19.3% for AGIs below $25k, 35.8% for AGIs $25k-50k, 40.8% for AGIs $50k-75k, 43.6% for AGIs $75k-100k, 171.2% for AGIs $100k-200k)
Ordinary dividends: $3,806 (reported on 15.0% of returns)
Here:
$3,806
State:
$8,327
(% of AGI for various income ranges: 12.9% for AGIs below $25k, 42.9% for AGIs $25k-50k, 32.3% for AGIs $50k-75k, 80.0% for AGIs $75k-100k, 520.0% for AGIs $100k-200k)
Net capital gain/loss in AGI: +$15,700 (reported on 13.3% of returns)
Here:
+$15,700
State:
+$24,644
(% of AGI for various income ranges: 42.5% for AGIs below $25k, 70.4% for AGIs $25k-50k, 145.5% for AGIs $75k-100k, 2580.0% for AGIs $100k-200k)
Profit/loss from business: +$7,585 (reported on 16.7% of returns)
Here:
+$7,585
State:
+$12,836
(% of AGI for various income ranges: 135.0% for AGIs below $25k, 92.1% for AGIs $25k-50k, 330.0% for AGIs $50k-75k, 250.0% for AGIs $75k-100k, 267.5% for AGIs $100k-200k)
Taxable individual retirement arrangement distribution: $15,358 (reported on 10.0% of returns)
24380:
$15,358
Virginia:
$21,535
(% of AGI for various income ranges: 95.0% for AGIs below $25k, 101.2% for AGIs $25k-50k, 426.2% for AGIs $50k-75k, 975.0% for AGIs $100k-200k)
Total itemized deductions: $27,200 (reported on 2.5% of returns)
Here:
$27,200
State:
$33,287
(% of AGI for various income ranges: 1020.0% for AGIs $100k-200k)
Charity contributions: $7,200 (reported on 2.5% of returns)
Here:
$7,200
State:
$10,381
(% of AGI for various income ranges: 196.4% for AGIs $75k-100k)
Taxes paid: $8,367 (reported on 2.5% of returns)
24380:
$8,367
State:
$8,284
(% of AGI for various income ranges: 313.8% for AGIs $100k-200k)
Earned income credit: $1,915 (reported on 16.7% of returns)
Here:
$1,915
State:
$2,214
(% of AGI for various income ranges: 78.6% for AGIs below $25k, 67.9% for AGIs $25k-50k)
Percentage of individuals using paid preparers for their 2020 taxes: 92.5%
Here:
92%
State:
92%
(% for various income ranges: 90.7% for AGIs below $25k, 93.5% for AGIs $25k-50k, 94.1% for AGIs $50k-75k, 93.3% for AGIs $75k-100k, 91.7% for AGIs $100k-200k, 100.0% for AGIs over 200k)
Averages for the 2012 tax year for zip code 24380, filed in 2013:
Average Adjusted Gross Income (AGI) in 2012: $47,580 (Individual Income Tax Returns)
Here:
$47,580
State:
$71,192
Salary/wage: $37,285 (reported on 85.0% of returns)
Here:
$37,285
State:
$59,229
(% of AGI for various income ranges: 73.5% for AGIs below $25k, 75.7% for AGIs $25k-50k, 79.6% for AGIs $50k-75k, 82.4% for AGIs $75k-100k, 41.0% for AGIs $100k-200k)
Taxable interest for individuals: $1,032 (reported on 34.6% of returns)
This zip code:
$1,032
Virginia:
$1,600
(% of AGI for various income ranges: 2.1% for AGIs below $25k, 1.2% for AGIs $25k-50k, 0.7% for AGIs $50k-75k, 0.3% for AGIs $75k-100k, 0.2% for AGIs $100k-200k)
Ordinary dividends: $1,471 (reported on 13.1% of returns)
Here:
$1,471
State:
$6,959
(% of AGI for various income ranges: 0.2% for AGIs below $25k, 0.5% for AGIs $25k-50k, 0.5% for AGIs $50k-75k, 0.4% for AGIs $75k-100k, 0.4% for AGIs $100k-200k)
Net capital gain/loss in AGI: +$3,162 (reported on 12.1% of returns)
Here:
+$3,162
State:
+$16,672
(% of AGI for various income ranges: 0.4% for AGIs below $25k, 1.6% for AGIs $50k-75k, 3.0% for AGIs $75k-100k)
Profit/loss from business: +$6,085 (reported on 18.7% of returns)
Here:
+$6,085
State:
+$14,116
(% of AGI for various income ranges: 8.6% for AGIs below $25k, 4.5% for AGIs $25k-50k, 1.3% for AGIs $50k-75k, 1.1% for AGIs $75k-100k)
Taxable individual retirement arrangement distribution: $10,900 (reported on 11.2% of returns)
24380:
$10,900
Virginia:
$16,667
(% of AGI for various income ranges: 3.3% for AGIs below $25k, 2.2% for AGIs $25k-50k, 7.8% for AGIs $50k-75k)
Total itemized deductions: $20,462 (19% of AGI, reported on 19.6% of returns)
Here:
$20,462
State:
$26,596
Here:
19.5% of AGI
State:
20.1% of AGI
(% of AGI for various income ranges: 5.8% for AGIs below $25k, 8.1% for AGIs $25k-50k, 7.4% for AGIs $50k-75k, 8.6% for AGIs $75k-100k, 10.3% for AGIs $100k-200k)
Charity contributions: $5,581 (reported on 15.0% of returns)
Here:
$5,581
State:
$4,443
(% of AGI for various income ranges: 1.1% for AGIs $25k-50k, 1.5% for AGIs $50k-75k, 1.5% for AGIs $75k-100k, 3.2% for AGIs $100k-200k)
Taxes paid: $6,555 (reported on 18.7% of returns)
24380:
$6,555
State:
$9,951
(% of AGI for various income ranges: 1.7% for AGIs $25k-50k, 1.8% for AGIs $50k-75k, 2.6% for AGIs $75k-100k, 4.7% for AGIs $100k-200k)
Earned income credit: $2,050 (reported on 20.6% of returns)
Here:
$2,050
State:
$2,211
(% of AGI for various income ranges: 5.1% for AGIs below $25k, 1.5% for AGIs $25k-50k)
Percentage of individuals using paid preparers for their 2012 taxes: 60.7%
Here:
61%
State:
46%
(% for various income ranges: 54.5% for AGIs below $25k, 61.3% for AGIs $25k-50k, 66.7% for AGIs $50k-75k, 62.5% for AGIs $75k-100k, 83.3% for AGIs $100k-200k)
Averages for the 2004 tax year for zip code 24380, filed in 2005:
Average Adjusted Gross Income (AGI) in 2004: $37,373 (Individual Income Tax Returns)
Here:
$37,373
State:
$56,704
Salary/wage: $31,055 (reported on 84.3% of returns)
Here:
$31,055
State:
$48,441
(% of AGI for various income ranges: 104.4% for AGIs below $10k, 75.5% for AGIs $10k-25k, 85.4% for AGIs $25k-50k, 81.6% for AGIs $50k-75k, 67.8% for AGIs $75k-100k, 32.6% for AGIs over 100k)
Taxable interest for individuals: $1,168 (reported on 42.4% of returns)
This zip code:
$1,168
Virginia:
$1,688
(% of AGI for various income ranges: 8.7% for AGIs below $10k, 2.5% for AGIs $10k-25k, 1.5% for AGIs $25k-50k, 1.0% for AGIs $50k-75k, 0.5% for AGIs $75k-100k, 0.5% for AGIs over 100k)
Taxable dividends: $1,441 (reported on 13.6% of returns)
Here:
$1,441
State:
$4,028
(% of AGI for various income ranges: 1.8% for AGIs below $10k, 0.2% for AGIs $10k-25k, 0.1% for AGIs $25k-50k, 0.8% for AGIs $50k-75k, 0.3% for AGIs $75k-100k, 1.0% for AGIs over 100k)
Net capital gain/loss: +$10,687 (reported on 14.1% of returns)
Here:
+$10,687
State:
+$14,375
(% of AGI for various income ranges: 3.3% for AGIs below $10k, 2.7% for AGIs $10k-25k, 0.6% for AGIs $25k-50k, 2.9% for AGIs $50k-75k, 10.0% for AGIs $75k-100k, 7.5% for AGIs over 100k)
Profit/loss from business: +$7,807 (reported on 19.0% of returns)
Here:
+$7,807
State:
+$13,342
(% of AGI for various income ranges: 7.4% for AGIs below $10k, 9.0% for AGIs $10k-25k, 5.7% for AGIs $25k-50k, 3.3% for AGIs $50k-75k, 1.9% for AGIs $75k-100k)
IRA payment deduction: $2,263 (reported on 1.8% of returns)
24380:
$2,263
Virginia:
$2,943
Total itemized deductions: $14,860 (19% of AGI, reported on 19.4% of returns)
Here:
$14,860
State:
$21,492
Here:
18.5% of AGI
State:
21.0% of AGI
(% of AGI for various income ranges: 6.7% for AGIs $10k-25k, 6.3% for AGIs $25k-50k, 9.5% for AGIs $50k-75k, 7.7% for AGIs $75k-100k, 8.7% for AGIs over 100k)
Charity contributions deductions: $3,659 (4% of AGI, reported on 16.0% of returns)
Here:
$3,659
State:
$3,794
Here:
4.2% of AGI
State:
3.5% of AGI
(% of AGI for various income ranges: 1.0% for AGIs $10k-25k, 0.9% for AGIs $25k-50k, 1.7% for AGIs $50k-75k, 1.8% for AGIs $75k-100k, 2.6% for AGIs over 100k)
Total tax: $4,461 (reported on 73.1% of returns)
24380:
$4,461
State:
$9,537
(% of AGI for various income ranges: 4.7% for AGIs below $10k, 4.1% for AGIs $10k-25k, 6.3% for AGIs $25k-50k, 8.3% for AGIs $50k-75k, 10.4% for AGIs $75k-100k, 14.6% for AGIs over 100k)
Earned income credit: $1,728 (reported on 17.9% of returns)
Here:
$1,728
State:
$1,734
Percentage of individuals using paid preparers for their 2004 taxes: 66.6%
Here:
67%
State:
52%
(% for various income ranges: 56.6% for AGIs below $10k, 69.8% for AGIs $10k-25k, 68.2% for AGIs $25k-50k, 63.0% for AGIs $50k-75k, 73.5% for AGIs $75k-100k, 90.0% for AGIs over 100k)
Household received Food Stamps/SNAP in the past 12 months: 63 Household did not receive Food Stamps/SNAP in the past 12 months: 1,249
Women who had a birth in the past 12 months: 25 (25 now married, 0 unmarried) Women who did not have a birth in the past 12 months: 358 (111 now married, 248 unmarried)
Housing units in zip code 24380 with a mortgage: 336 Houses without a mortgage: 8
Median monthly owner costs for units with a mortgage: $1,185 Median monthly owner costs for units without a mortgage: $273
Residents with income below the poverty level in 2022:
This zip code:
9.9%
Whole state:
10.6%
Residents with income below 50% of the poverty level in 2022:
This zip code:
6.3%
Whole state:
5.2%
Median number of rooms in houses and condos:
Here:
5.4
State:
7.0
Median number of rooms in apartments:
Here:
5.1
State:
4.3
Notable locations in this zip code not listed on our city pages
Churches in zip code 24380 include: Bethel Chapel (A), Blue Ridge Church (B), Burks Fork Church (C), Duncan Chapel Church (D), Union Church (E), Greasy Creek Church (F), Harris Chapel (G), Indian Creek Church (H), Saint Mark Lutheran Church (I). Display/hide their locations on the map
Size of family households: 496 2-persons, 53 3-persons, 111 4-persons, 49 5-persons, 5 6-persons
Size of nonfamily households: 541 1-person, 61 2-persons, 5 3-persons
237 married couples with children.
61 single-parent households (12 men, 49 women).
95.5% of residents of 24380 zip code speak English at home.
3.6% of residents speak Spanish at home (68% very well, 32% not well).
1.3% of residents speak Asian or Pacific Island language at home (32% very well, 32% well, 35% not well).
Foreign born population: 89 (3.2%) (41.5% of them are naturalized citizens)
This zip code:
3.2%
Whole state:
12.7%
56%Honduras
38%American
25%German
19%English
1%Irish
0%French
Year of entry for the foreign-born population
02010 or later
762000 to 2009
101990 to 1999
0Before 1990
Public elementary/middle school in in zip code 24380 not listed on the city page:
Housing units lacking complete plumbing facilities: 7.5% Housing units lacking complete kitchen facilities: 7.5%
60.7%Electricity
27.9%Wood
8.1%Bottled, tank, or LP gas
2.6%Fuel oil, kerosene, etc.
0.9%Utility gas
Population in 1990: 2,769.
Place of birth for U.S.-born residents:
This state: 2,280
Northeast: 126
Midwest: 34
South: 200
West: 5
69% of the 24380 zip code residents lived in the same house 5 years ago. Out of people who lived in different houses, 35% lived in this county. Out of people who lived in different counties, 50% lived in Virginia.
94% of the 24380 zip code residents lived in the same house 1 year ago. Out of people who lived in different houses, 67% moved from different county within same state. Out of people who lived in different houses, 21% moved from different state. Out of people who lived in different houses, 22% moved from abroad.
Private vs. public school enrollment:
Students in private schools in grades 1 to 8 (elementary and middle school):
Here:
0.0%
Virginia:
13.2%
Students in private schools in grades 9 to 12 (high school):
Here:
0.0%
Virginia:
10.2%
Students in private undergraduate colleges: 68
Here:
57.5%
Virginia:
18.7%
Occupation by median earnings in the past 12 months ($)
109,689Sales and related occupations
106,361Health diagnosing and treating practitioners and other technical occupations
55,670Installation, maintenance, and repair occupations
39,155Production occupations
31,149Construction and extraction occupations
23,010Material moving occupations
Top industries in this zip code by the number of employees in 2005:
Accommodation and Food Services: Full-Service Restaurants (10-19 employees: 1 establishment)
Other Services (except Public Administration): General Automotive Repair (5-9: 1)
Administrative and Support and Waste Management and Remediation Services: Landscaping Services (5-9: 1)
Professional, Scientific, and Technical Services: Computer Systems Design Services (5-9: 1)
Construction: Framing Contractors (5-9: 1)
Construction: Commercial and Institutional Building Construction (1-4: 2)
Other Services (except Public Administration): Religious Organizations (1-4: 2)
Fatal accident statistics in 2014:
Fatal accident count: 1
Vehicles involved in fatal accidents: 1
Fatal accidents caused by drunken drivers: 0
Fatalities: 1
Persons involved in fatal accidents: 3
Pedestrians involved in fatal accidents: 0
2002 - 2018 National Fire Incident Reporting System (NFIRS) incidents
According to the data from the years 2002 - 2018 the average number of fires per year is 21. The highest number of reported fires - 43 took place in 2002, and the least - 9 in 2015. The data has a declining trend.
When looking into fire subcategories, the most reports belonged to: Outside Fires (46.3%), and Structure Fires (45.2%).
Fire incident types reported to NFIRS in Zip Code 24380


 Nearest zip codes: 24325, 24105, 24352, 24149, 24347, 24091.


 (Students: 224, Location: 5075 FLOYD HIGHWAY S, Grades: PK-7)


 According to the data from the years 2002 - 2018 the average number of fires per year is 21. The highest number of reported fires - 43 took place in 2002, and the least - 9 in 2015. The data has a declining trend.
 When looking into fire subcategories, the most reports belonged to: Outside Fires (46.3%), and Structure Fires (45.2%).