Estimated zip code population in 2022: 7,542 Zip code population in 2010: 7,215 Zip code population in 2000: 6,362
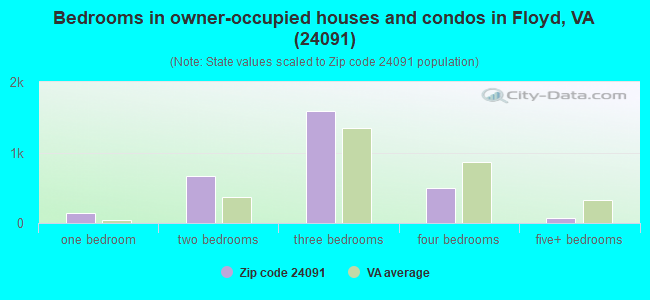
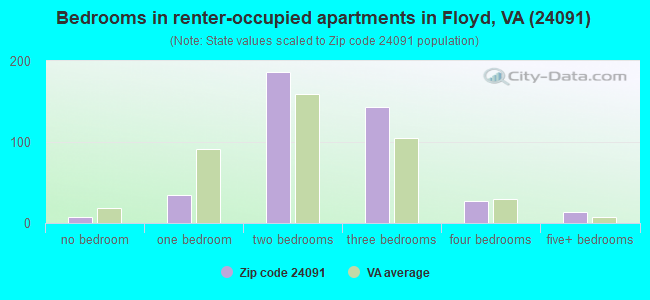
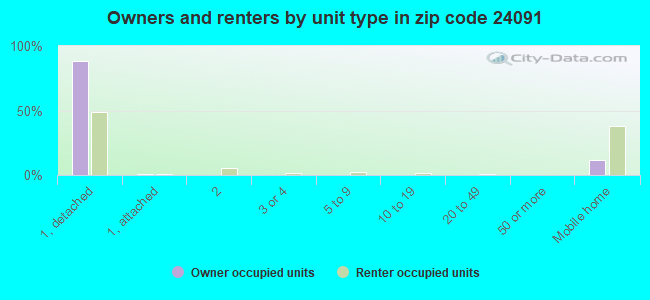
Houses and condos: 3,954 Renter-occupied apartments: 416
% of renters here:
12%
State:
33%
March 2022 cost of living index in zip code 24091: 85.4 (less than average, U.S. average is 100)
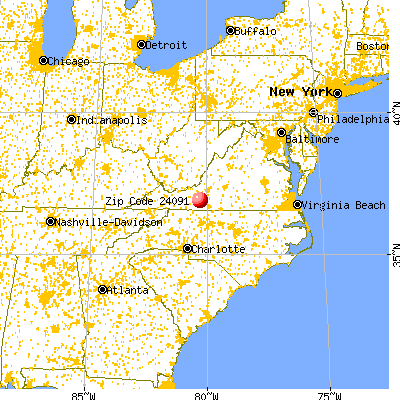
Land area: 174.8 sq. mi. Water area: 0.6 sq. mi.
Population density: 43 people per square mile
(very low).
OSM Map
General Map
Google Map
MSN Map
OSM Map
General Map
Google Map
MSN Map
OSM Map
General Map
Google Map
MSN Map
OSM Map
General Map
Google Map
MSN Map
Please wait while loading the map...
Real estate property taxes paid for housing units in 2022:
This zip code:
0.5% ($1,255)
Virginia:
0.7% ($2,617)
Median real estate property taxes paid for housing units with mortgages in 2022: $1,212 (0.4%) Median real estate property taxes paid for housing units with no mortgage in 2022: $1,365 (0.5%)
Estimated median house/condo value in 2022: $260,768
24091:
$260,768
Virginia:
$365,700
According to our research of Virginia and other state lists, there were 12 registered sex offenders living in 24091 zip code as of May 28, 2024. The ratio of all residents to sex offenders in zip code 24091 is 605 to 1. The ratio of registered sex offenders to all residents in this zip code is lower than the state average.
Median resident age:
This zip code:
52.5 years
Virginia median age:
39.0 years
Average household size:
This zip code:
2.2 people
Virginia:
2.5 people
Averages for the 2020 tax year for zip code 24091, filed in 2021:
Average Adjusted Gross Income (AGI) in 2020: $55,635 (Individual Income Tax Returns)
Here:
$55,635
State:
$86,446
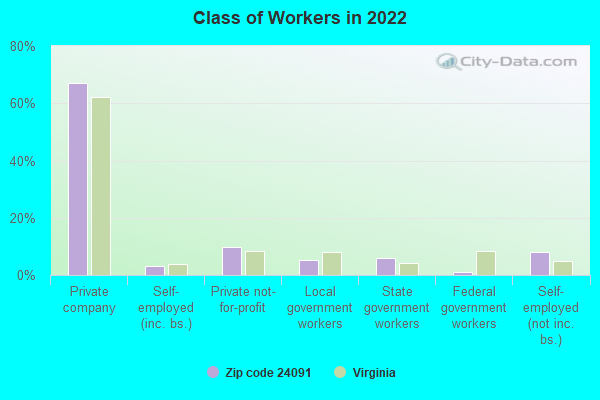
Salary/wage: $45,597 (reported on 77.1% of returns)
Here:
$45,597
State:
$71,185
(% of AGI for various income ranges: 1152.0% for AGIs below $25k, 3349.6% for AGIs $25k-50k, 6048.6% for AGIs $50k-75k, 8820.8% for AGIs $75k-100k, 16314.8% for AGIs $100k-200k, 63085.0% for AGIs over 200k)
Taxable interest for individuals: $1,459 (reported on 34.0% of returns)
This zip code:
$1,459
Virginia:
$1,805
(% of AGI for various income ranges: 24.4% for AGIs below $25k, 62.8% for AGIs $25k-50k, 67.3% for AGIs $50k-75k, 85.8% for AGIs $75k-100k, 190.0% for AGIs $100k-200k, 1225.0% for AGIs over 200k)
Ordinary dividends: $3,912 (reported on 21.1% of returns)
Here:
$3,912
State:
$8,327
(% of AGI for various income ranges: 30.5% for AGIs below $25k, 53.7% for AGIs $25k-50k, 115.7% for AGIs $50k-75k, 109.6% for AGIs $75k-100k, 361.0% for AGIs $100k-200k, 4095.0% for AGIs over 200k)
Net capital gain/loss in AGI: +$13,987 (reported on 17.1% of returns)
Here:
+$13,987
State:
+$24,644
(% of AGI for various income ranges: 22.4% for AGIs below $25k, 68.2% for AGIs $25k-50k, 148.9% for AGIs $50k-75k, 192.1% for AGIs $75k-100k, 1512.4% for AGIs $100k-200k, 17735.0% for AGIs over 200k)
Profit/loss from business: +$9,883 (reported on 19.7% of returns)
Here:
+$9,883
State:
+$12,836
(% of AGI for various income ranges: 185.2% for AGIs below $25k, 228.2% for AGIs $25k-50k, 395.1% for AGIs $50k-75k, 126.2% for AGIs $75k-100k, 909.0% for AGIs $100k-200k)
Taxable individual retirement arrangement distribution: $13,982 (reported on 11.1% of returns)
24091:
$13,982
Virginia:
$21,535
(% of AGI for various income ranges: 60.1% for AGIs below $25k, 167.1% for AGIs $25k-50k, 266.2% for AGIs $50k-75k, 439.6% for AGIs $75k-100k, 838.1% for AGIs $100k-200k)
Total itemized deductions: $35,547 (reported on 4.3% of returns)
Here:
$35,547
State:
$33,287
(% of AGI for various income ranges: 380.0% for AGIs $50k-75k, 225.0% for AGIs $75k-100k, 738.6% for AGIs $100k-200k, 9175.0% for AGIs over 200k)
Charity contributions: $16,442 (reported on 3.4% of returns)
Here:
$16,442
State:
$10,381
(% of AGI for various income ranges: 76.2% for AGIs $50k-75k, 232.9% for AGIs $100k-200k, 6010.0% for AGIs over 200k)
Taxes paid: $6,773 (reported on 4.3% of returns)
24091:
$6,773
State:
$8,284
(% of AGI for various income ranges: 46.2% for AGIs $50k-75k, 52.5% for AGIs $75k-100k, 204.8% for AGIs $100k-200k, 1445.0% for AGIs over 200k)
Earned income credit: $1,926 (reported on 16.6% of returns)
Here:
$1,926
State:
$2,214
(% of AGI for various income ranges: 80.2% for AGIs below $25k, 62.8% for AGIs $25k-50k)
Percentage of individuals using paid preparers for their 2020 taxes: 93.4%
Here:
93%
State:
92%
(% for various income ranges: 89.9% for AGIs below $25k, 95.4% for AGIs $25k-50k, 94.2% for AGIs $50k-75k, 97.1% for AGIs $75k-100k, 95.1% for AGIs $100k-200k, 100.0% for AGIs over 200k)
Averages for the 2012 tax year for zip code 24091, filed in 2013:
Average Adjusted Gross Income (AGI) in 2012: $44,488 (Individual Income Tax Returns)
Here:
$44,488
State:
$71,192
Salary/wage: $37,736 (reported on 80.7% of returns)
Here:
$37,736
State:
$59,229
(% of AGI for various income ranges: 72.9% for AGIs below $25k, 76.1% for AGIs $25k-50k, 73.1% for AGIs $50k-75k, 70.9% for AGIs $75k-100k, 67.4% for AGIs $100k-200k, 40.1% for AGIs over 200k)
Taxable interest for individuals: $1,690 (reported on 41.1% of returns)
This zip code:
$1,690
Virginia:
$1,600
(% of AGI for various income ranges: 1.9% for AGIs below $25k, 1.4% for AGIs $25k-50k, 1.1% for AGIs $50k-75k, 1.4% for AGIs $75k-100k, 1.3% for AGIs $100k-200k, 2.9% for AGIs over 200k)
Ordinary dividends: $4,466 (reported on 20.6% of returns)
Here:
$4,466
State:
$6,959
(% of AGI for various income ranges: 1.6% for AGIs below $25k, 1.3% for AGIs $25k-50k, 1.7% for AGIs $50k-75k, 1.5% for AGIs $75k-100k, 2.0% for AGIs $100k-200k, 5.6% for AGIs over 200k)
Net capital gain/loss in AGI: +$9,336 (reported on 14.4% of returns)
Here:
+$9,336
State:
+$16,672
(% of AGI for various income ranges: 1.4% for AGIs $25k-50k, 0.5% for AGIs $50k-75k, 2.2% for AGIs $75k-100k, 4.6% for AGIs $100k-200k, 12.2% for AGIs over 200k)
Profit/loss from business: +$9,752 (reported on 19.0% of returns)
Here:
+$9,752
State:
+$14,116
(% of AGI for various income ranges: 11.4% for AGIs below $25k, 4.9% for AGIs $25k-50k, 3.2% for AGIs $50k-75k, 1.6% for AGIs $75k-100k, 4.6% for AGIs $100k-200k)
Taxable individual retirement arrangement distribution: $12,811 (reported on 10.7% of returns)
24091:
$12,811
Virginia:
$16,667
(% of AGI for various income ranges: 3.0% for AGIs below $25k, 2.3% for AGIs $25k-50k, 3.0% for AGIs $50k-75k, 3.4% for AGIs $75k-100k, 5.7% for AGIs $100k-200k)
Total itemized deductions: $19,924 (23% of AGI, reported on 22.7% of returns)
Here:
$19,924
State:
$26,596
Here:
22.7% of AGI
State:
20.1% of AGI
(% of AGI for various income ranges: 5.6% for AGIs below $25k, 7.7% for AGIs $25k-50k, 9.5% for AGIs $50k-75k, 11.7% for AGIs $75k-100k, 12.2% for AGIs $100k-200k, 15.1% for AGIs over 200k)
Charity contributions: $4,793 (reported on 17.2% of returns)
Here:
$4,793
State:
$4,443
(% of AGI for various income ranges: 0.6% for AGIs below $25k, 1.0% for AGIs $25k-50k, 1.3% for AGIs $50k-75k, 2.7% for AGIs $75k-100k, 2.6% for AGIs $100k-200k, 3.2% for AGIs over 200k)
Taxes paid: $6,081 (reported on 22.7% of returns)
24091:
$6,081
State:
$9,951
(% of AGI for various income ranges: 0.7% for AGIs below $25k, 1.5% for AGIs $25k-50k, 2.5% for AGIs $50k-75k, 3.5% for AGIs $75k-100k, 4.3% for AGIs $100k-200k, 6.9% for AGIs over 200k)
Earned income credit: $1,967 (reported on 19.6% of returns)
Here:
$1,967
State:
$2,211
(% of AGI for various income ranges: 5.6% for AGIs below $25k, 0.9% for AGIs $25k-50k)
Percentage of individuals using paid preparers for their 2012 taxes: 61.0%
Here:
61%
State:
46%
(% for various income ranges: 55.2% for AGIs below $25k, 63.0% for AGIs $25k-50k, 64.6% for AGIs $50k-75k, 67.9% for AGIs $75k-100k, 72.7% for AGIs $100k-200k, 75.0% for AGIs over 200k)
Averages for the 2004 tax year for zip code 24091, filed in 2005:
Average Adjusted Gross Income (AGI) in 2004: $36,213 (Individual Income Tax Returns)
Here:
$36,213
State:
$56,704
Salary/wage: $31,726 (reported on 81.5% of returns)
Here:
$31,726
State:
$48,441
(% of AGI for various income ranges: 112.9% for AGIs below $10k, 72.5% for AGIs $10k-25k, 79.7% for AGIs $25k-50k, 79.7% for AGIs $50k-75k, 75.6% for AGIs $75k-100k, 41.6% for AGIs over 100k)
Taxable interest for individuals: $1,793 (reported on 49.8% of returns)
This zip code:
$1,793
Virginia:
$1,688
(% of AGI for various income ranges: 9.4% for AGIs below $10k, 3.7% for AGIs $10k-25k, 2.2% for AGIs $25k-50k, 1.8% for AGIs $50k-75k, 1.8% for AGIs $75k-100k, 2.7% for AGIs over 100k)
Taxable dividends: $2,911 (reported on 20.9% of returns)
Here:
$2,911
State:
$4,028
(% of AGI for various income ranges: 5.6% for AGIs below $10k, 1.1% for AGIs $10k-25k, 1.4% for AGIs $25k-50k, 1.3% for AGIs $50k-75k, 1.0% for AGIs $75k-100k, 3.1% for AGIs over 100k)
Net capital gain/loss: +$9,055 (reported on 17.6% of returns)
Here:
+$9,055
State:
+$14,375
(% of AGI for various income ranges: -0.8% for AGIs below $10k, 0.8% for AGIs $10k-25k, 1.3% for AGIs $25k-50k, 3.0% for AGIs $50k-75k, 1.9% for AGIs $75k-100k, 15.1% for AGIs over 100k)
Profit/loss from business: +$9,223 (reported on 20.6% of returns)
Here:
+$9,223
State:
+$13,342
(% of AGI for various income ranges: 5.9% for AGIs below $10k, 10.9% for AGIs $10k-25k, 4.1% for AGIs $25k-50k, 3.3% for AGIs $50k-75k, 4.5% for AGIs $75k-100k, 6.0% for AGIs over 100k)
IRA payment deduction: $2,957 (reported on 3.1% of returns)
24091:
$2,957
Virginia:
$2,943
(% of AGI for various income ranges: 0.3% for AGIs $10k-25k, 0.4% for AGIs $25k-50k, 0.2% for AGIs $50k-75k, 0.4% for AGIs $75k-100k)
Total itemized deductions: $15,300 (21% of AGI, reported on 21.6% of returns)
Here:
$15,300
State:
$21,492
Here:
21.4% of AGI
State:
21.0% of AGI
(% of AGI for various income ranges: 8.9% for AGIs below $10k, 5.4% for AGIs $10k-25k, 7.6% for AGIs $25k-50k, 9.5% for AGIs $50k-75k, 12.1% for AGIs $75k-100k, 11.2% for AGIs over 100k)
Charity contributions deductions: $3,707 (5% of AGI, reported on 17.6% of returns)
Here:
$3,707
State:
$3,794
Here:
4.8% of AGI
State:
3.5% of AGI
(% of AGI for various income ranges: 0.8% for AGIs below $10k, 0.8% for AGIs $10k-25k, 1.2% for AGIs $25k-50k, 1.7% for AGIs $50k-75k, 2.1% for AGIs $75k-100k, 3.3% for AGIs over 100k)
Total tax: $4,648 (reported on 75.9% of returns)
24091:
$4,648
State:
$9,537
(% of AGI for various income ranges: 4.9% for AGIs below $10k, 4.9% for AGIs $10k-25k, 6.5% for AGIs $25k-50k, 8.6% for AGIs $50k-75k, 10.7% for AGIs $75k-100k, 18.7% for AGIs over 100k)
Earned income credit: $1,552 (reported on 17.1% of returns)
Here:
$1,552
State:
$1,734
Percentage of individuals using paid preparers for their 2004 taxes: 67.2%
Here:
67%
State:
52%
(% for various income ranges: 56.9% for AGIs below $10k, 68.3% for AGIs $10k-25k, 69.7% for AGIs $25k-50k, 72.1% for AGIs $50k-75k, 70.6% for AGIs $75k-100k, 73.0% for AGIs over 100k)
Likely homosexual households (counted as self-reported same-sex unmarried-partner households)
Lesbian couples: 0.3% of all households
Gay men: 0.0% of all households
Household received Food Stamps/SNAP in the past 12 months: 267 Household did not receive Food Stamps/SNAP in the past 12 months: 3,113
Women who had a birth in the past 12 months: 37 (38 now married, 0 unmarried) Women who did not have a birth in the past 12 months: 1,391 (789 now married, 594 unmarried)
Housing units in zip code 24091 with a mortgage: 1,235 (145 second mortgage, 143 both second mortgage and home equity loan) Houses without a mortgage: 114
Median monthly owner costs for units with a mortgage: $1,318 Median monthly owner costs for units without a mortgage: $345
Residents with income below the poverty level in 2022:
This zip code:
11.0%
Whole state:
10.6%
Residents with income below 50% of the poverty level in 2022:
This zip code:
2.9%
Whole state:
5.2%
Median number of rooms in houses and condos:
Here:
5.8
State:
7.0
Median number of rooms in apartments:
Here:
4.8
State:
4.3
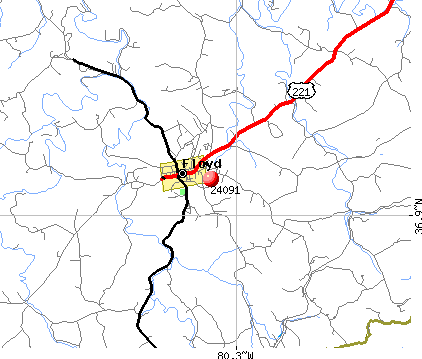
Notable locations in this zip code not listed on our city pages
Notable locations in zip code 24091: Alum Ridge (A), Great Oaks Country Club (B), Cannaday Gap (C), Camp Creek (D), Woods Store (E), Conner Dairy Farms (F), Duncan Farm (G), Jessie Peterman Memorial Library (H), Floyd Town Hall (I), Floyd County Courthouse (J). Display/hide their locations on the map
Churches in zip code 24091 include: Red Oak Grove Church (A), Reedsville Church (B), Beaver Creek Church (C), Bethlehem Church (D), Zion Church (E), Cannaday Church (F), Silverleaf Church (G), Copper Valley Church (H), County Line Church (I). Display/hide their locations on the map
Cemeteries: White Rock Cemetery (1), Mannon Cemetery (2), Duncan Cemetery (3), Jacksonville Cemetery (4), Sowers Cemetery (5). Display/hide their locations on the map
Streams, rivers, and creeks: West Fork Little River (A), Terrys Creek (B), Spurlock Creek (C), Simmons Creek (D), Silverleaf Branch (E), West Fork Big Indian Creek (F), Rush Fork (G), Pine Creek (H), Oldfield Creek (I). Display/hide their locations on the map
In group quarters: 105 (-1 institutionalized population)
Size of family households: 1,229 2-persons, 516 3-persons, 219 4-persons, 131 5-persons, 33 6-persons
Size of nonfamily households: 1,055 1-person, 194 2-persons, 17 3-persons
929 married couples with children.
177 single-parent households (111 men, 66 women).
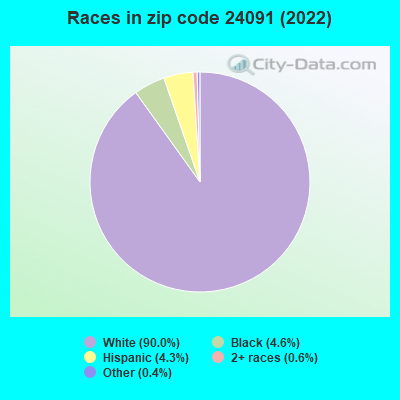
95.4% of residents of 24091 zip code speak English at home.
3.2% of residents speak Spanish at home (68% very well, 21% well, 11% not at all).
1.5% of residents speak other Indo-European language at home (100% very well).
0.1% of residents speak Asian or Pacific Island language at home (100% very well).
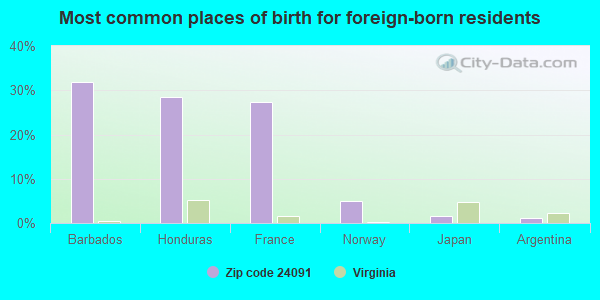
Foreign born population: 252 (3.3%) (83.0% of them are naturalized citizens)
This zip code:
3.3%
Whole state:
12.7%
32%Barbados
29%Honduras
27%France
5%Norway
2%Japan
1%Argentina
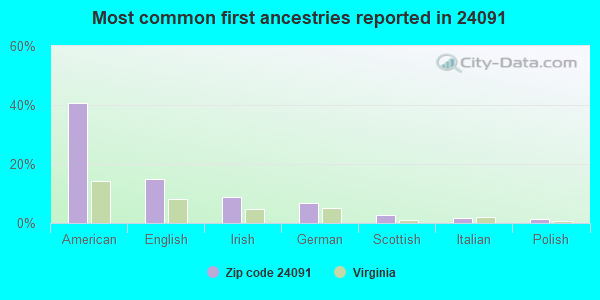
41%American
15%English
9%Irish
7%German
3%Scottish
2%Italian
1%Polish
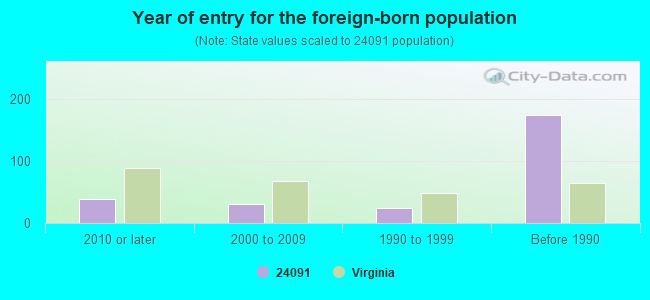
Year of entry for the foreign-born population
392010 or later
312000 to 2009
241990 to 1999
174Before 1990
Facilities with environmental interests located in this zip code:
BLUE MOUNTAIN (RT 3 BOX 211 in FLOYD, VA)
(Integrated Compliance Information System) - ICIS-03-1989-0226, FORMAL ENFORCEMENT ACTION COMPLIANCE ACTIVITY (Tracking inspections of insecticide, fungicide, and rodenticide, and toxic substances)
AEP FLOYD SERVICE BUILDING (141 APPALACHIAN ROAD in FLOYD, VA)
Conditionally Exempt Small Quantity Generators, less than 100 kg/month of hazardous waste (Resource Conservation and Recovery Act (tracking hazardous waste)) - notification USED OIL PROGRAM (Resource Conservation and Recovery Act (tracking hazardous waste)) Organizations: APPALACHAIN POWER CO. (CONTACT/OWNER)
BIO REGIONAL ENERGY ASSOCIATES LIMITED (FLOYD INDUSTRIAL PARK ROAD in FLOYD, VA)
COMPLIANCE ACTIVITY (Tracking inspections of insecticide, fungicide, and rodenticide, and toxic substances) TRI REPORTER (Tracking of toxic chemicals releasing facilities) Business SIC classification: CHEMICALS AND CHEMICAL PREPARATIONS
Housing units lacking complete plumbing facilities: 4.4% Housing units lacking complete kitchen facilities: 4.0%
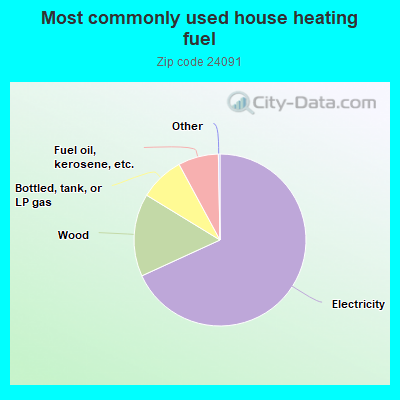
68.3%Electricity
15.6%Wood
8.4%Bottled, tank, or LP gas
7.6%Fuel oil, kerosene, etc.
Population in 1990: 4,833. Population change in the 1990s: +1,529 (+31.6%).
Place of birth for U.S.-born residents:
This state: 5,194
Northeast: 572
Midwest: 292
South: 923
West: 248
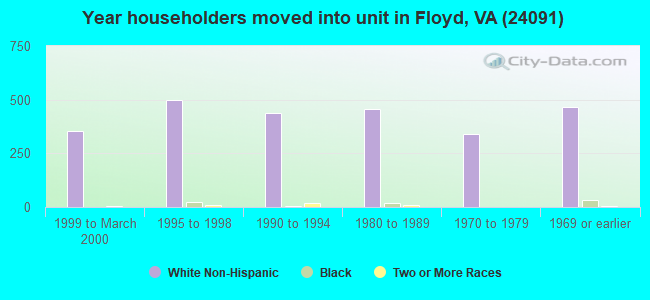
66% of the 24091 zip code residents lived in the same house 5 years ago. Out of people who lived in different houses, 46% lived in this county. Out of people who lived in different counties, 50% lived in Virginia.
92% of the 24091 zip code residents lived in the same house 1 year ago. Out of people who lived in different houses, 76% moved from this county. Out of people who lived in different houses, 10% moved from different county within same state. Out of people who lived in different houses, 9% moved from different state. Out of people who lived in different houses, 0% moved from abroad.
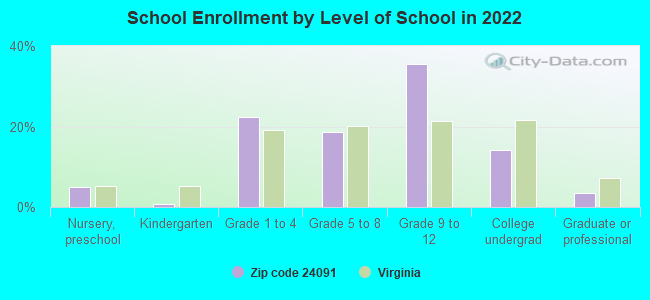
Private vs. public school enrollment:
Students in private schools in grades 1 to 8 (elementary and middle school): 58
Here:
14.0%
Virginia:
13.2%
Students in private schools in grades 9 to 12 (high school): 39
Here:
11.1%
Virginia:
10.2%
Students in private undergraduate colleges: 17
Here:
12.5%
Virginia:
18.7%
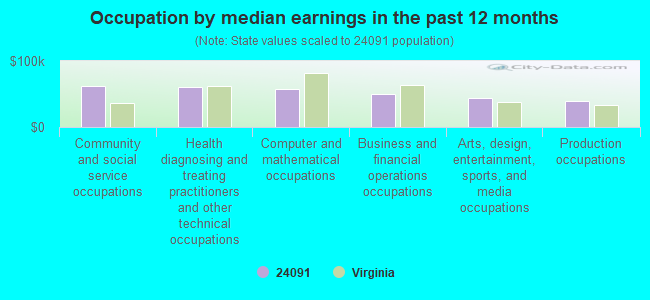
Occupation by median earnings in the past 12 months ($)
62,650Community and social service occupations
60,177Health diagnosing and treating practitioners and other technical occupations
58,271Computer and mathematical occupations
50,170Business and financial operations occupations
43,812Arts, design, entertainment, sports, and media occupations
39,224Production occupations
Top industries in this zip code by the number of employees in 2005:
Health Care and Social Assistance: Offices of Physicians (except Mental Health Specialists) (20-49: 1, 5-9: 2)
Construction: Site Preparation Contractors (10-19: 1, 5-9: 3, 1-4: 2)
People in group quarters in 2010:
85 people in nursing facilities/skilled-nursing facilities
People in group quarters in 2000:
54 people in nursing homes
Fatal accident statistics in 2014:
Fatal accident count: 1
Vehicles involved in fatal accidents: 1
Fatal accidents caused by drunken drivers: 0
Fatalities: 1
Persons involved in fatal accidents: 1
Pedestrians involved in fatal accidents: 0
Fatal accident statistics in 2013:
Fatal accident count: 3
Vehicles involved in fatal accidents: 3
Fatal accidents caused by drunken drivers: 1
Fatalities: 5
Persons involved in fatal accidents: 6
Pedestrians involved in fatal accidents: 0
2002 - 2018 National Fire Incident Reporting System (NFIRS) incidents
Based on the data from the years 2002 - 2018 the average number of fire incidents per year is 42. The highest number of reported fire incidents - 64 took place in 2017, and the least - 30 in 2010. The data has a declining trend.
When looking into fire subcategories, the most incidents belonged to: Structure Fires (48.0%), and Outside Fires (40.3%).
Fire incident types reported to NFIRS in Zip Code 24091


 Nearest zip codes: 24185, 24138, 24149, 24072, 24380, 24079.
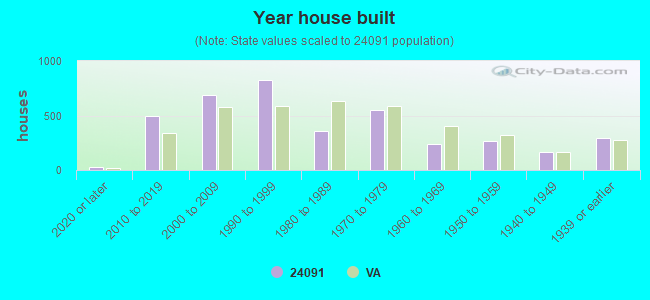


 Based on the data from the years 2002 - 2018 the average number of fire incidents per year is 42. The highest number of reported fire incidents - 64 took place in 2017, and the least - 30 in 2010. The data has a declining trend.
 When looking into fire subcategories, the most incidents belonged to: Structure Fires (48.0%), and Outside Fires (40.3%).