Estimated zip code population in 2022: 2,133 Zip code population in 2010: 1,537 Zip code population in 2000: 1,326
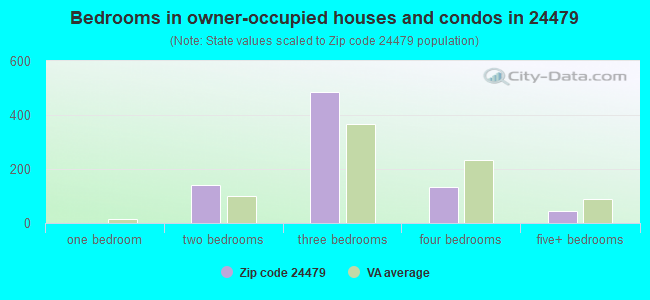
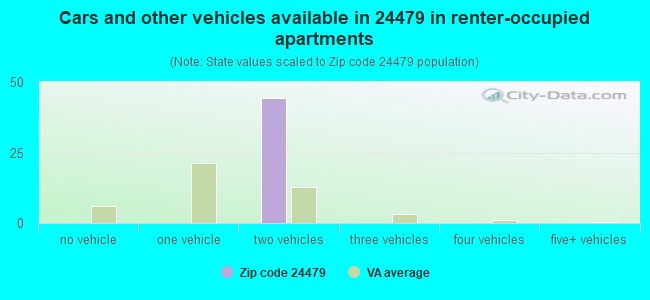
Houses and condos: 838 Renter-occupied apartments: 46
% of renters here:
5%
State:
33%
March 2022 cost of living index in zip code 24479: 84.5 (less than average, U.S. average is 100)
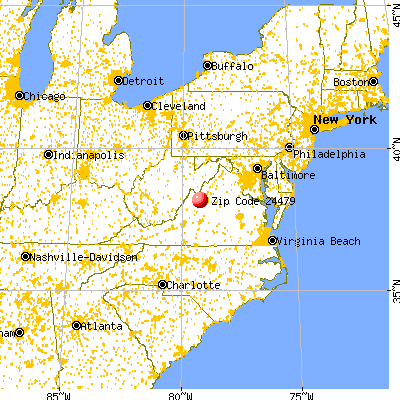
Land area: 60.5 sq. mi. Water area: 0.2 sq. mi.
Population density: 35 people per square mile
(very low).
OSM Map
General Map
Google Map
MSN Map
OSM Map
General Map
Google Map
MSN Map
OSM Map
General Map
Google Map
MSN Map
OSM Map
General Map
Google Map
MSN Map
Please wait while loading the map...
Real estate property taxes paid for housing units in 2022:
This zip code:
0.6% ($2,092)
Virginia:
0.7% ($2,617)
Median real estate property taxes paid for housing units with mortgages in 2022: $2,255 (0.6%) Median real estate property taxes paid for housing units with no mortgage in 2022: $1,832 (0.5%)
Business Search- 14 Million verified businesses
Males: 1,134
(53.2%)
Females: 999
(46.8%)
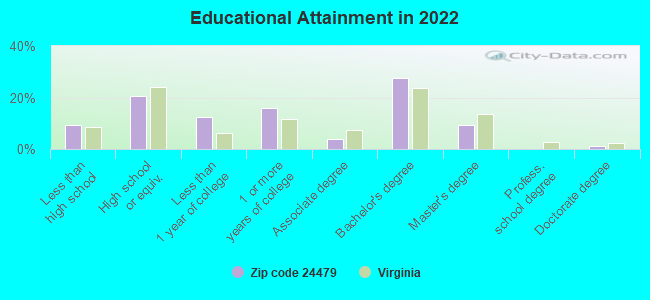
For population 25 years and over in 24479:
High school or higher: 90.2%
Bachelor's degree or higher: 37.6%
Graduate or professional degree: 10.3%
Unemployed: 3.1%
Mean travel time to work (commute): 25.8 minutes
For population 15 years and over in 24479:
Never married: 24.8%
Now married: 57.5%
Separated: 3.3%
Widowed: 8.6%
Divorced: 5.8%
Zip code 24479 compared to state average:
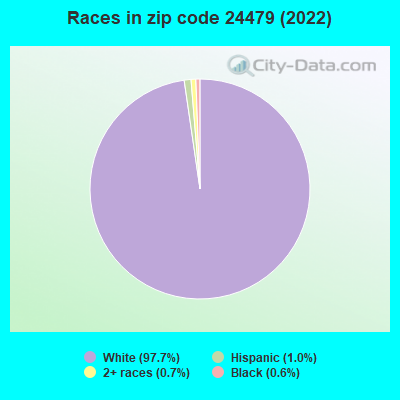
Black race population percentage significantly below state average.
Hispanic race population percentage significantly below state average.
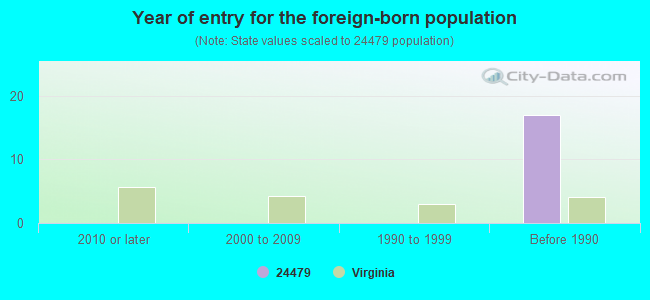
Foreign-born population percentage significantly below state average.
Renting percentage significantly below state average.
Length of stay since moving in significantly below state average.
Number of college students significantly below state average.
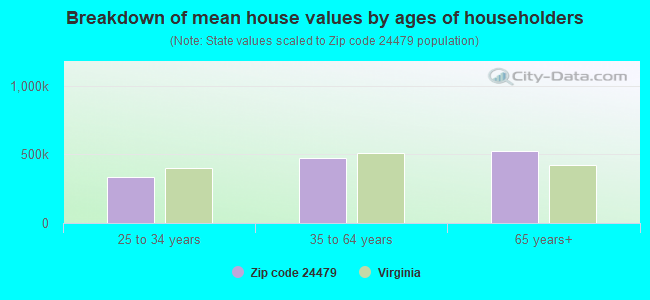
Estimated median house/condo value in 2022: $368,068
24479:
$368,068
Virginia:
$365,700
According to our research of Virginia and other state lists, there were 2 registered sex offenders living in 24479 zip code as of May 28, 2024. The ratio of all residents to sex offenders in zip code 24479 is 673 to 1. The ratio of registered sex offenders to all residents in this zip code is lower than the state average.
Median resident age:
This zip code:
41.3 years
Virginia median age:
39.0 years
Average household size:
This zip code:
2.5 people
Virginia:
2.5 people
Averages for the 2020 tax year for zip code 24479, filed in 2021:
Average Adjusted Gross Income (AGI) in 2020: $62,169 (Individual Income Tax Returns)
Here:
$62,169
State:
$86,446
Salary/wage: $50,502 (reported on 75.7% of returns)
Here:
$50,502
State:
$71,185
(% of AGI for various income ranges: 1071.3% for AGIs below $25k, 3187.7% for AGIs $25k-50k, 6647.5% for AGIs $50k-75k, 8948.3% for AGIs $75k-100k, 16918.6% for AGIs $100k-200k)
Taxable interest for individuals: $1,075 (reported on 37.8% of returns)
This zip code:
$1,075
Virginia:
$1,805
(% of AGI for various income ranges: 34.0% for AGIs below $25k, 28.5% for AGIs $25k-50k, 55.0% for AGIs $50k-75k, 60.0% for AGIs $75k-100k, 190.0% for AGIs $100k-200k)
Ordinary dividends: $6,582 (reported on 23.0% of returns)
Here:
$6,582
State:
$8,327
(% of AGI for various income ranges: 41.3% for AGIs below $25k, 90.8% for AGIs $25k-50k, 253.8% for AGIs $50k-75k, 148.3% for AGIs $75k-100k, 924.3% for AGIs $100k-200k)
Net capital gain/loss in AGI: +$12,400 (reported on 21.6% of returns)
Here:
+$12,400
State:
+$24,644
(% of AGI for various income ranges: 29.3% for AGIs below $25k, 6.2% for AGIs $25k-50k, 45.0% for AGIs $50k-75k, 86.7% for AGIs $75k-100k, 2634.3% for AGIs $100k-200k)
Profit/loss from business: +$8,500 (reported on 16.2% of returns)
Here:
+$8,500
State:
+$12,836
(% of AGI for various income ranges: 81.3% for AGIs below $25k, 222.3% for AGIs $25k-50k, 163.8% for AGIs $50k-75k, 682.9% for AGIs $100k-200k)
Taxable individual retirement arrangement distribution: $17,438 (reported on 10.8% of returns)
24479:
$17,438
Virginia:
$21,535
(% of AGI for various income ranges: 484.6% for AGIs $25k-50k, 1275.0% for AGIs $75k-100k)
Total itemized deductions: $31,029 (reported on 9.5% of returns)
Here:
$31,029
State:
$33,287
(% of AGI for various income ranges: 845.0% for AGIs $50k-75k, 2137.1% for AGIs $100k-200k)
Charity contributions: $19,120 (reported on 6.8% of returns)
Here:
$19,120
State:
$10,381
(% of AGI for various income ranges: 141.3% for AGIs below $25k, 1062.9% for AGIs $100k-200k)
Taxes paid: $6,286 (reported on 9.5% of returns)
24479:
$6,286
State:
$8,284
(% of AGI for various income ranges: 168.8% for AGIs $50k-75k, 435.7% for AGIs $100k-200k)
Earned income credit: $1,644 (reported on 12.2% of returns)
Here:
$1,644
State:
$2,214
(% of AGI for various income ranges: 68.0% for AGIs below $25k, 35.4% for AGIs $25k-50k)
Percentage of individuals using paid preparers for their 2020 taxes: 90.5%
Here:
91%
State:
92%
(% for various income ranges: 86.4% for AGIs below $25k, 93.8% for AGIs $25k-50k, 92.3% for AGIs $50k-75k, 88.9% for AGIs $75k-100k, 108.3% for AGIs $100k-200k, 0.0% for AGIs over 200k)
Averages for the 2012 tax year for zip code 24479, filed in 2013:
Average Adjusted Gross Income (AGI) in 2012: $49,099 (Individual Income Tax Returns)
Here:
$49,099
State:
$71,192
Salary/wage: $40,384 (reported on 82.4% of returns)
Here:
$40,384
State:
$59,229
(% of AGI for various income ranges: 71.3% for AGIs below $25k, 79.1% for AGIs $25k-50k, 72.9% for AGIs $50k-75k, 73.6% for AGIs $75k-100k, 53.5% for AGIs $100k-200k)
Taxable interest for individuals: $1,044 (reported on 45.9% of returns)
This zip code:
$1,044
Virginia:
$1,600
(% of AGI for various income ranges: 3.3% for AGIs below $25k, 0.5% for AGIs $25k-50k, 0.7% for AGIs $50k-75k, 0.4% for AGIs $75k-100k, 1.1% for AGIs $100k-200k)
Ordinary dividends: $5,327 (reported on 20.3% of returns)
Here:
$5,327
State:
$6,959
(% of AGI for various income ranges: 1.3% for AGIs below $25k, 0.9% for AGIs $25k-50k, 2.4% for AGIs $50k-75k, 0.8% for AGIs $75k-100k, 3.9% for AGIs $100k-200k)
Net capital gain/loss in AGI: +$6,567 (reported on 16.2% of returns)
Here:
+$6,567
State:
+$16,672
(% of AGI for various income ranges: 6.9% for AGIs $100k-200k)
Profit/loss from business: +$5,364 (reported on 14.9% of returns)
Here:
+$5,364
State:
+$14,116
(% of AGI for various income ranges: 3.3% for AGIs below $25k, 3.0% for AGIs $25k-50k, 1.3% for AGIs $50k-75k, 2.6% for AGIs $75k-100k)
Taxable individual retirement arrangement distribution: $13,089 (reported on 12.2% of returns)
24479:
$13,089
Virginia:
$16,667
(% of AGI for various income ranges: 5.3% for AGIs below $25k, 2.7% for AGIs $25k-50k, 5.6% for AGIs $50k-75k, 3.4% for AGIs $100k-200k)
Total itemized deductions: $17,830 (23% of AGI, reported on 31.1% of returns)
Here:
$17,830
State:
$26,596
Here:
22.8% of AGI
State:
20.1% of AGI
(% of AGI for various income ranges: 12.9% for AGIs $25k-50k, 12.9% for AGIs $50k-75k, 11.4% for AGIs $75k-100k, 12.5% for AGIs $100k-200k)
Charity contributions: $4,106 (reported on 23.0% of returns)
Here:
$4,106
State:
$4,443
(% of AGI for various income ranges: 1.8% for AGIs $25k-50k, 2.2% for AGIs $50k-75k, 1.8% for AGIs $75k-100k, 2.4% for AGIs $100k-200k)
Taxes paid: $5,191 (reported on 31.1% of returns)
24479:
$5,191
State:
$9,951
(% of AGI for various income ranges: 2.8% for AGIs $25k-50k, 2.9% for AGIs $50k-75k, 3.6% for AGIs $75k-100k, 4.6% for AGIs $100k-200k)
Earned income credit: $1,920 (reported on 13.5% of returns)
Here:
$1,920
State:
$2,211
(% of AGI for various income ranges: 3.5% for AGIs below $25k, 1.1% for AGIs $25k-50k)
Percentage of individuals using paid preparers for their 2012 taxes: 56.8%
Here:
57%
State:
46%
(% for various income ranges: 51.9% for AGIs below $25k, 55.6% for AGIs $25k-50k, 61.5% for AGIs $50k-75k, 62.5% for AGIs $75k-100k, 62.5% for AGIs $100k-200k)
Averages for the 2004 tax year for zip code 24479, filed in 2005:
Average Adjusted Gross Income (AGI) in 2004: $41,499 (Individual Income Tax Returns)
Here:
$41,499
State:
$56,704
Salary/wage: $35,264 (reported on 84.5% of returns)
Here:
$35,264
State:
$48,441
(% of AGI for various income ranges: 126.8% for AGIs below $10k, 75.1% for AGIs $10k-25k, 76.4% for AGIs $25k-50k, 81.0% for AGIs $50k-75k, 73.9% for AGIs $75k-100k, 50.0% for AGIs over 100k)
Taxable interest for individuals: $1,516 (reported on 52.5% of returns)
This zip code:
$1,516
Virginia:
$1,688
(% of AGI for various income ranges: 6.8% for AGIs below $10k, 3.5% for AGIs $10k-25k, 2.2% for AGIs $25k-50k, 1.1% for AGIs $50k-75k, 1.5% for AGIs $75k-100k, 1.8% for AGIs over 100k)
Taxable dividends: $3,006 (reported on 25.3% of returns)
Here:
$3,006
State:
$4,028
(% of AGI for various income ranges: 6.8% for AGIs below $10k, 0.7% for AGIs $10k-25k, 1.6% for AGIs $25k-50k, 0.4% for AGIs $50k-75k, 0.7% for AGIs $75k-100k, 4.5% for AGIs over 100k)
Net capital gain/loss: +$8,673 (reported on 21.2% of returns)
Here:
+$8,673
State:
+$14,375
(% of AGI for various income ranges: -6.0% for AGIs below $10k, -0.5% for AGIs $10k-25k, 0.9% for AGIs $25k-50k, 0.8% for AGIs $50k-75k, 1.7% for AGIs $75k-100k, 16.9% for AGIs over 100k)
Profit/loss from business: +$8,848 (reported on 14.0% of returns)
Here:
+$8,848
State:
+$13,342
(% of AGI for various income ranges: 10.9% for AGIs below $10k, 1.3% for AGIs $10k-25k, 6.9% for AGIs $25k-50k, 4.3% for AGIs $50k-75k, -0.4% for AGIs over 100k)
IRA payment deduction: $3,071 (reported on 2.0% of returns)
24479:
$3,071
Virginia:
$2,943
Total itemized deductions: $16,639 (24% of AGI, reported on 29.0% of returns)
Here:
$16,639
State:
$21,492
Here:
23.6% of AGI
State:
21.0% of AGI
(% of AGI for various income ranges: 56.1% for AGIs below $10k, 10.2% for AGIs $25k-50k, 11.8% for AGIs $50k-75k, 13.6% for AGIs $75k-100k, 12.8% for AGIs over 100k)
Charity contributions deductions: $3,926 (5% of AGI, reported on 24.7% of returns)
Here:
$3,926
State:
$3,794
Here:
5.4% of AGI
State:
3.5% of AGI
(% of AGI for various income ranges: 3.9% for AGIs below $10k, 1.8% for AGIs $25k-50k, 2.0% for AGIs $50k-75k, 2.7% for AGIs $75k-100k, 3.8% for AGIs over 100k)
Total tax: $5,039 (reported on 78.7% of returns)
24479:
$5,039
State:
$9,537
(% of AGI for various income ranges: 2.7% for AGIs below $10k, 4.8% for AGIs $10k-25k, 6.7% for AGIs $25k-50k, 9.0% for AGIs $50k-75k, 10.5% for AGIs $75k-100k, 15.1% for AGIs over 100k)
Earned income credit: $1,473 (reported on 12.9% of returns)
Here:
$1,473
State:
$1,734
Percentage of individuals using paid preparers for their 2004 taxes: 61.9%
Here:
62%
State:
52%
(% for various income ranges: 51.2% for AGIs below $10k, 59.1% for AGIs $10k-25k, 66.3% for AGIs $25k-50k, 58.3% for AGIs $50k-75k, 72.9% for AGIs $75k-100k, 75.6% for AGIs over 100k)
Notable locations in zip code 24479: Augusta Springs YCC Camp (A), Camp Shenandoah (B), Lovingston Volunteer Fire Department Thomas Branch (C). Display/hide their locations on the map
Churches in zip code 24479 include: Bethlehem Church (A), Mount View Church (B), Mount Zion Church (C), Hebron Church (D). Display/hide their locations on the map
Streams, rivers, and creeks: Trout Branch (A), Fall Branch (B), Elliott Springs Run (C), Daniel Run (D), Back Creek (E). Display/hide their locations on the map
Facilities with environmental interests located in this zip code:
BUFFALO GAP HIGH SCHOOL (1800 BUFFALO GAP HIGHWAY in SWOOPE, VA)
AIR MINOR (AIRS/AFS) STATE MASTER (Virginia pollutants databases) - CEDS-80294, AIR PROGRAM (National Center for Education Statistics) - STATE ID-0080660 Business SIC and NAICS classification: ELEMENTARY AND SECONDARY SCHOOLS Organizations: AUGUSTA COUNTY PUBLIC SCHOOLS (SCHOOL DISTRICT)
CAMP SHENANDOAH STP (222 BOY SCOUT LN in SWOOPE, VA)
National Pollutant Discharge Elimination System NON-MAJOR (Tracking pollutant discharge elimination systems) - permit Business SIC classification: SPORTING AND RECREATIONAL CAMPS Alternative names: CAMP SHENANDOAH-BOY SCOUTS OF
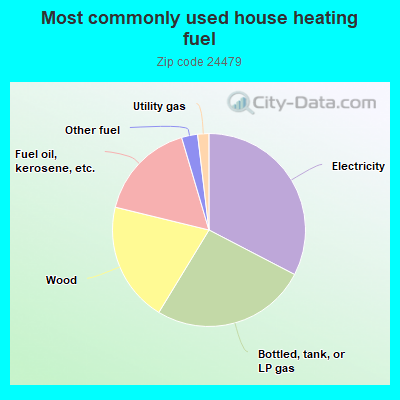
32.8%Electricity
26.2%Bottled, tank, or LP gas
20.2%Wood
16.7%Fuel oil, kerosene, etc.
2.7%Other fuel
1.9%Utility gas
Population in 1990: 1,477.
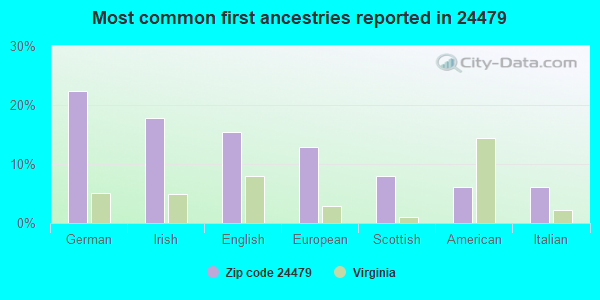
Place of birth for U.S.-born residents:
This state: 1,387
Northeast: 431
Midwest: 26
South: 203
West: 59
66% of the 24479 zip code residents lived in the same house 5 years ago. Out of people who lived in different houses, 60% lived in this county. Out of people who lived in different counties, 50% lived in Virginia.
78% of the 24479 zip code residents lived in the same house 1 year ago. Out of people who lived in different houses, 15% moved from this county. Out of people who lived in different houses, 79% moved from different county within same state. Out of people who lived in different houses, 5% moved from abroad.
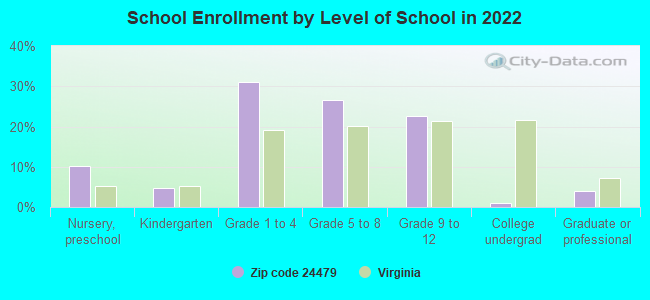
Private vs. public school enrollment:
Students in private schools in grades 1 to 8 (elementary and middle school): 50
Here:
16.6%
Virginia:
13.2%
Students in private schools in grades 9 to 12 (high school): 62
Here:
52.4%
Virginia:
10.2%
Students in private undergraduate colleges:
Here:
0.0%
Virginia:
18.7%
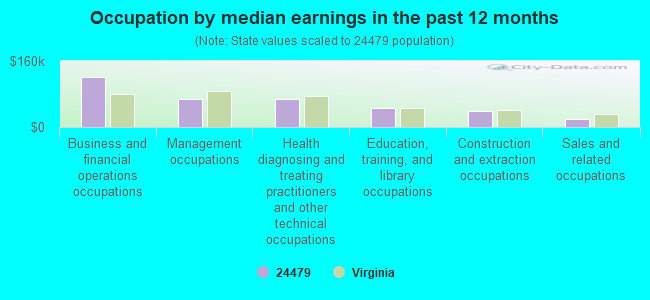
Occupation by median earnings in the past 12 months ($)
121,351Business and financial operations occupations
68,939Management occupations
67,220Health diagnosing and treating practitioners and other technical occupations
46,139Education, training, and library occupations
39,356Construction and extraction occupations
18,904Sales and related occupations
Top industries in this zip code by the number of employees in 2005:
Professional, Scientific, and Technical Services: Research and Development in the Social Sciences and Humanities (1-4: 1)
Other Services (except Public Administration): Religious Organizations (1-4: 1)
Accommodation and Food Services: Full-Service Restaurants (1-4: 1)
Other Services (except Public Administration): Car Washes (1-4: 1)
Fatal accident statistics in 2012:
Fatal accident count: 2
Vehicles involved in fatal accidents: 2
Fatal accidents caused by drunken drivers: 0
Fatalities: 2
Persons involved in fatal accidents: 2
Pedestrians involved in fatal accidents: 0
Fatal accident statistics in 2011:
Fatal accident count: 2
Vehicles involved in fatal accidents: 2
Fatal accidents caused by drunken drivers: 0
Fatalities: 2
Persons involved in fatal accidents: 5
Pedestrians involved in fatal accidents: 0
2002 - 2018 National Fire Incident Reporting System (NFIRS) incidents
Based on the data from the years 2002 - 2018 the average number of fire incidents per year is 22. The highest number of reported fire incidents - 40 took place in 2006, and the least - 6 in 2003. The data has a dropping trend.
When looking into fire subcategories, the most reports belonged to: Structure Fires (55.1%), and Outside Fires (34.4%).
Fire incident types reported to NFIRS in Zip Code 24479


 Nearest zip codes: 24421, 24411, 24430, 24485, 24459, 24401.


 (Students: 620, Location: 1800 BUFFALO GAP HWY, Grades: 9-12)


 Based on the data from the years 2002 - 2018 the average number of fire incidents per year is 22. The highest number of reported fire incidents - 40 took place in 2006, and the least - 6 in 2003. The data has a dropping trend.
 When looking into fire subcategories, the most reports belonged to: Structure Fires (55.1%), and Outside Fires (34.4%).