Estimated zip code population in 2022: 1,508 Zip code population in 2010: 1,593 Zip code population in 2000: 1,854
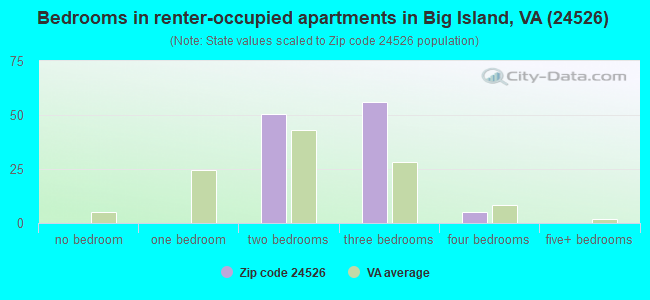
Houses and condos: 726 Renter-occupied apartments: 113
% of renters here:
17%
State:
33%
March 2022 cost of living index in zip code 24526: 84.4 (less than average, U.S. average is 100)
Land area: 65.3 sq. mi. Water area: 0.7 sq. mi.
Population density: 23 people per square mile
(very low).
OSM Map
General Map
Google Map
MSN Map
OSM Map
General Map
Google Map
MSN Map
OSM Map
General Map
Google Map
MSN Map
OSM Map
General Map
Google Map
MSN Map
Please wait while loading the map...
Real estate property taxes paid for housing units in 2022:
This zip code:
0.4% ($890)
Virginia:
0.7% ($2,617)
Median real estate property taxes paid for housing units with mortgages in 2022: $942 (0.4%) Median real estate property taxes paid for housing units with no mortgage in 2022: $856 (0.5%)
Business Search- 14 Million verified businesses
Males: 713
(47.3%)
Females: 795
(52.7%)
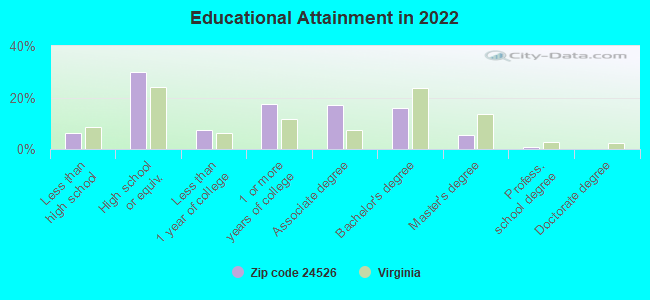
For population 25 years and over in 24526:
High school or higher: 93.2%
Bachelor's degree or higher: 21.9%
Graduate or professional degree: 6.2%
Mean travel time to work (commute): 27.1 minutes
For population 15 years and over in 24526:
Never married: 21.7%
Now married: 66.7%
Separated: 1.2%
Widowed: 4.3%
Divorced: 6.3%
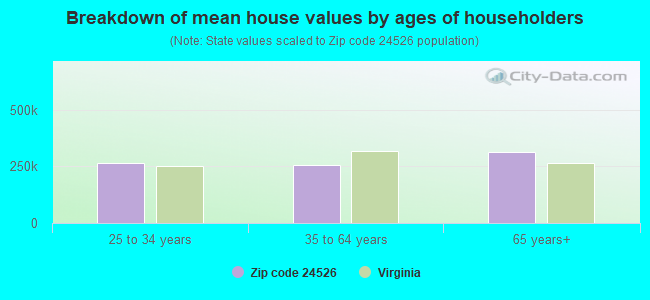
Zip code 24526 compared to state average:
Median house value below state average.
Unemployed percentage significantly below state average.
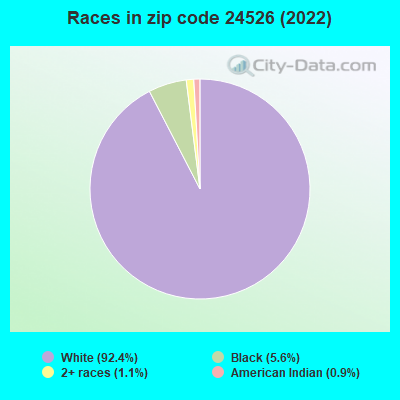
Black race population percentage significantly below state average.
Hispanic race population percentage significantly below state average.
Foreign-born population percentage significantly below state average.
Renting percentage below state average.
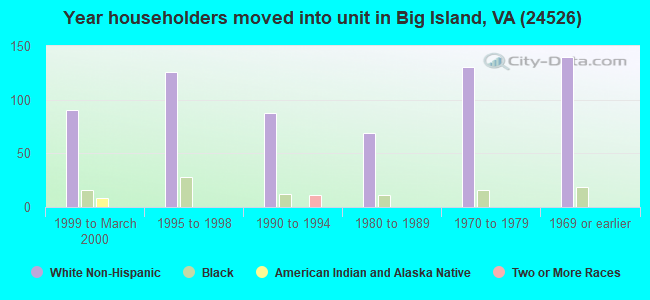
Length of stay since moving in significantly above state average.
Percentage of population with a bachelor's degree or higher below state average.
Averages for the 2020 tax year for zip code 24526, filed in 2021:
Average Adjusted Gross Income (AGI) in 2020: $64,452 (Individual Income Tax Returns)
Here:
$64,452
State:
$86,446
Salary/wage: $51,982 (reported on 79.7% of returns)
Here:
$51,982
State:
$71,185
(% of AGI for various income ranges: 1268.0% for AGIs below $25k, 3130.8% for AGIs $25k-50k, 5815.7% for AGIs $50k-75k, 8992.0% for AGIs $75k-100k, 17102.9% for AGIs $100k-200k)
Taxable interest for individuals: $868 (reported on 34.4% of returns)
This zip code:
$868
Virginia:
$1,805
(% of AGI for various income ranges: 12.7% for AGIs below $25k, 23.8% for AGIs $25k-50k, 15.7% for AGIs $50k-75k, 32.0% for AGIs $75k-100k, 162.9% for AGIs $100k-200k)
Ordinary dividends: $2,027 (reported on 17.2% of returns)
Here:
$2,027
State:
$8,327
(% of AGI for various income ranges: 14.7% for AGIs below $25k, 30.8% for AGIs $25k-50k, 177.1% for AGIs $50k-75k, 52.9% for AGIs $100k-200k)
Net capital gain/loss in AGI: +$13,311 (reported on 14.1% of returns)
Here:
+$13,311
State:
+$24,644
(% of AGI for various income ranges: 37.3% for AGIs below $25k, 325.7% for AGIs $50k-75k, 1305.7% for AGIs $100k-200k)
Profit/loss from business: +$3,440 (reported on 7.8% of returns)
Here:
+$3,440
State:
+$12,836
(% of AGI for various income ranges: 99.3% for AGIs below $25k, 32.9% for AGIs $50k-75k)
Taxable individual retirement arrangement distribution: $17,425 (reported on 12.5% of returns)
24526:
$17,425
Virginia:
$21,535
(% of AGI for various income ranges: 94.0% for AGIs below $25k, 383.1% for AGIs $25k-50k, 1510.0% for AGIs $75k-100k)
Total itemized deductions: $34,350 (reported on 6.2% of returns)
Here:
$34,350
State:
$33,287
(% of AGI for various income ranges: 1962.9% for AGIs $100k-200k)
Charity contributions: $14,100 (reported on 4.7% of returns)
Here:
$14,100
State:
$10,381
(% of AGI for various income ranges: 604.3% for AGIs $100k-200k)
Taxes paid: $7,600 (reported on 6.2% of returns)
24526:
$7,600
State:
$8,284
(% of AGI for various income ranges: 434.3% for AGIs $100k-200k)
Earned income credit: $2,000 (reported on 14.1% of returns)
Here:
$2,000
State:
$2,214
(% of AGI for various income ranges: 83.3% for AGIs below $25k, 42.3% for AGIs $25k-50k)
Percentage of individuals using paid preparers for their 2020 taxes: 93.8%
Here:
94%
State:
92%
(% for various income ranges: 95.2% for AGIs below $25k, 100.0% for AGIs $25k-50k, 88.9% for AGIs $50k-75k, 85.7% for AGIs $75k-100k, 90.9% for AGIs $100k-200k)
Averages for the 2012 tax year for zip code 24526, filed in 2013:
Average Adjusted Gross Income (AGI) in 2012: $49,360 (Individual Income Tax Returns)
Here:
$49,360
State:
$71,192
Salary/wage: $44,517 (reported on 85.5% of returns)
Here:
$44,517
State:
$59,229
(% of AGI for various income ranges: 78.8% for AGIs below $25k, 78.7% for AGIs $25k-50k, 82.6% for AGIs $50k-75k, 81.7% for AGIs $75k-100k, 69.4% for AGIs $100k-200k)
Taxable interest for individuals: $604 (reported on 38.7% of returns)
This zip code:
$604
Virginia:
$1,600
(% of AGI for various income ranges: 1.2% for AGIs below $25k, 0.6% for AGIs $25k-50k, 0.6% for AGIs $50k-75k, 0.3% for AGIs $75k-100k, 0.1% for AGIs $100k-200k)
Ordinary dividends: $1,960 (reported on 16.1% of returns)
Here:
$1,960
State:
$6,959
(% of AGI for various income ranges: 2.2% for AGIs below $25k, 0.7% for AGIs $50k-75k, 0.8% for AGIs $100k-200k)
Profit/loss from business: +$3,180 (reported on 8.1% of returns)
Here:
+$3,180
State:
+$14,116
Taxable individual retirement arrangement distribution: $8,957 (reported on 11.3% of returns)
24526:
$8,957
Virginia:
$16,667
Total itemized deductions: $18,636 (19% of AGI, reported on 22.6% of returns)
Here:
$18,636
State:
$26,596
Here:
19.4% of AGI
State:
20.1% of AGI
(% of AGI for various income ranges: 7.5% for AGIs $25k-50k, 7.8% for AGIs $50k-75k, 7.1% for AGIs $75k-100k, 12.9% for AGIs $100k-200k)
Charity contributions: $3,925 (reported on 19.4% of returns)
Here:
$3,925
State:
$4,443
(% of AGI for various income ranges: 0.8% for AGIs $25k-50k, 2.1% for AGIs $50k-75k, 2.8% for AGIs $100k-200k)
Taxes paid: $5,771 (reported on 22.6% of returns)
24526:
$5,771
State:
$9,951
(% of AGI for various income ranges: 1.6% for AGIs $25k-50k, 2.0% for AGIs $50k-75k, 2.5% for AGIs $75k-100k, 4.5% for AGIs $100k-200k)
Earned income credit: $2,030 (reported on 16.1% of returns)
Here:
$2,030
State:
$2,211
(% of AGI for various income ranges: 5.0% for AGIs below $25k, 1.0% for AGIs $25k-50k)
Percentage of individuals using paid preparers for their 2012 taxes: 54.8%
Here:
55%
State:
46%
(% for various income ranges: 52.2% for AGIs below $25k, 53.3% for AGIs $25k-50k, 54.5% for AGIs $50k-75k, 66.7% for AGIs $75k-100k, 57.1% for AGIs $100k-200k)
Averages for the 2004 tax year for zip code 24526, filed in 2005:
Average Adjusted Gross Income (AGI) in 2004: $40,411 (Individual Income Tax Returns)
Here:
$40,411
State:
$56,704
Salary/wage: $39,100 (reported on 88.3% of returns)
Here:
$39,100
State:
$48,441
(% of AGI for various income ranges: 145.6% for AGIs below $10k, 81.8% for AGIs $10k-25k, 81.7% for AGIs $25k-50k, 88.3% for AGIs $50k-75k, 93.8% for AGIs $75k-100k, 78.2% for AGIs over 100k)
Taxable interest for individuals: $1,003 (reported on 45.2% of returns)
This zip code:
$1,003
Virginia:
$1,688
(% of AGI for various income ranges: 8.8% for AGIs below $10k, 2.5% for AGIs $10k-25k, 0.9% for AGIs $25k-50k, 0.7% for AGIs $50k-75k, 0.3% for AGIs $75k-100k, 1.2% for AGIs over 100k)
Taxable dividends: $1,355 (reported on 18.3% of returns)
Here:
$1,355
State:
$4,028
(% of AGI for various income ranges: 0.9% for AGIs $10k-25k, 0.7% for AGIs $25k-50k, 0.8% for AGIs $50k-75k, 0.1% for AGIs $75k-100k, 0.7% for AGIs over 100k)
Net capital gain/loss: +$2,299 (reported on 15.8% of returns)
Here:
+$2,299
State:
+$14,375
(% of AGI for various income ranges: -3.3% for AGIs below $10k, -0.4% for AGIs $10k-25k, 0.4% for AGIs $25k-50k, 0.8% for AGIs $50k-75k, 0.0% for AGIs $75k-100k, 2.9% for AGIs over 100k)
IRA payment deduction: $2,353 (reported on 2.5% of returns)
24526:
$2,353
Virginia:
$2,943
Total itemized deductions: $15,787 (20% of AGI, reported on 24.2% of returns)
Here:
$15,787
State:
$21,492
Here:
19.6% of AGI
State:
21.0% of AGI
(% of AGI for various income ranges: 7.9% for AGIs $25k-50k, 11.3% for AGIs $50k-75k, 10.1% for AGIs $75k-100k, 13.5% for AGIs over 100k)
Charity contributions deductions: $3,356 (4% of AGI, reported on 19.9% of returns)
Here:
$3,356
State:
$3,794
Here:
3.8% of AGI
State:
3.5% of AGI
(% of AGI for various income ranges: 1.1% for AGIs $25k-50k, 1.2% for AGIs $50k-75k, 1.9% for AGIs $75k-100k, 3.3% for AGIs over 100k)
Total tax: $4,851 (reported on 77.4% of returns)
24526:
$4,851
State:
$9,537
(% of AGI for various income ranges: 3.3% for AGIs below $10k, 4.0% for AGIs $10k-25k, 6.3% for AGIs $25k-50k, 8.1% for AGIs $50k-75k, 10.1% for AGIs $75k-100k, 15.2% for AGIs over 100k)
Earned income credit: $1,670 (reported on 15.2% of returns)
Here:
$1,670
State:
$1,734
Percentage of individuals using paid preparers for their 2004 taxes: 59.1%
Here:
59%
State:
52%
(% for various income ranges: 49.6% for AGIs below $10k, 60.5% for AGIs $10k-25k, 61.6% for AGIs $25k-50k, 68.3% for AGIs $50k-75k, 51.8% for AGIs $75k-100k, 58.3% for AGIs over 100k)
Household received Food Stamps/SNAP in the past 12 months: 26 Household did not receive Food Stamps/SNAP in the past 12 months: 613
Women who had a birth in the past 12 months: 25 (25 now married, 0 unmarried) Women who did not have a birth in the past 12 months: 334 (171 now married, 162 unmarried)
Housing units in zip code 24526 with a mortgage: 257 (9 second mortgage, 9 both second mortgage and home equity loan) Houses without a mortgage: 11
Median monthly owner costs for units with a mortgage: $1,072 Median monthly owner costs for units without a mortgage: $289
Residents with income below the poverty level in 2022:
This zip code:
3.6%
Whole state:
10.6%
Residents with income below 50% of the poverty level in 2022:
This zip code:
1.4%
Whole state:
5.2%
Median number of rooms in houses and condos:
Here:
5.5
State:
7.0
Median number of rooms in apartments:
Here:
5.0
State:
4.3
Notable locations in this zip code not listed on our city pages
Notable locations in zip code 24526: Matts Creek Shelter (A), Bear Camp (B), Otter Creek Flats Overlook (C), Upper Otter Creek Overlook (D), Terrapin Mountain Overlook (E), Lower Otter Creek Overlook (F), James River Valley Overlook (G), Appomattox Volunteer Fire Company (H), Big Island Life Saving Squad 2 (I), Big Island Volunteer Fire Department Company 2 (J). Display/hide their locations on the map
Churches in zip code 24526 include: Chestnut Hill Church (A), Gospel Tabernacle (B), Hunting Creek Church (C), Reed Creek Church (D), Sharon Church (E). Display/hide their locations on the map
Streams, rivers, and creeks: Terrapin Creek (A), Snow Creek (B), Skimmer Creek (C), Rocky Row Run (D), Reed Creek (E), Peters Creek (F), Nelson Creek (G), Meadow Creek (H), Matts Creek (I). Display/hide their locations on the map
In group quarters: 4 (-1 institutionalized population)
Size of family households: 242 2-persons, 112 3-persons, 42 4-persons, 34 5-persons, 30 6-persons
Size of nonfamily households: 124 1-person, 62 2-persons
241 married couples with children.
97 single-parent households (97 women).
All residents speak English at home
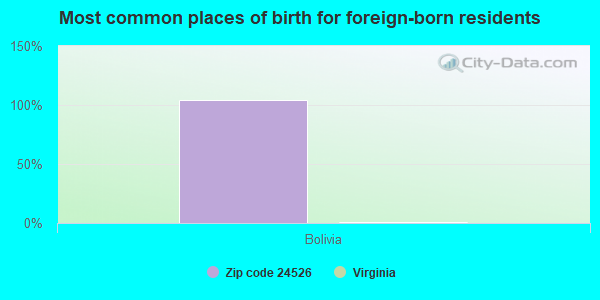
Foreign born population: 25 (1.7%) (100.0% of them are naturalized citizens)
This zip code:
1.7%
Whole state:
12.7%
104%Bolivia
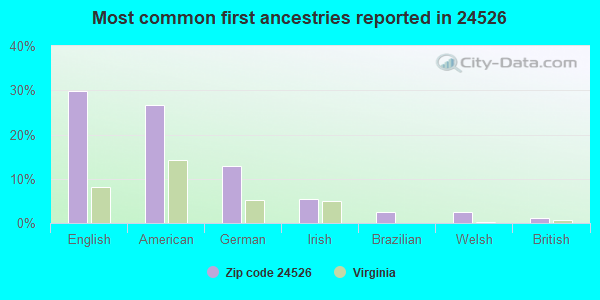
30%English
27%American
13%German
5%Irish
2%Brazilian
2%Welsh
1%British
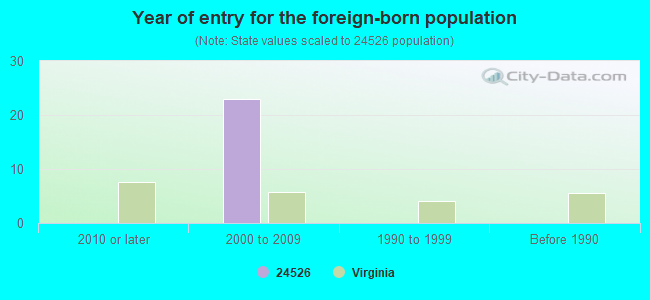
Year of entry for the foreign-born population
02010 or later
232000 to 2009
01990 to 1999
0Before 1990
Facilities with environmental interests located in this zip code:
BEDFORD CO - BIG ISLAND ELEMENTARY (111 SCHOOL DAYS in BIG ISLAND, VA)
AIR MINOR (AIRS/AFS) STATE MASTER (Virginia pollutants databases) - CEDS-30197, AIR PROGRAM (Geographic Names Information System) (National Center for Education Statistics) - STATE ID-0100030 Business SIC and NAICS classification: ELEMENTARY AND SECONDARY SCHOOLS Organizations: BEDFORD COUNTY PUBLIC SCHOOLS (SCHOOL DISTRICT)
Alternative names: BIG ISLAND ELEM., BIG ISLAND ELEMENTARY SCHOOL
Housing units lacking complete plumbing facilities: 2.8% Housing units lacking complete kitchen facilities: 4.1%
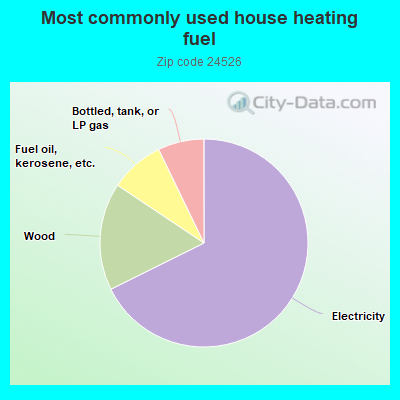
68.0%Electricity
16.8%Wood
8.5%Fuel oil, kerosene, etc.
7.2%Bottled, tank, or LP gas
Population in 1990: 1,313. Population change in the 1990s: +541 (+41.2%).
Place of birth for U.S.-born residents:
This state: 1,136
Northeast: 56
Midwest: 55
South: 224
65% of the 24526 zip code residents lived in the same house 5 years ago. Out of people who lived in different houses, 47% lived in this county. Out of people who lived in different counties, 50% lived in Virginia.
101% of the 24526 zip code residents lived in the same house 1 year ago.
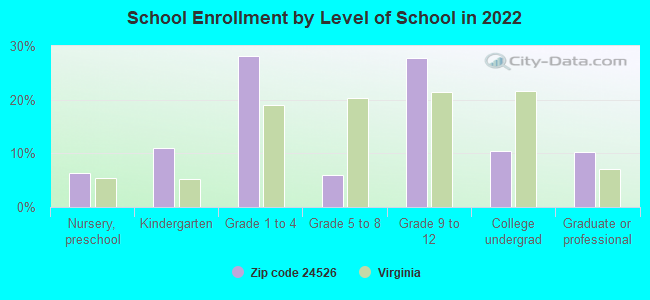
Private vs. public school enrollment:
Students in private schools in grades 1 to 8 (elementary and middle school): 61
Here:
45.5%
Virginia:
13.2%
Students in private schools in grades 9 to 12 (high school): 13
Here:
12.6%
Virginia:
10.2%
Students in private undergraduate colleges: 32
Here:
89.2%
Virginia:
18.7%
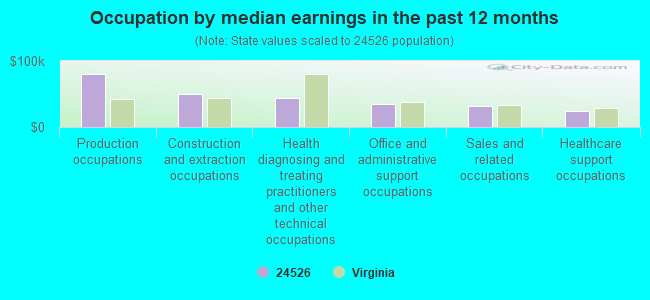
Occupation by median earnings in the past 12 months ($)
79,846Production occupations
50,035Construction and extraction occupations
44,269Health diagnosing and treating practitioners and other technical occupations
35,501Office and administrative support occupations
32,421Sales and related occupations
24,660Healthcare support occupations
Top industries in this zip code by the number of employees in 2005:
Health Care and Social Assistance: Community Food Services (20-49 employees: 1 establishment)
Other Services (except Public Administration): Religious Organizations (5-9: 1, 1-4: 3)
Other Services (except Public Administration): Labor Unions and Similar Labor Organizations (5-9: 1)
Finance and Insurance: Credit Unions (5-9: 1)
Other Services (except Public Administration): Civic and Social Organizations (1-4: 1)
Administrative and Support and Waste Management and Remediation Services: Janitorial Services (1-4: 1)
People in group quarters in 2000:
3 people in homes for the mentally retarded
Fatal accident statistics in 2012:
Fatal accident count: 1
Vehicles involved in fatal accidents: 1
Fatal accidents caused by drunken drivers: 0
Fatalities: 1
Persons involved in fatal accidents: 1
Pedestrians involved in fatal accidents: 0
Home Mortgage Disclosure Act Aggregated Statistics For Year 2009 (Based on 4 partial tracts)
A) FHA, FSA/RHS & VA Home Purchase Loans
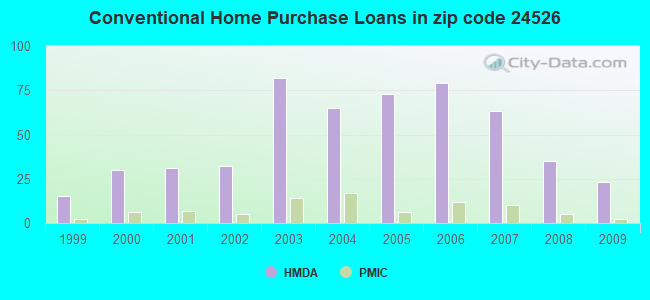
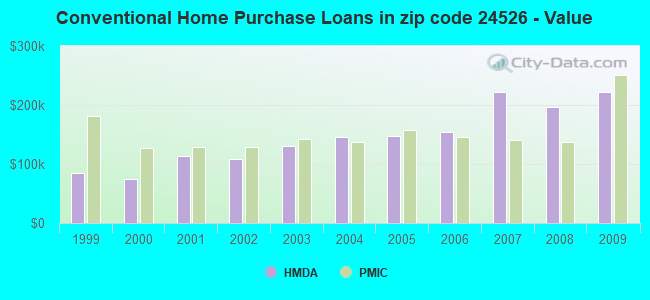
B) Conventional Home Purchase Loans
C) Refinancings
D) Home Improvement Loans
F) Non-occupant Loans on < 5 Family Dwellings (A B C & D)
G) Loans On Manufactured Home Dwelling (A B C & D)
Number
Average Value
Number
Average Value
Number
Average Value
Number
Average Value
Number
Average Value
Number
Average Value
LOANS ORIGINATED
8
$171,644
23
$222,470
153
$194,372
4
$118,250
11
$148,934
4
$84,055
APPLICATIONS APPROVED, NOT ACCEPTED
3
$67,763
0
$0
5
$225,524
1
$21,250
0
$0
0
$0
APPLICATIONS DENIED
2
$129,215
2
$109,010
31
$192,403
8
$20,234
3
$151,957
3
$93,847
APPLICATIONS WITHDRAWN
1
$115,870
1
$140,390
20
$177,160
1
$82,650
3
$200,253
0
$0
FILES CLOSED FOR INCOMPLETENESS
1
$242,230
0
$0
9
$155,460
1
$37,180
0
$0
1
$69,060
Aggregated Statistics For Year 2008 (Based on 4 partial tracts)
A) FHA, FSA/RHS & VA Home Purchase Loans
B) Conventional Home Purchase Loans
C) Refinancings
D) Home Improvement Loans
F) Non-occupant Loans on < 5 Family Dwellings (A B C & D)
G) Loans On Manufactured Home Dwelling (A B C & D)
Number
Average Value
Number
Average Value
Number
Average Value
Number
Average Value
Number
Average Value
Number
Average Value
LOANS ORIGINATED
14
$147,808
35
$196,096
115
$163,585
11
$56,967
3
$200,747
7
$98,060
APPLICATIONS APPROVED, NOT ACCEPTED
0
$0
2
$285,085
12
$189,076
0
$0
0
$0
1
$77,870
APPLICATIONS DENIED
1
$167,840
4
$288,308
39
$168,017
11
$59,872
3
$149,090
5
$66,546
APPLICATIONS WITHDRAWN
0
$0
3
$206,420
15
$157,015
2
$117,000
1
$257,620
2
$74,370
FILES CLOSED FOR INCOMPLETENESS
0
$0
1
$268,510
4
$173,580
0
$0
0
$0
0
$0
Aggregated Statistics For Year 2007 (Based on 4 partial tracts)
A) FHA, FSA/RHS & VA Home Purchase Loans
B) Conventional Home Purchase Loans
C) Refinancings
D) Home Improvement Loans
F) Non-occupant Loans on < 5 Family Dwellings (A B C & D)
G) Loans On Manufactured Home Dwelling (A B C & D)
Number
Average Value
Number
Average Value
Number
Average Value
Number
Average Value
Number
Average Value
Number
Average Value
LOANS ORIGINATED
6
$126,272
63
$222,290
112
$161,310
16
$116,736
12
$156,672
8
$98,059
APPLICATIONS APPROVED, NOT ACCEPTED
0
$0
7
$149,780
16
$180,669
2
$104,350
0
$0
4
$89,155
APPLICATIONS DENIED
0
$0
12
$121,881
49
$131,138
13
$60,630
1
$198,290
12
$49,798
APPLICATIONS WITHDRAWN
0
$0
1
$291,370
36
$147,509
3
$11,830
0
$0
4
$82,070
FILES CLOSED FOR INCOMPLETENESS
0
$0
3
$229,783
7
$171,416
0
$0
0
$0
0
$0
Aggregated Statistics For Year 2006 (Based on 4 partial tracts)
A) FHA, FSA/RHS & VA Home Purchase Loans
B) Conventional Home Purchase Loans
C) Refinancings
D) Home Improvement Loans
F) Non-occupant Loans on < 5 Family Dwellings (A B C & D)
G) Loans On Manufactured Home Dwelling (A B C & D)
Number
Average Value
Number
Average Value
Number
Average Value
Number
Average Value
Number
Average Value
Number
Average Value
LOANS ORIGINATED
10
$133,435
79
$154,447
104
$130,648
12
$66,306
18
$126,082
12
$97,538
APPLICATIONS APPROVED, NOT ACCEPTED
0
$0
7
$99,001
16
$99,841
3
$44,440
1
$161,480
4
$70,750
APPLICATIONS DENIED
2
$50,910
14
$85,149
64
$109,264
8
$34,741
1
$20,190
19
$83,618
APPLICATIONS WITHDRAWN
0
$0
9
$158,609
43
$129,094
1
$105,130
1
$106,240
0
$0
FILES CLOSED FOR INCOMPLETENESS
0
$0
1
$123,640
7
$140,223
0
$0
0
$0
0
$0
Aggregated Statistics For Year 2005 (Based on 4 partial tracts)
A) FHA, FSA/RHS & VA Home Purchase Loans
B) Conventional Home Purchase Loans
C) Refinancings
D) Home Improvement Loans
F) Non-occupant Loans on < 5 Family Dwellings (A B C & D)
G) Loans On Manufactured Home Dwelling (A B C & D)
Number
Average Value
Number
Average Value
Number
Average Value
Number
Average Value
Number
Average Value
Number
Average Value
LOANS ORIGINATED
5
$134,134
73
$147,766
130
$142,900
15
$56,828
14
$145,729
11
$85,378
APPLICATIONS APPROVED, NOT ACCEPTED
0
$0
6
$144,185
16
$104,729
2
$81,450
0
$0
1
$70,800
APPLICATIONS DENIED
2
$117,395
8
$89,605
61
$124,463
15
$43,609
1
$129,710
14
$77,774
APPLICATIONS WITHDRAWN
1
$132,800
5
$166,274
46
$123,317
4
$72,515
2
$112,085
12
$86,601
FILES CLOSED FOR INCOMPLETENESS
0
$0
4
$144,722
10
$109,904
0
$0
0
$0
1
$59,490
Aggregated Statistics For Year 2004 (Based on 4 partial tracts)
A) FHA, FSA/RHS & VA Home Purchase Loans
B) Conventional Home Purchase Loans
C) Refinancings
D) Home Improvement Loans
F) Non-occupant Loans on < 5 Family Dwellings (A B C & D)
G) Loans On Manufactured Home Dwelling (A B C & D)
Number
Average Value
Number
Average Value
Number
Average Value
Number
Average Value
Number
Average Value
Number
Average Value
LOANS ORIGINATED
3
$141,033
65
$146,478
109
$122,494
15
$39,507
9
$106,587
7
$69,187
APPLICATIONS APPROVED, NOT ACCEPTED
0
$0
9
$179,890
18
$134,637
3
$25,823
0
$0
4
$110,152
APPLICATIONS DENIED
0
$0
11
$124,959
71
$106,338
8
$57,212
3
$83,327
11
$82,520
APPLICATIONS WITHDRAWN
0
$0
4
$323,660
38
$97,583
3
$104,117
2
$79,410
4
$114,208
FILES CLOSED FOR INCOMPLETENESS
0
$0
0
$0
6
$98,832
0
$0
0
$0
0
$0
Aggregated Statistics For Year 2003 (Based on 4 partial tracts)
A) FHA, FSA/RHS & VA Home Purchase Loans
B) Conventional Home Purchase Loans
C) Refinancings
D) Home Improvement Loans
F) Non-occupant Loans on < 5 Family Dwellings (A B C & D)
Number
Average Value
Number
Average Value
Number
Average Value
Number
Average Value
Number
Average Value
LOANS ORIGINATED
7
$122,941
82
$130,057
225
$122,600
30
$79,715
12
$87,492
APPLICATIONS APPROVED, NOT ACCEPTED
0
$0
6
$143,397
29
$108,203
0
$0
0
$0
APPLICATIONS DENIED
2
$50,525
21
$58,830
71
$102,923
5
$15,868
5
$33,782
APPLICATIONS WITHDRAWN
0
$0
5
$154,344
39
$149,542
2
$148,735
0
$0
FILES CLOSED FOR INCOMPLETENESS
0
$0
4
$166,230
9
$116,562
1
$43,130
0
$0
Aggregated Statistics For Year 2002 (Based on 2 partial tracts)
A) FHA, FSA/RHS & VA Home Purchase Loans
B) Conventional Home Purchase Loans
C) Refinancings
D) Home Improvement Loans
F) Non-occupant Loans on < 5 Family Dwellings (A B C & D)
Number
Average Value
Number
Average Value
Number
Average Value
Number
Average Value
Number
Average Value
LOANS ORIGINATED
5
$100,928
32
$108,166
104
$115,577
6
$11,510
4
$65,338
APPLICATIONS APPROVED, NOT ACCEPTED
0
$0
8
$74,235
16
$82,535
0
$0
0
$0
APPLICATIONS DENIED
1
$90,300
4
$54,712
31
$65,869
3
$10,623
0
$0
APPLICATIONS WITHDRAWN
0
$0
4
$66,665
37
$92,917
3
$27,267
0
$0
FILES CLOSED FOR INCOMPLETENESS
0
$0
0
$0
4
$114,208
0
$0
0
$0
Aggregated Statistics For Year 2001 (Based on 2 partial tracts)
A) FHA, FSA/RHS & VA Home Purchase Loans
B) Conventional Home Purchase Loans
C) Refinancings
D) Home Improvement Loans
F) Non-occupant Loans on < 5 Family Dwellings (A B C & D)
Number
Average Value
Number
Average Value
Number
Average Value
Number
Average Value
Number
Average Value
LOANS ORIGINATED
1
$164,670
31
$114,362
73
$95,252
7
$9,410
2
$113,675
APPLICATIONS APPROVED, NOT ACCEPTED
0
$0
7
$42,951
6
$85,700
3
$28,330
0
$0
APPLICATIONS DENIED
1
$226,290
22
$56,162
44
$65,289
6
$26,737
0
$0
APPLICATIONS WITHDRAWN
0
$0
10
$72,668
34
$79,586
2
$73,305
0
$0
FILES CLOSED FOR INCOMPLETENESS
0
$0
0
$0
6
$70,473
0
$0
0
$0
Aggregated Statistics For Year 2000 (Based on 2 partial tracts)
A) FHA, FSA/RHS & VA Home Purchase Loans
B) Conventional Home Purchase Loans
C) Refinancings
D) Home Improvement Loans
F) Non-occupant Loans on < 5 Family Dwellings (A B C & D)
Number
Average Value
Number
Average Value
Number
Average Value
Number
Average Value
Number
Average Value
LOANS ORIGINATED
5
$96,254
30
$73,978
41
$78,488
23
$21,525
7
$89,241
APPLICATIONS APPROVED, NOT ACCEPTED
0
$0
14
$39,764
5
$70,756
0
$0
2
$40,370
APPLICATIONS DENIED
2
$46,215
13
$76,411
22
$63,503
5
$23,586
2
$97,210
APPLICATIONS WITHDRAWN
2
$33,995
2
$72,245
6
$91,543
0
$0
0
$0
FILES CLOSED FOR INCOMPLETENESS
0
$0
0
$0
1
$10,620
0
$0
0
$0
Aggregated Statistics For Year 1999 (Based on 1 partial tract)
A) FHA, FSA/RHS & VA Home Purchase Loans
B) Conventional Home Purchase Loans
C) Refinancings
D) Home Improvement Loans
F) Non-occupant Loans on < 5 Family Dwellings (A B C & D)
Detailed PMIC statistics for the following Tracts:0301.01
, 0303.00
2002 - 2018 National Fire Incident Reporting System (NFIRS) incidents
Based on the data from the years 2002 - 2018 the average number of fire incidents per year is 27. The highest number of fires - 61 took place in 2008, and the least - 12 in 2018. The data has a dropping trend.
When looking into fire subcategories, the most incidents belonged to: Structure Fires (55.2%), and Outside Fires (33.3%).
Fire incident types reported to NFIRS in Zip Code 24526


 Nearest zip codes: 24536, 24579, 24555, 24574, 24556, 24503.


 Based on the data from the years 2002 - 2018 the average number of fire incidents per year is 27. The highest number of fires - 61 took place in 2008, and the least - 12 in 2018. The data has a dropping trend.
 When looking into fire subcategories, the most incidents belonged to: Structure Fires (55.2%), and Outside Fires (33.3%).